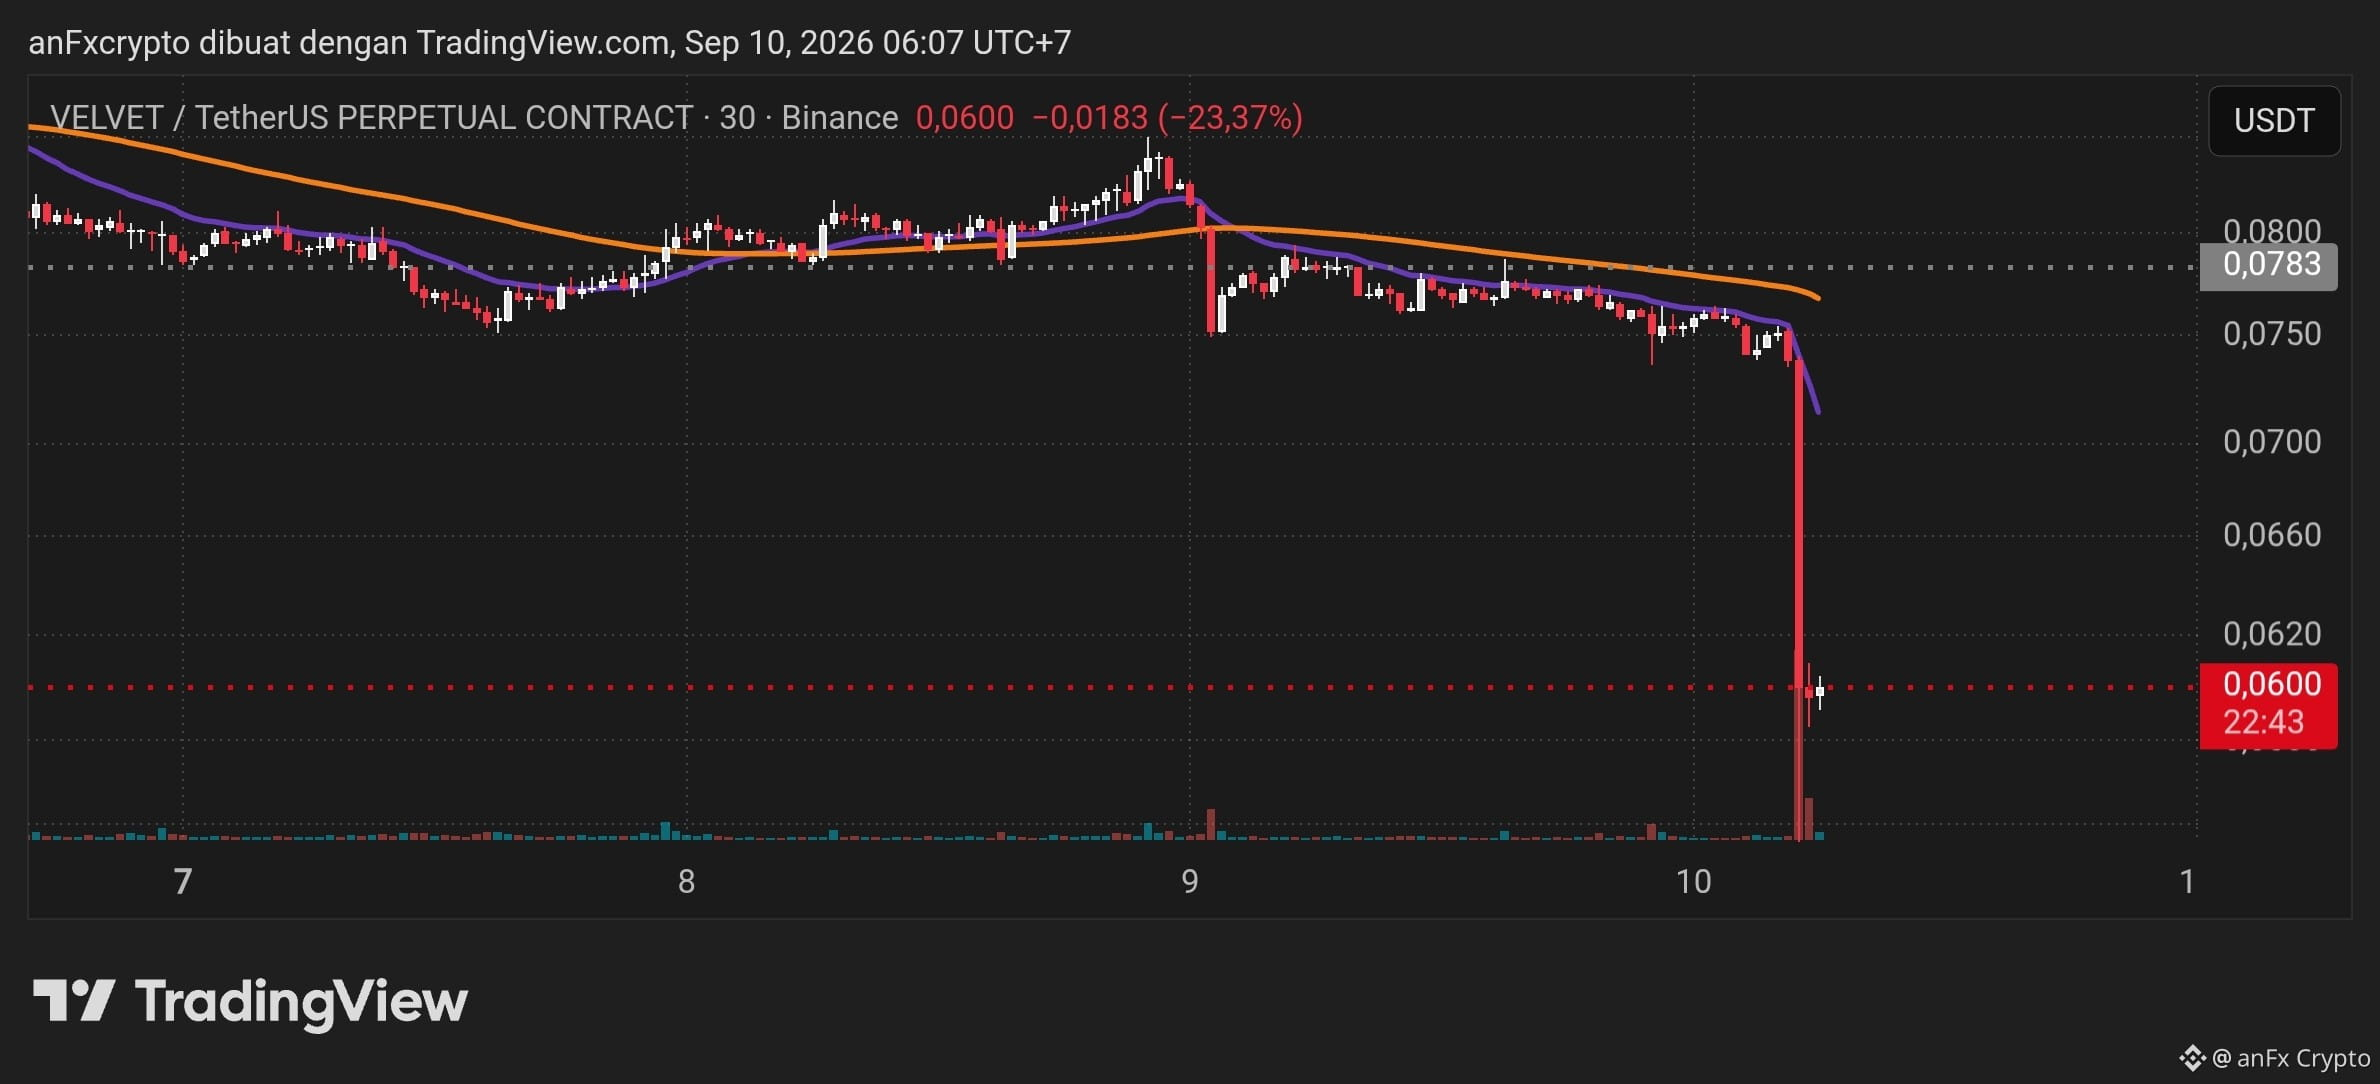
Chart $VELVET /USDT timeframe 30 minutes shows a panic selling pattern and massive liquidation, with a sudden drop of -23.37% toward the 0.0600 USDT level. An extreme volume spike on a long red candlestick indicates large-scale position dumping or a cascade liquidation.
Technical Analysis
* Trend Structure: Extremely bearish breakdown. Price action breaks below the lower bound of the consolidation area 0.0750–0.0783 USDT and trades far below the Moving Average lines (Purple and Orange).
* Volume: Very high transaction volume spike confirms dominant selling pressure, but on the other hand it often signals capitulation (market fear peak) in the short term.
* Support & Resistance:
* Local Support: 0.0580 – 0.0600 USDT (Current price area).
* Next Support: 0.0500 USDT.
* Nearest Resistance: 0.0680 – 0.0720 USDT (Pullback / MA area).
* Major Resistance: 0.0750 – 0.0783 USDT (Breakdown area).
Trading Plan & Signals
Given the extremely high volatility level, there are two trading scenarios that can be executed based on risk profile:
Scenario A: Retest Short (Main Scenario - Measured Risk)
Take advantage of potential temporary price recovery (dead cat bounce) to enter a Short position in line with the main trend.
* Entry Zone: 0.0680 – 0.0720 USDT (Wait for confirmation of rejection in the nearest resistance area)
* Take Profit 1: 0.0600 USDT
* Take Profit 2: 0.0520 USDT
* Stop Loss: 0.0755 USDT
* Recommended Leverage: Max 3x – 5x
Scenario B: Scalp Long / Bounce Play (Very Aggressive / High Risk)
Look for a short-term technical bounce (scalping) due to oversold market conditions.
* Entry Zone: 0.0580 – 0.0600 USDT (Make sure a lower wick appears on the 5m/15m TF as confirmation from buyers)
* Take Profit 1: 0.0660 USDT
* Take Profit 2: 0.0700 USDT
* Stop Loss: 0.0550 USDT (Tight, below the lowest low)
Technical Analysis
* Trend Structure: Extremely bearish breakdown. Price action breaks below the lower bound of the consolidation area 0.0750–0.0783 USDT and trades far below the Moving Average lines (Purple and Orange).
* Volume: Very high transaction volume spike confirms dominant selling pressure, but on the other hand it often signals capitulation (market fear peak) in the short term.
* Support & Resistance:
* Local Support: 0.0580 – 0.0600 USDT (Current price area).
* Next Support: 0.0500 USDT.
* Nearest Resistance: 0.0680 – 0.0720 USDT (Pullback / MA area).
* Major Resistance: 0.0750 – 0.0783 USDT (Breakdown area).
Trading Plan & Signals
Given the extremely high volatility level, there are two trading scenarios that can be executed based on risk profile:
Scenario A: Retest Short (Main Scenario - Measured Risk)
Take advantage of potential temporary price recovery (dead cat bounce) to enter a Short position in line with the main trend.
* Entry Zone: 0.0680 – 0.0720 USDT (Wait for confirmation of rejection in the nearest resistance area)
* Take Profit 1: 0.0600 USDT
* Take Profit 2: 0.0520 USDT
* Stop Loss: 0.0755 USDT
* Recommended Leverage: Max 3x – 5x
Scenario B: Scalp Long / Bounce Play (Very Aggressive / High Risk)
Look for a short-term technical bounce (scalping) due to oversold market conditions.
* Entry Zone: 0.0580 – 0.0600 USDT (Make sure a lower wick appears on the 5m/15m TF as confirmation from buyers)
* Take Profit 1: 0.0660 USDT
* Take Profit 2: 0.0700 USDT
* Stop Loss: 0.0550 USDT (Tight, below the lowest low)