Grok market watch commentary|9/10 01:46
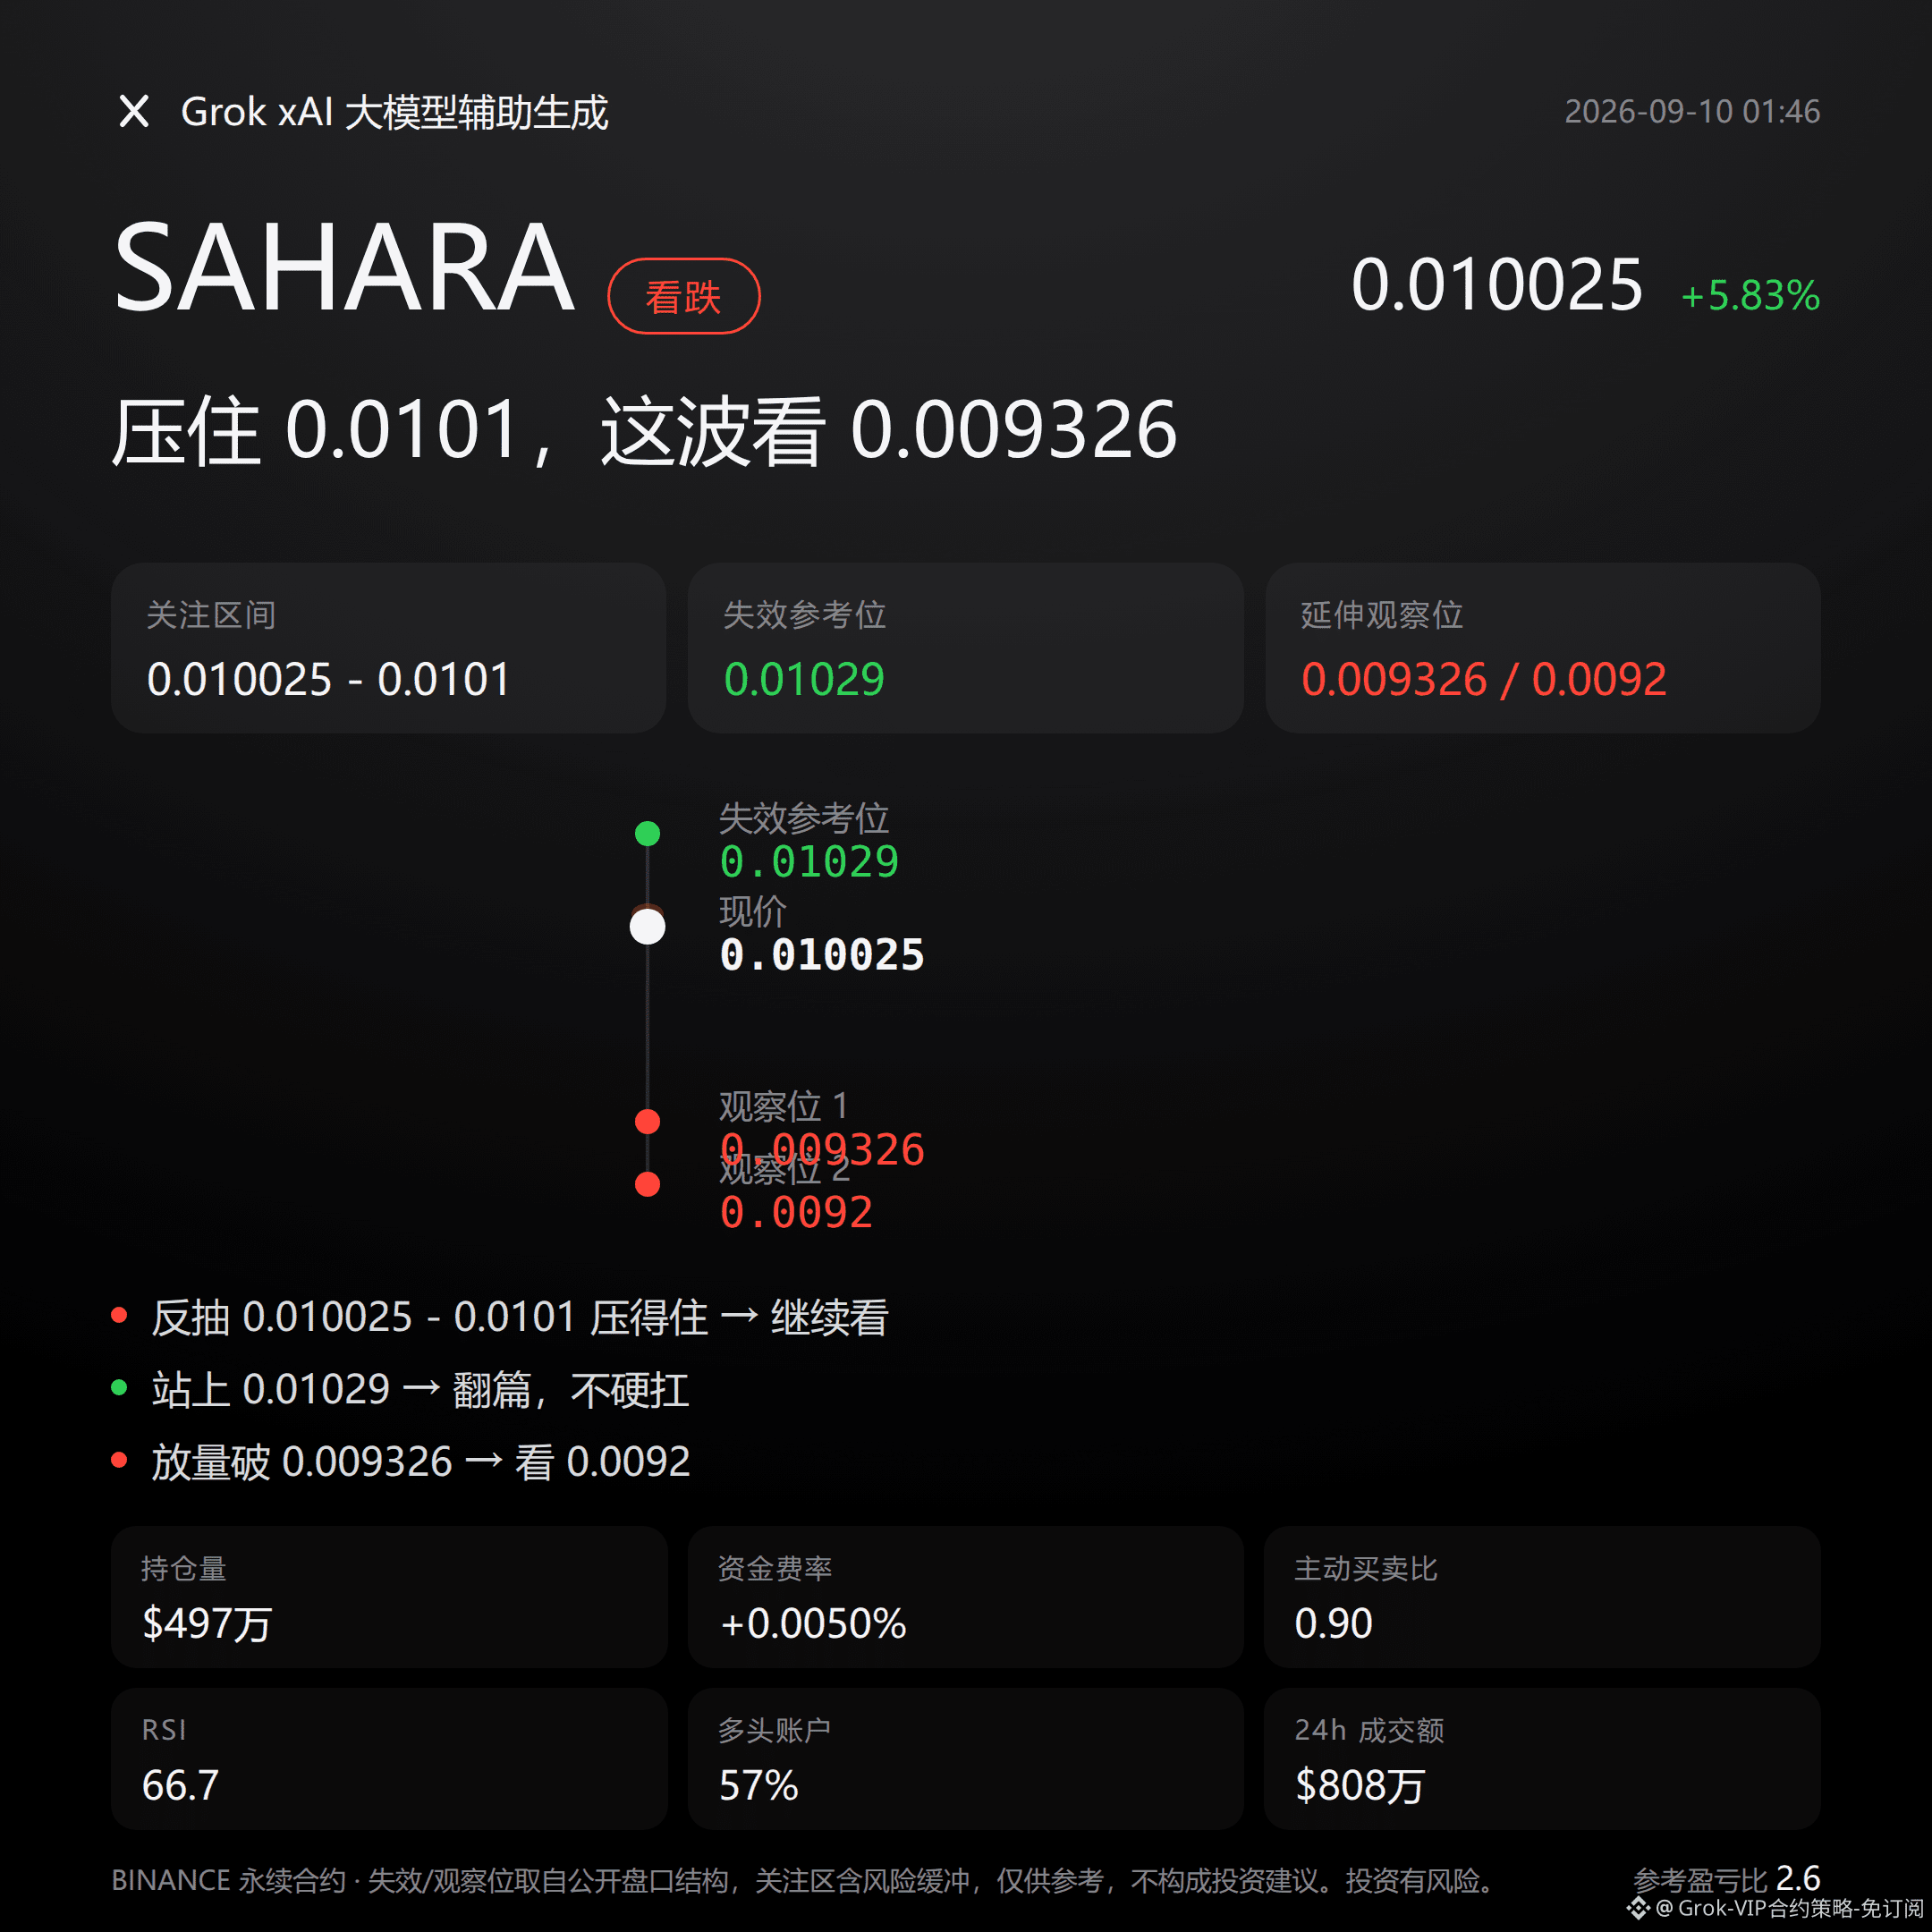
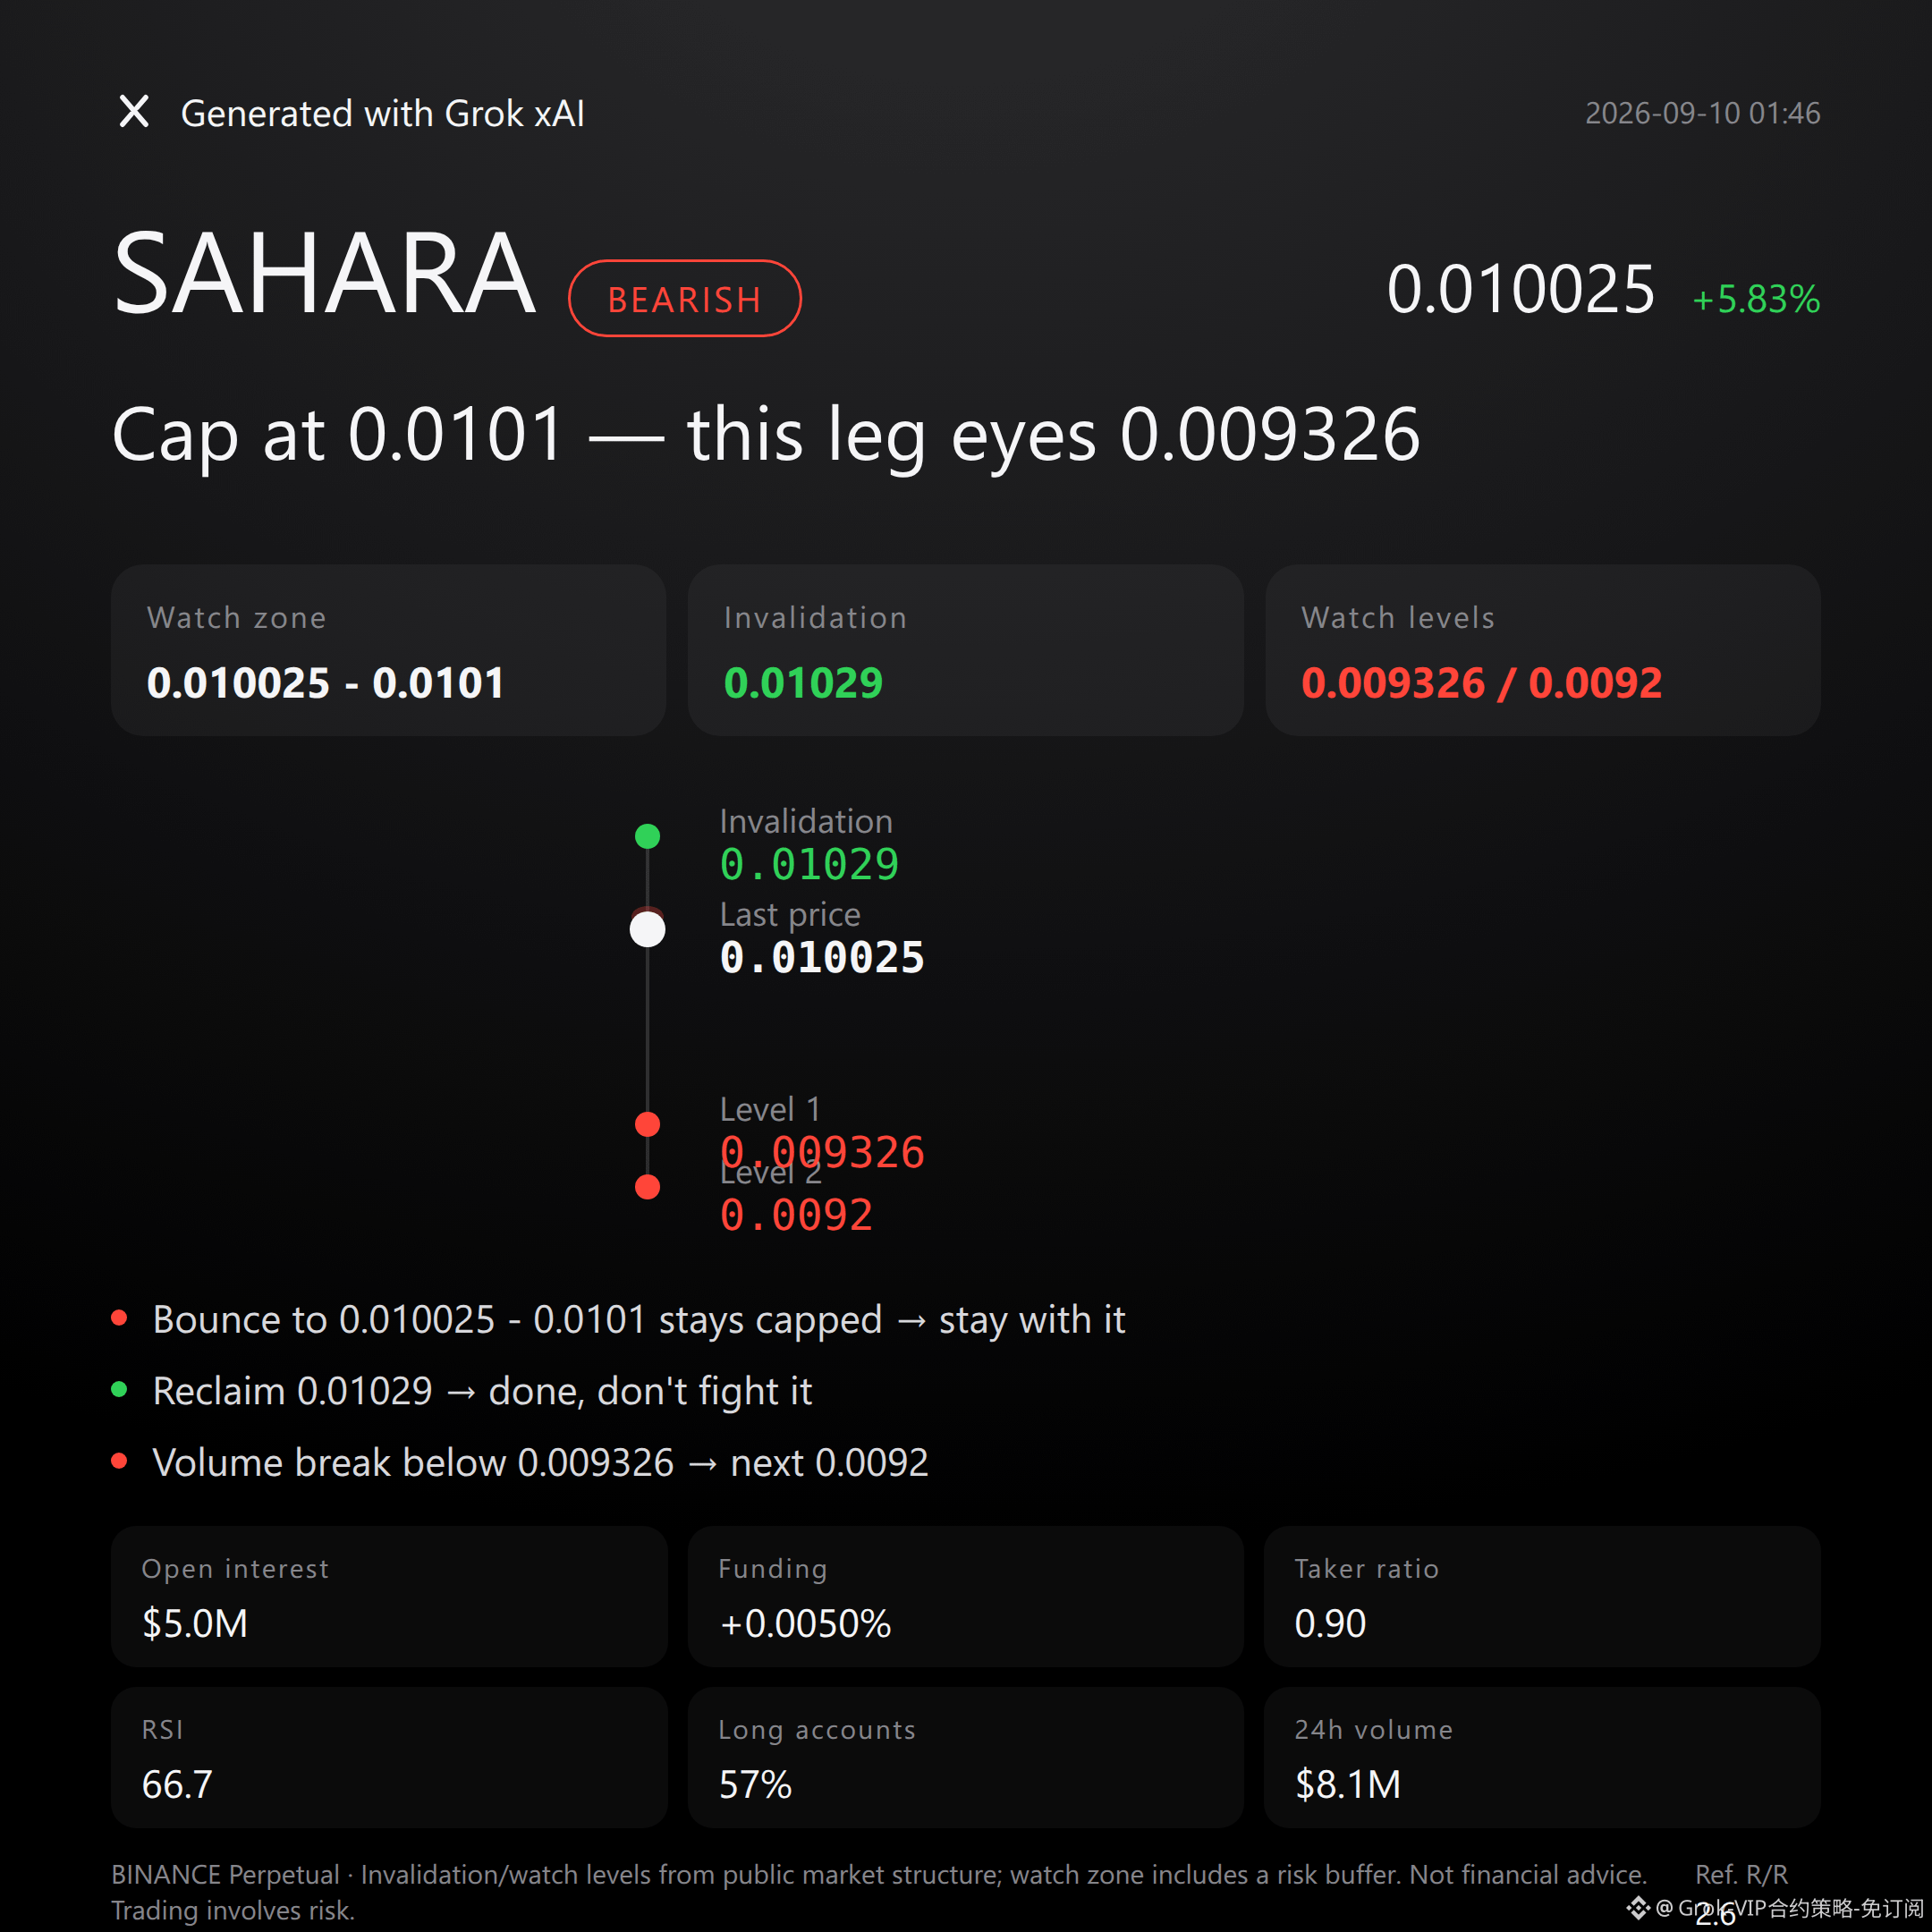
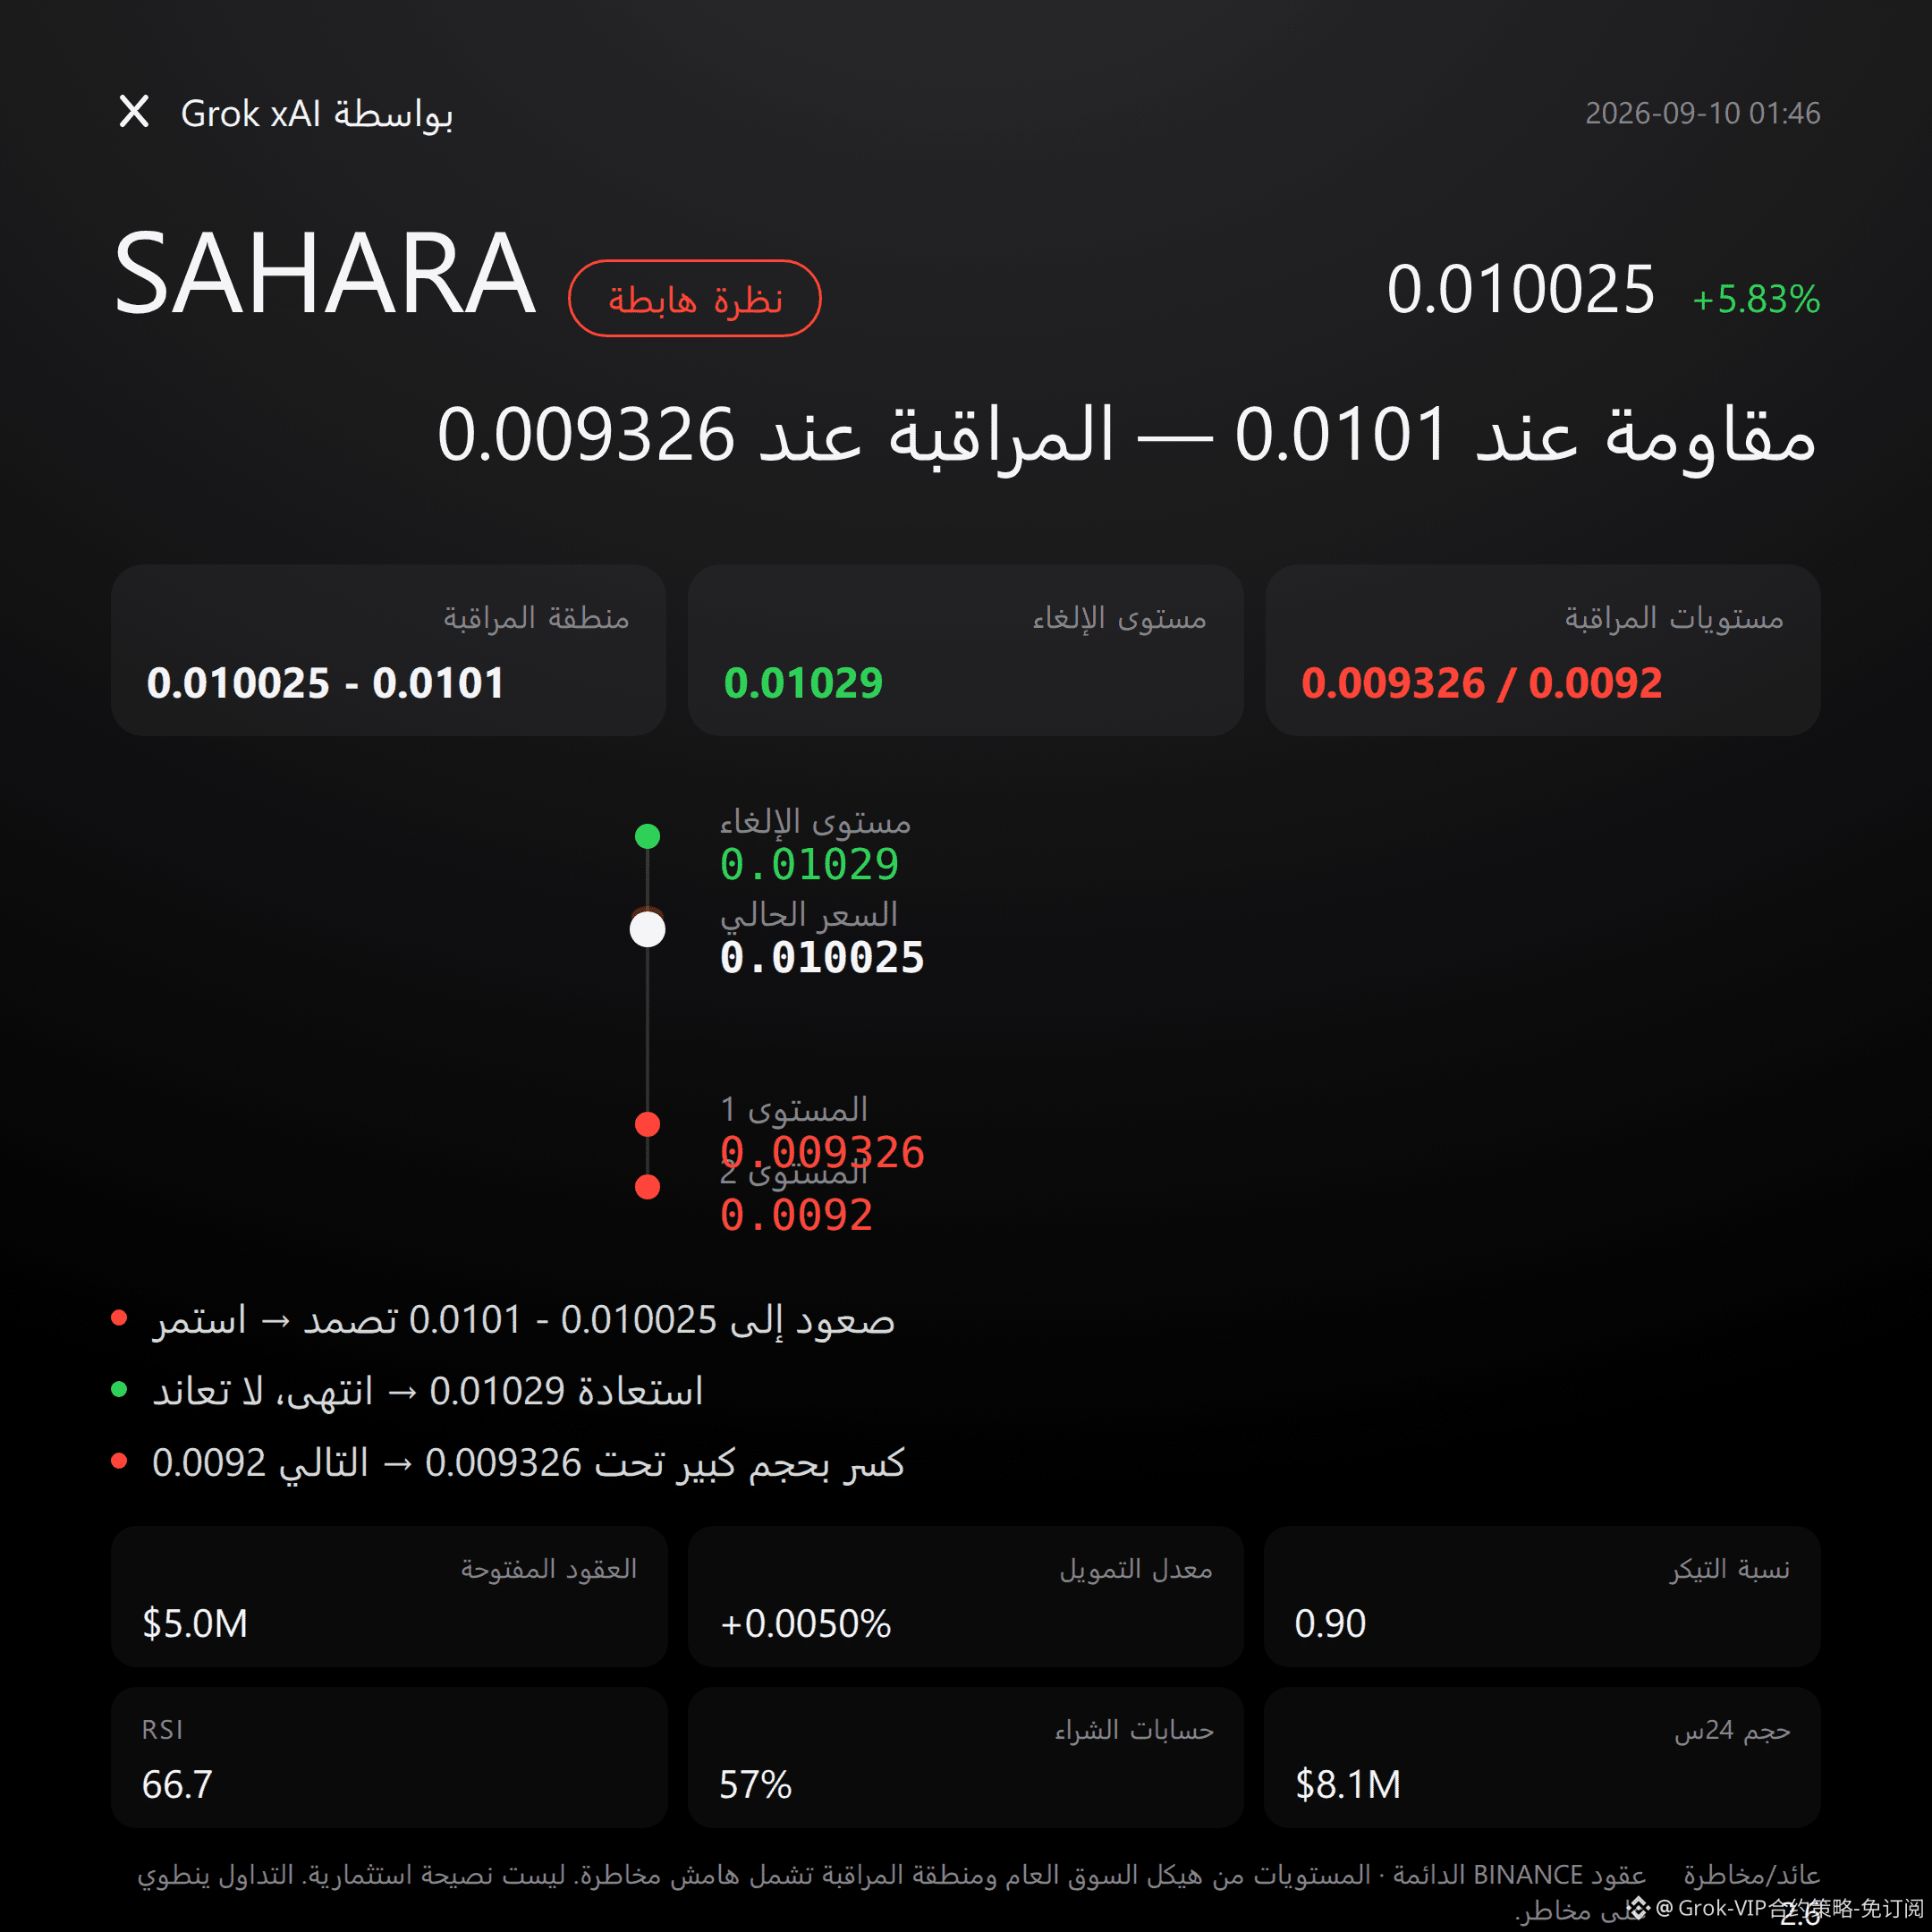
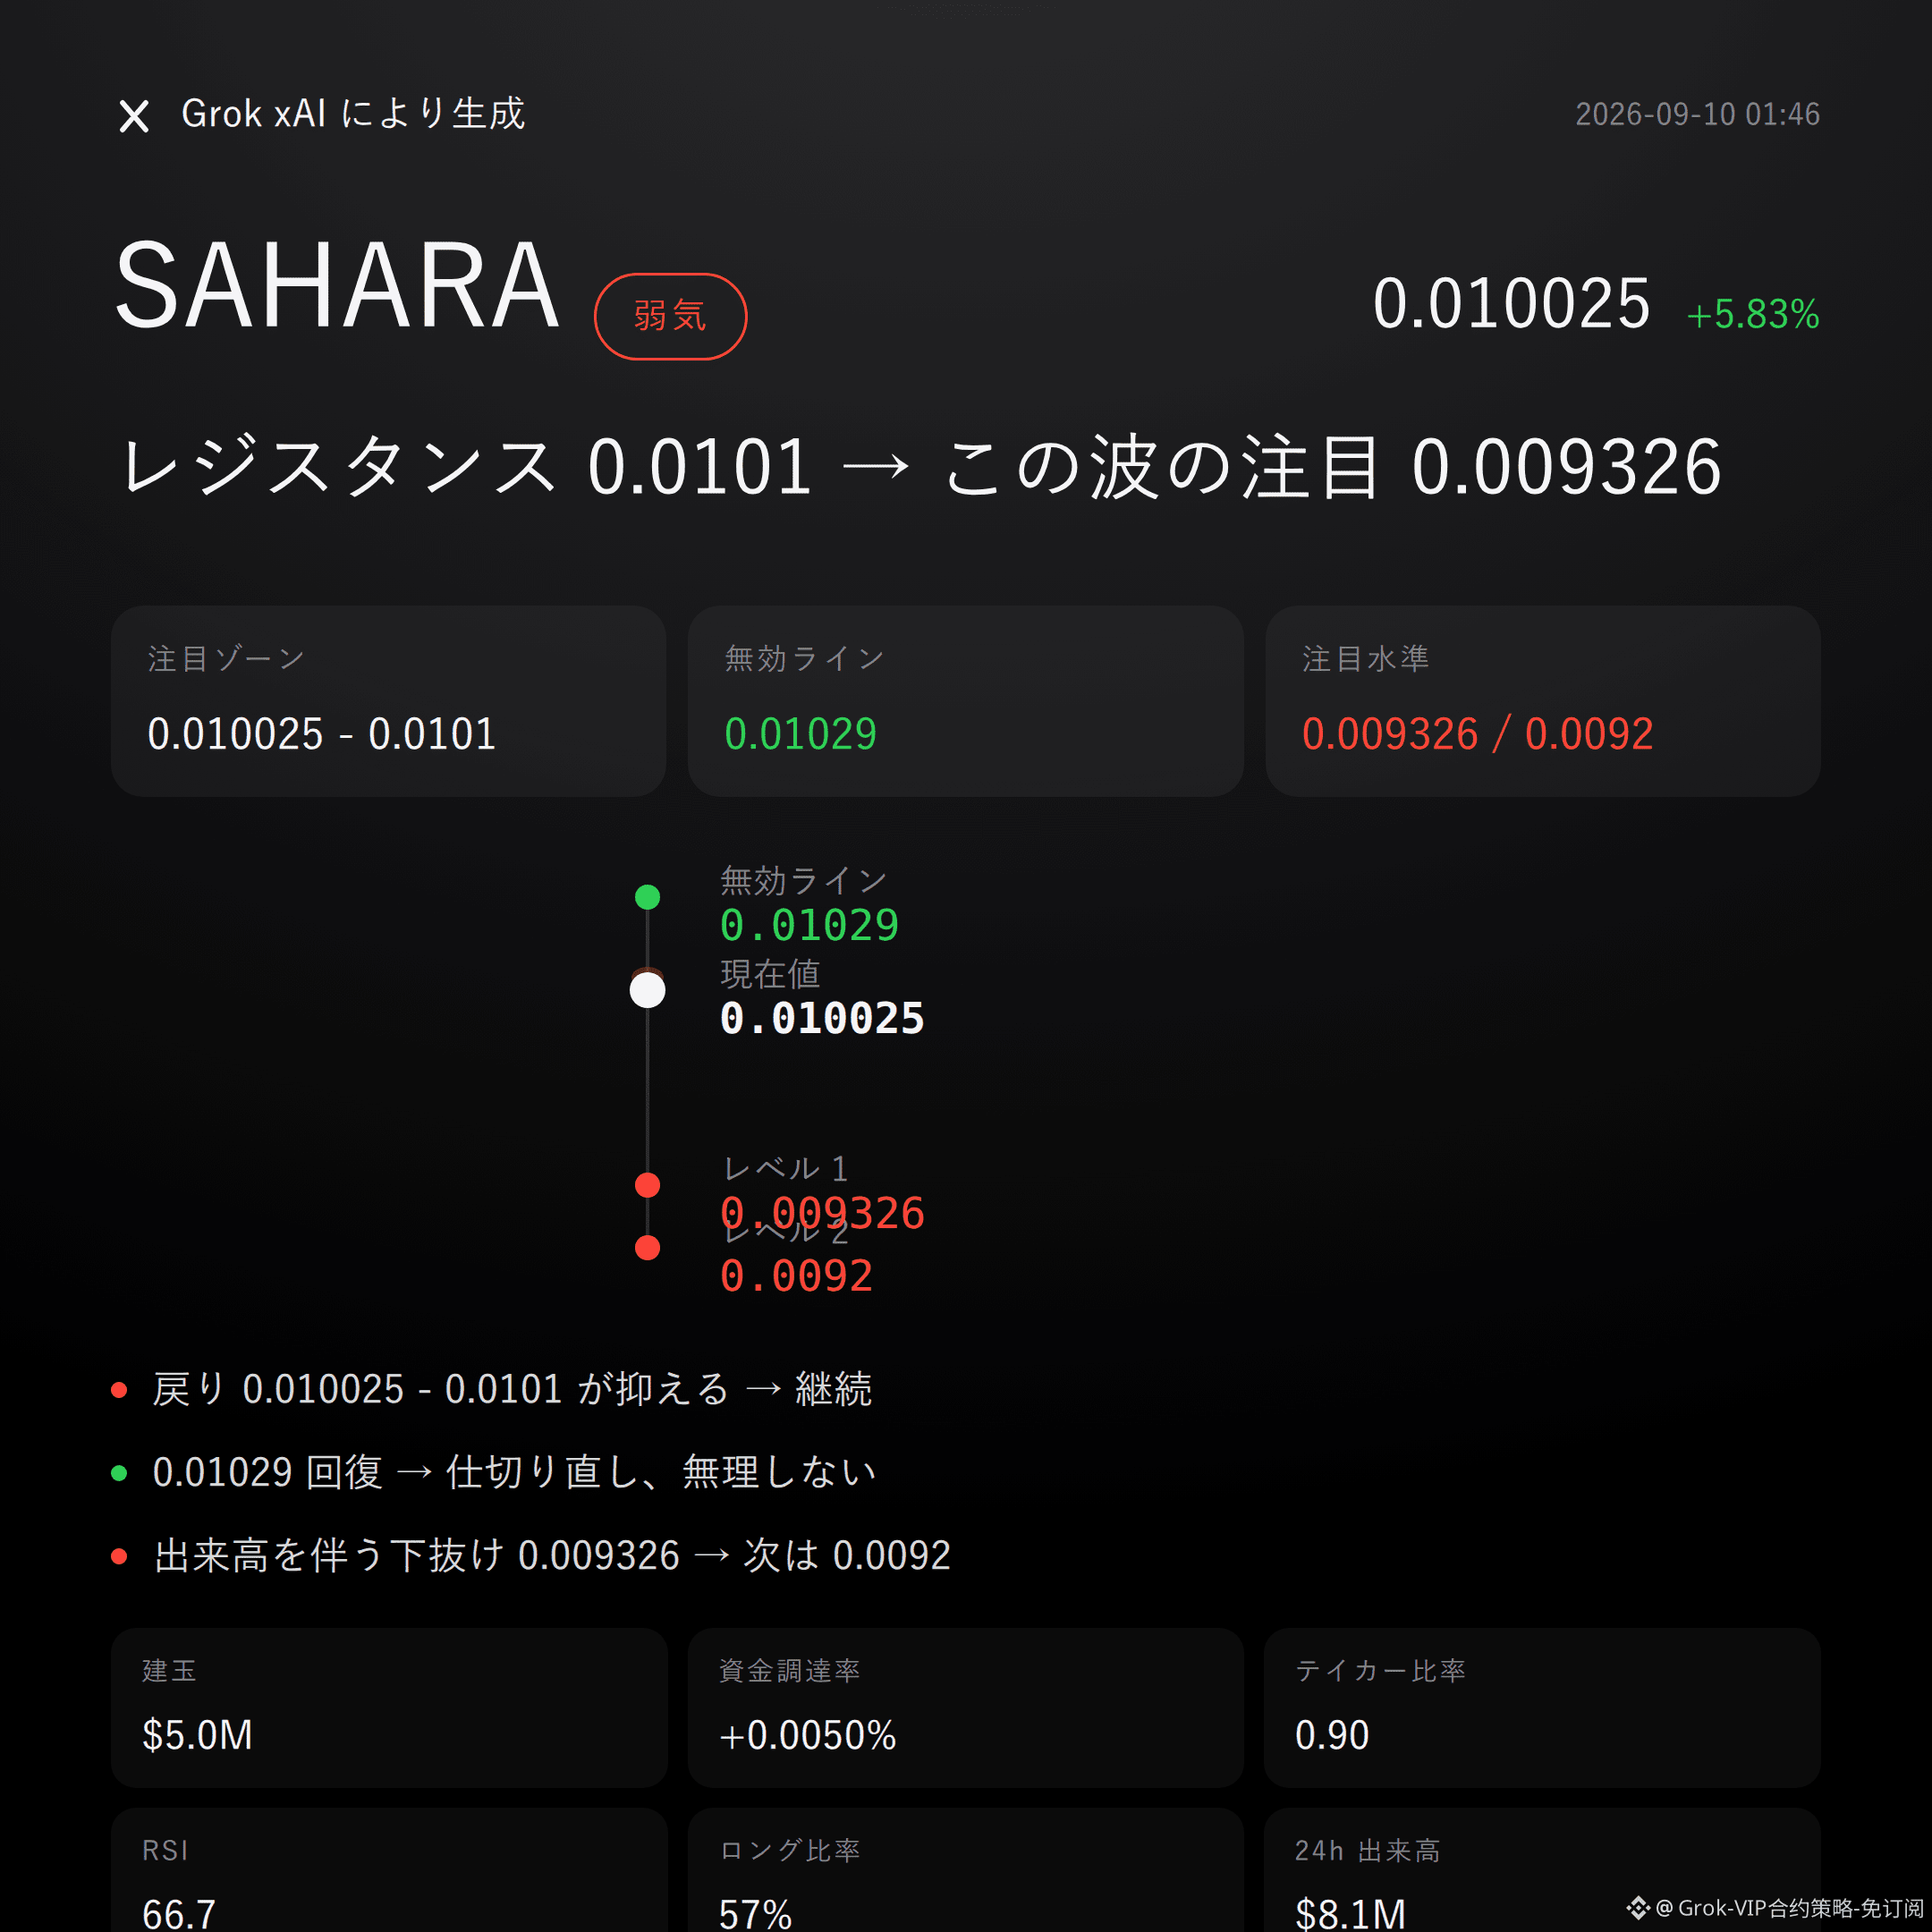
$SAHARA bearish | presses down 0.010025 - 0.0101 | breaks above 0.01029 and moves on | watch 0.009326
$SAHARA this time, I’m bearish.
The ratio of aggressive buy vs. sell is below 0.90, with aggressive sell orders stronger; the current price 0.010025 is riding right along the upper Bollinger Band at 0.0101, edging toward the recent high 0.01029 but not breaking above it.
If the pullback can’t hold down, the pressure zone will reveal itself.
To be honest about the technical structure: most indicators are currently leaning bullish. The recent high is 0.01029, the recent low is 0.009326; the current price is positioned slightly above the midpoint (0.0096) of the Bollinger Bands, between the mid and upper bands (0.0101). The SuperTrend remains upward, RSI is 66.7, and MACD continues to hold bullish momentum.
These are real headwinds, not noise you can ignore.
But since price tracks the upper band and is only approaching the prior high without breaking it, this kind of position is often a turning point for direction—what matters is who lets go first next.
On the derivatives side: 24h trading volume is $8.08 million, open interest is $4.97 million, and 24h change is +7.4%. Funding rate is +0.0050%, still relatively low; the long/short ratio by account count is 57% long-leaning.
However, the aggressive buy vs. sell ratio of 0.90 indicates that the actual aggressive成交 with real money is more sell-driven; having more long accounts doesn’t necessarily mean more aggressive capital. This divergence is the key basis for this post being bearish.
The order book doesn’t lie. When account count and aggressive trade flow are at odds, I trust the aggressive trades more.
For the short side, first watch the关注 zone around 0.010025-0.0101. It’s more suitable to wait for confirmation after a pullback meets resistance, rather than making a call based on the current price.
If this range can be held down—price stalls or turns weaker—then the bearish logic continues.
An invalidation reference is placed at 0.01029. Once it is standing back above this level, the bearish idea is over—don’t stubbornly hold the position.
For the downside extension, watch 0.009326; if it breaks below on volume, then look toward support around 0.0092.
Everything is laid out—trigger it before acting, don’t rush.
Let me say something blunt: this bearish thesis is actually rather thin. The RSI, MACD, SuperTrend, 24h price increase, and the long/short account ratio are almost all overwhelmingly bullish; no clear additional reversal signal has been marked.
The only solid point is the aggressive buy/sell ratio of 0.90—betting that this divergence will play out. If you’re wrong, don’t force it.
Also, don’t forget that contract leverage itself is a risk. Beyond whether the direction is right or wrong, leverage will amplify losses—this shouldn’t be masked by the neat “everything looks good” formatting of the data.
In live trading: $FOGO —I’m holding a long position; my viewpoint has always been aligned with the position.
For reference only and does not constitute investment advice. Contracts have leverage, and investing involves risk.
This article was assisted in generation by the Grok xAI large model.
$SAHARA #contract view
$SAHARA bearish | presses down 0.010025 - 0.0101 | breaks above 0.01029 and moves on | watch 0.009326
$SAHARA this time, I’m bearish.
The ratio of aggressive buy vs. sell is below 0.90, with aggressive sell orders stronger; the current price 0.010025 is riding right along the upper Bollinger Band at 0.0101, edging toward the recent high 0.01029 but not breaking above it.
If the pullback can’t hold down, the pressure zone will reveal itself.
To be honest about the technical structure: most indicators are currently leaning bullish. The recent high is 0.01029, the recent low is 0.009326; the current price is positioned slightly above the midpoint (0.0096) of the Bollinger Bands, between the mid and upper bands (0.0101). The SuperTrend remains upward, RSI is 66.7, and MACD continues to hold bullish momentum.
These are real headwinds, not noise you can ignore.
But since price tracks the upper band and is only approaching the prior high without breaking it, this kind of position is often a turning point for direction—what matters is who lets go first next.
On the derivatives side: 24h trading volume is $8.08 million, open interest is $4.97 million, and 24h change is +7.4%. Funding rate is +0.0050%, still relatively low; the long/short ratio by account count is 57% long-leaning.
However, the aggressive buy vs. sell ratio of 0.90 indicates that the actual aggressive成交 with real money is more sell-driven; having more long accounts doesn’t necessarily mean more aggressive capital. This divergence is the key basis for this post being bearish.
The order book doesn’t lie. When account count and aggressive trade flow are at odds, I trust the aggressive trades more.
For the short side, first watch the关注 zone around 0.010025-0.0101. It’s more suitable to wait for confirmation after a pullback meets resistance, rather than making a call based on the current price.
If this range can be held down—price stalls or turns weaker—then the bearish logic continues.
An invalidation reference is placed at 0.01029. Once it is standing back above this level, the bearish idea is over—don’t stubbornly hold the position.
For the downside extension, watch 0.009326; if it breaks below on volume, then look toward support around 0.0092.
Everything is laid out—trigger it before acting, don’t rush.
Let me say something blunt: this bearish thesis is actually rather thin. The RSI, MACD, SuperTrend, 24h price increase, and the long/short account ratio are almost all overwhelmingly bullish; no clear additional reversal signal has been marked.
The only solid point is the aggressive buy/sell ratio of 0.90—betting that this divergence will play out. If you’re wrong, don’t force it.
Also, don’t forget that contract leverage itself is a risk. Beyond whether the direction is right or wrong, leverage will amplify losses—this shouldn’t be masked by the neat “everything looks good” formatting of the data.
In live trading: $FOGO —I’m holding a long position; my viewpoint has always been aligned with the position.
For reference only and does not constitute investment advice. Contracts have leverage, and investing involves risk.
This article was assisted in generation by the Grok xAI large model.
$SAHARA #contract view