
自由1688
346 Posts

自由1688

ETH Holder
Occasional Trader
2 Years
582 Following
23.3K+ Followers
14.9K+ Liked
Posts
All
Quotes
Videos
Live
PINNED

PINNED




Syco 疯子
·
--
🧧🧧New fan exclusive benefits are here!
Unlocking surprise rewards is super easy😊
Just leave a comment reply and that's it☺️
Benefits🧧🧧are immediately available,
hurry up!
$BNB
Unlocking surprise rewards is super easy😊
Just leave a comment reply and that's it☺️
Benefits🧧🧧are immediately available,
hurry up!
$BNB


Bilverse
·
--
🧧 THE ETH RED PACKET IS BACK. 🧧
The market moves fast.
But real community? That stays. 🧡
We’re giving back to the people who keep building, supporting, and believing in Ethereum through every up and down. 🔥
👀 Want a shot at the ETH red packet?
👇 HOW TO ENTER:
✅ Follow @Bilverse
💬 Comment “YES” below
❤️ Like + repost to spread the ETH love
That’s it. No complicated steps. 🚀
Maybe your next notification says: “You received ETH.” 👀💰
If you’re still here, still building, and still bullish on the future…
THIS RED PACKET IS FOR YOU. 🧧🫡
#ETH #RedPacketMission #Giveaway #Bilverse #CryptoCommunity
The market moves fast.
But real community? That stays. 🧡
We’re giving back to the people who keep building, supporting, and believing in Ethereum through every up and down. 🔥
👀 Want a shot at the ETH red packet?
👇 HOW TO ENTER:
✅ Follow @Bilverse
💬 Comment “YES” below
❤️ Like + repost to spread the ETH love
That’s it. No complicated steps. 🚀
Maybe your next notification says: “You received ETH.” 👀💰
If you’re still here, still building, and still bullish on the future…
THIS RED PACKET IS FOR YOU. 🧧🫡
#ETH #RedPacketMission #Giveaway #Bilverse #CryptoCommunity


白鲨观点
·
--
BTC drops below the 78,000 mark; today’s PPI is the "trailer" for tomorrow’s CPI
This morning, BTC tested the 78,000 support and dipped as low as 77,900.
The market is like a fully drawn bow—just waiting for tonight’s PPI and tomorrow’s CPI to release the string.
Let’s first talk about why PPI matters.
PPI is the Producer Price Index, essentially a "leading indicator" for CPI—
When factory costs rise, it will eventually filter through to consumers.
Market expectations: PPI m/m +0.2%, y/y +1.4%.
If it comes in above expectations, it’s basically a preview that tomorrow’s CPI won’t look good either,
and the probability of further rate hikes will keep climbing—BTC will likely have to test lower levels.
On the other hand, if PPI comes in below expectations,
the market will advance its optimism that "CPI may also cool off,"
and the 80,000 level might be reclaimed just like that.
My plan today: I’m not betting on direction—I'll wait for the data.
I’ve reduced my position to 30%, keeping plenty of dry powder. I’ll act once the data is out.
The PPI data will be released tonight at 20:30. I’ll interpret it in real time in the chatroom.
If you want to know first how the data will impact the market, click my avatar to enter the chatroom. Code: "PPI".
By the way, do you think today’s PPI will beat expectations or come in below them?
Place your bets in the comments: beat expectations deduct 1, below expectations deduct 2.
#BinanceSquare #bitcoin #PPI #加密市场 #CPI前瞻
This morning, BTC tested the 78,000 support and dipped as low as 77,900.
The market is like a fully drawn bow—just waiting for tonight’s PPI and tomorrow’s CPI to release the string.
Let’s first talk about why PPI matters.
PPI is the Producer Price Index, essentially a "leading indicator" for CPI—
When factory costs rise, it will eventually filter through to consumers.
Market expectations: PPI m/m +0.2%, y/y +1.4%.
If it comes in above expectations, it’s basically a preview that tomorrow’s CPI won’t look good either,
and the probability of further rate hikes will keep climbing—BTC will likely have to test lower levels.
On the other hand, if PPI comes in below expectations,
the market will advance its optimism that "CPI may also cool off,"
and the 80,000 level might be reclaimed just like that.
My plan today: I’m not betting on direction—I'll wait for the data.
I’ve reduced my position to 30%, keeping plenty of dry powder. I’ll act once the data is out.
The PPI data will be released tonight at 20:30. I’ll interpret it in real time in the chatroom.
If you want to know first how the data will impact the market, click my avatar to enter the chatroom. Code: "PPI".
By the way, do you think today’s PPI will beat expectations or come in below them?
Place your bets in the comments: beat expectations deduct 1, below expectations deduct 2.
#BinanceSquare #bitcoin #PPI #加密市场 #CPI前瞻


Aria Daisy 阿莉娅_黛西
·
--
Bearish🎁 BNB COIN GIVEAWAY 🎁
I’m excited to share a 1,000 BNB giveaway with 10 lucky winners! 🔥💛
How to participate:
✅ Follow me
🔄 Repost this post
💬 Comment “3”
Thank you for all your love and support! ❤️
Good luck everyone! 🍀🚀
#BinanceSquareTalks #BNB走势
$BNB $BTC
I’m excited to share a 1,000 BNB giveaway with 10 lucky winners! 🔥💛
How to participate:
✅ Follow me
🔄 Repost this post
💬 Comment “3”
Thank you for all your love and support! ❤️
Good luck everyone! 🍀🚀
#BinanceSquareTalks #BNB走势
$BNB $BTC


奕澤YiiiiiZze
·
--
🧧Using decentralized consensus to gather the strength to move forward—together, we open up an infinitely broad future for Web3.
Follow, like, and share🎁
———LUCiC
Follow, like, and share🎁
———LUCiC


Mahi_玛希BNB
·
--
Bullish🟡 Binance Square — BTC Market Update
BTC is holding near $79K as traders watch the next breakout. $BTC is currently around $79.2K, with the $82K–$83K resistance zone remaining important. A strong break above this area could improve bullish momentum, while losing the $78.7K support could bring more downside pressure.
1️⃣ **Follow MAHI BNB** ✅
2️⃣ **Like & Comment “BTC”** ✅
3️⃣ **Repost This Post** 🔄✅
4️⃣ **Stay Tuned for the Next Gift 🎁🧧** ✅
For now, volume + price action are key. Stay patient and manage risk. 📊
#BTC #Crypto #CryptoTrading #Binance #BinanceSquare #Trading #CryptoMarketMoves #writetoearn
$BNB $ETH
BTC is holding near $79K as traders watch the next breakout. $BTC is currently around $79.2K, with the $82K–$83K resistance zone remaining important. A strong break above this area could improve bullish momentum, while losing the $78.7K support could bring more downside pressure.
1️⃣ **Follow MAHI BNB** ✅
2️⃣ **Like & Comment “BTC”** ✅
3️⃣ **Repost This Post** 🔄✅
4️⃣ **Stay Tuned for the Next Gift 🎁🧧** ✅
For now, volume + price action are key. Stay patient and manage risk. 📊
#BTC #Crypto #CryptoTrading #Binance #BinanceSquare #Trading #CryptoMarketMoves #writetoearn
$BNB $ETH


Shaheen 69
·
--
Bullish🎁 A little red packet of Ethereum with a lot of RESPECT ❤️
This is my small gesture of love and gratitude to my amazing community, supporters, friends, and well-wishers. 🙏
May this ETH bring you happiness, prosperity, success, and good fortune. 🌟
Keep supporting, keep believing, and let’s grow together! 🚀
With love & respect — Shaheen69 ❤️
$ETH
This is my small gesture of love and gratitude to my amazing community, supporters, friends, and well-wishers. 🙏
May this ETH bring you happiness, prosperity, success, and good fortune. 🌟
Keep supporting, keep believing, and let’s grow together! 🚀
With love & respect — Shaheen69 ❤️
$ETH


灼见
·
--
🚨 BNB suddenly drops 4%, BTC holds around $78K, while another sector is exploding against the trend.
Today’s market is starting to look a bit different.
In the past few days, we’ve been seeing:
$BTC moving sideways.
$ETH showing resilience.
$BNB clearly outperforming the market.
But today—
the strength/weakness relationship has suddenly changed.
$BTC is still consolidating near $78K.
$ETH remains around $2.47K.
One of the most strong large-cap assets from the past few days, $BNB, has instead shown a noticeable pullback of about 4%.
Meanwhile:
ZEC is rising about 5% against the trend.
This tells me a very important signal:
Capital hasn’t disappeared—it’s just moving to a new place.
The market is becoming less and less like:
“BTC goes up → all coins go up together.”
Instead, it looks more like:
BTC moves sideways → capital keeps hunting for new hotspots.
BNB Chain.
DeFi.
Privacy sector.
Who will be next?
That’s what’s most worth paying attention to right now.
Because the macro environment isn’t easy:
🛢️ Oil prices are still above $100
📈 Global bond yields continue to rise
🏦 The Fed’s rate decision is getting closer
📊 PPI / CPI are coming out soon
In theory, this environment should suppress risk assets.
But within Crypto, local rallies keep happening.
This suggests the market may be shifting from:
“BUY EVERYTHING”
to:
“FIND THE WINNER”.
So I’m not going to dismiss BNB just because it’s down 4% in a day, and I’m also not going to chase a coin just because it’s up one day.
I’d rather observe:
🟠 BTC: can it keep defending the market’s “floor”?
🟣 ETH: after the 37% surge, can consolidation turn into the next breakout?
🟡 BNB: is this pullback just a cooldown, or does it signal the end of the ecosystem rally?
🔥 Altcoins: where will the next stop of capital be?
With the upcoming PPI, CPI, and FOMC,
it will very likely determine the true next major direction.
But before that—
ROTATION has already started.
👇 If you could pick only one right now, who do you think will break out first next?
BTC / ETH / BNB?
#BTC #ETH #BNB
Today’s market is starting to look a bit different.
In the past few days, we’ve been seeing:
$BTC moving sideways.
$ETH showing resilience.
$BNB clearly outperforming the market.
But today—
the strength/weakness relationship has suddenly changed.
$BTC is still consolidating near $78K.
$ETH remains around $2.47K.
One of the most strong large-cap assets from the past few days, $BNB, has instead shown a noticeable pullback of about 4%.
Meanwhile:
ZEC is rising about 5% against the trend.
This tells me a very important signal:
Capital hasn’t disappeared—it’s just moving to a new place.
The market is becoming less and less like:
“BTC goes up → all coins go up together.”
Instead, it looks more like:
BTC moves sideways → capital keeps hunting for new hotspots.
BNB Chain.
DeFi.
Privacy sector.
Who will be next?
That’s what’s most worth paying attention to right now.
Because the macro environment isn’t easy:
🛢️ Oil prices are still above $100
📈 Global bond yields continue to rise
🏦 The Fed’s rate decision is getting closer
📊 PPI / CPI are coming out soon
In theory, this environment should suppress risk assets.
But within Crypto, local rallies keep happening.
This suggests the market may be shifting from:
“BUY EVERYTHING”
to:
“FIND THE WINNER”.
So I’m not going to dismiss BNB just because it’s down 4% in a day, and I’m also not going to chase a coin just because it’s up one day.
I’d rather observe:
🟠 BTC: can it keep defending the market’s “floor”?
🟣 ETH: after the 37% surge, can consolidation turn into the next breakout?
🟡 BNB: is this pullback just a cooldown, or does it signal the end of the ecosystem rally?
🔥 Altcoins: where will the next stop of capital be?
With the upcoming PPI, CPI, and FOMC,
it will very likely determine the true next major direction.
But before that—
ROTATION has already started.
👇 If you could pick only one right now, who do you think will break out first next?
BTC / ETH / BNB?
#BTC #ETH #BNB


大丽7613
·
--
Bitcoin’s rebound hides a trap: big players are collectively exiting. What should you do next?
Many people are confused right now: Bitcoin is clearly rebounding—so why are top whales quietly unloading and leaving? What should you hold at this moment: buy the dip, or take profit? This piece lays out the future timing, key risk turning points, and a clear trading approach all at once. Watch it carefully to avoid missing out and ending up stuck—losing on both ends!
1. On the technical chart, it’s clear that Bitcoin’s daily chart has already formed a dead-cross structure, with bullish momentum continuing to weaken. The uptrend’s fatigue is showing. This current round of secondary high-push rebound is not a brand-new market start—it's simply short-term bullish sentiment as traders front-run the outcome of the crypto bill decision.
Here’s the key reminder for everyone: at this stage, you must never chase longs. If you’re still holding long positions, use this spike to take profit at highs—lock in gains and don’t get greedy trying to bet on the “tail of the wave.”
2. Taking time cycles and market rhythm into account, the prediction is: around September 15, Bitcoin will begin a two-week pullback and shakeout. The pullback window will continue until the end of September. After this deeper pullback ends, there will be a very high-quality opportunity to enter on dips during this cycle.
There are two different position strategies here: for long-term spot holdings, you can be patient and hold through, keeping your bigger-picture view until the endpoint of this bull market. But for leveraged contract longs—once you’ve already captured a large wave of profit—you must protect your gains and lock them in safely; don’t let unrealized profit turn into unrealized losses.
3. Now let’s address the macro key point many people overlook: international oil prices have been surging continuously. There isn’t much time left for the U.S. side to adjust policy. After that, the probability of policy cooling down and actively hitting the market is steadily increasing.
If oil prices suddenly crash and correct, it will directly lead to passive liquidity easing in U.S. stocks and in the crypto market, triggering a short-term rally. This creates two-way uncertainty in the market right now: the crypto bill’s positive news around September 15 is likely to be priced in quickly—when it lands, gains are often “good news, sell the news,” followed by a pullback. But the rebound driven by oil-price correlation is completely random in timing.
The bull market is still ongoing, and the truly big moves and real opportunities are still ahead. Our only core strategy right now is: protect the profits you already have, avoid the risk of short-term pullbacks, and wait for the bottom.
Nail the rhythm, and you’ll see the bull market multiply
Many people are confused right now: Bitcoin is clearly rebounding—so why are top whales quietly unloading and leaving? What should you hold at this moment: buy the dip, or take profit? This piece lays out the future timing, key risk turning points, and a clear trading approach all at once. Watch it carefully to avoid missing out and ending up stuck—losing on both ends!
1. On the technical chart, it’s clear that Bitcoin’s daily chart has already formed a dead-cross structure, with bullish momentum continuing to weaken. The uptrend’s fatigue is showing. This current round of secondary high-push rebound is not a brand-new market start—it's simply short-term bullish sentiment as traders front-run the outcome of the crypto bill decision.
Here’s the key reminder for everyone: at this stage, you must never chase longs. If you’re still holding long positions, use this spike to take profit at highs—lock in gains and don’t get greedy trying to bet on the “tail of the wave.”
2. Taking time cycles and market rhythm into account, the prediction is: around September 15, Bitcoin will begin a two-week pullback and shakeout. The pullback window will continue until the end of September. After this deeper pullback ends, there will be a very high-quality opportunity to enter on dips during this cycle.
There are two different position strategies here: for long-term spot holdings, you can be patient and hold through, keeping your bigger-picture view until the endpoint of this bull market. But for leveraged contract longs—once you’ve already captured a large wave of profit—you must protect your gains and lock them in safely; don’t let unrealized profit turn into unrealized losses.
3. Now let’s address the macro key point many people overlook: international oil prices have been surging continuously. There isn’t much time left for the U.S. side to adjust policy. After that, the probability of policy cooling down and actively hitting the market is steadily increasing.
If oil prices suddenly crash and correct, it will directly lead to passive liquidity easing in U.S. stocks and in the crypto market, triggering a short-term rally. This creates two-way uncertainty in the market right now: the crypto bill’s positive news around September 15 is likely to be priced in quickly—when it lands, gains are often “good news, sell the news,” followed by a pullback. But the rebound driven by oil-price correlation is completely random in timing.
The bull market is still ongoing, and the truly big moves and real opportunities are still ahead. Our only core strategy right now is: protect the profits you already have, avoid the risk of short-term pullbacks, and wait for the bottom.
Nail the rhythm, and you’ll see the bull market multiply

奋斗Hustle1688
·
--
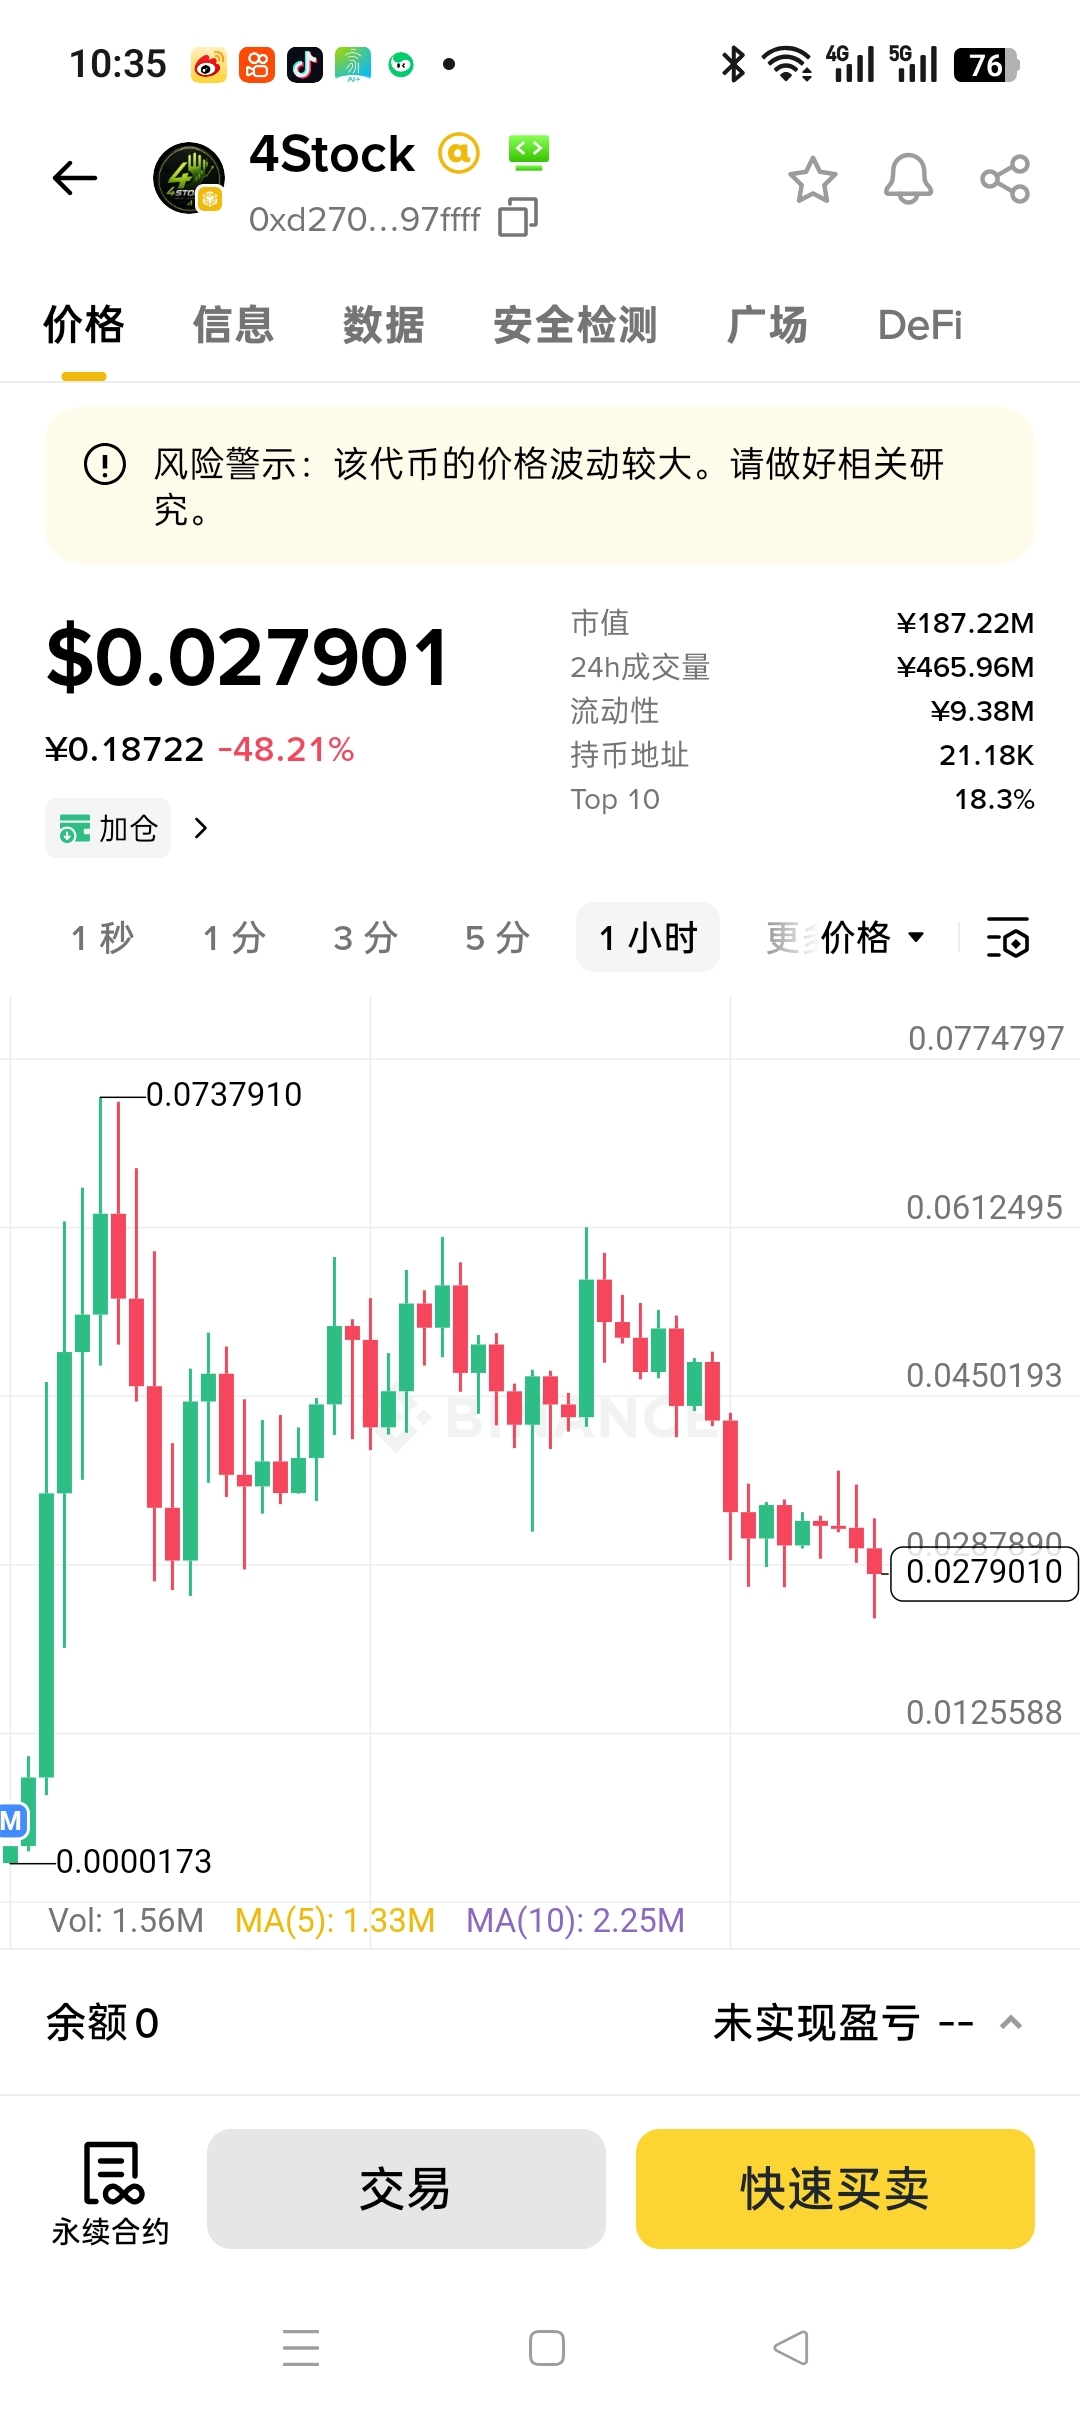
$4Stock has only been two days and it’s already up on Alpha. At this pace, the contract and spot should be coming soon too. The price hasn’t been pumped up yet, so I think this level is a good spot to enter a bit. It’s the first project on BNB Chain that plays “stock goes on-chain first, then uses this stock token as the base pool for a Meme.” The first stock token is BNC4, and the first Meme paired with it is $4Stock

分析师尤斯
·
--
Comment to get your bonus. 3 sharers will win $5 each.

Quoted content has been removed

橙子Joyce
·
--
$SpaceX (SPCX.US)$ After nearly two months, the company’s market capitalization has once again risen above $2 trillion. Estimated in a report: SpaceX’s weight in the Nasdaq-100 is expected to increase to about 1.51%, which would drive passive net buying of roughly $12.4 billion in stocks by index funds and ETFs tracking the index. However, it’s worth noting that passive buying is mechanism-driven and represents predictable inflows; some “smart money” may have already positioned ahead of time. When the effect actually takes hold, the degree of upward price elasticity depends on the attitude of active capital at that time. The following reviews SpaceX’s current stock price trend and key structure one by one from a technical perspective.
SpaceX is currently maintaining a short-term uptrend, with a strong breakout from the prior consolidation range, and the structure is intact. Of note, the EMA60 has crossed above the EMA20, and short- to mid-term momentum remains biased bullish.
Key Technical Indicator Interpretations
EMA moving averages: EMA5 is $148.07, EMA10 is $144.87, EMA20 is $140.99. The EMA60 breaking above the EMA20 is an upgrade signal for the medium-term structural trend; the moving-average structure is healthy.
RSI: 62.58, sitting in a neutral-to-strong range. Over the past 10 days, the RSI has risen in step with the stock price; no top divergence is evident, and momentum is still present.
MACD: The MACD line (4.01) > the Signal line (2.58). The histogram is positive and continues to expand. The golden cross is maintained. With the indicator located above the zero axis, bullish momentum continues to strengthen, with no divergence observed.
Bollinger Bands: The bands are in an expansion phase. The latest closing price of $153.47 has broken above the upper band, indicating a strong trend. However, be cautious of the risk of a mean reversion back toward the middle band that can be triggered when band width expands and then narrows.
Fibonacci: The current price of $153.47 is above the Fibonacci 61.8% level ($150.98) and below the Fibonacci 50.0% level ($165.23). The next upside target reference is $165.23, and the near-term support is $150.98.
Overall Assessment
Regarding key support, $150.98 corresponds to the Fibonacci 61.8% retracement. The stock has recently broken effectively above this pressure level, and that area has now turned into support. If the level is lost, then $145.14 (the September 8 intraday low with a lower shadow) forms a near-term bottom reference. If the price continues to fall, you can watch the EMA60 ($141.65) and the MA50 ($135.99) as two medium-term strong support levels.
On the resistance side, focus first on the intraday high of $155.00 on September 8. On the medium-term directional front, the Fibonacci 50.0% retracement level at $165.23 is the more distant, key medium-term resistance. If near-term momentum continues, it can be referenced as a medium-term target direction.
$SPCX
SpaceX is currently maintaining a short-term uptrend, with a strong breakout from the prior consolidation range, and the structure is intact. Of note, the EMA60 has crossed above the EMA20, and short- to mid-term momentum remains biased bullish.
Key Technical Indicator Interpretations
EMA moving averages: EMA5 is $148.07, EMA10 is $144.87, EMA20 is $140.99. The EMA60 breaking above the EMA20 is an upgrade signal for the medium-term structural trend; the moving-average structure is healthy.
RSI: 62.58, sitting in a neutral-to-strong range. Over the past 10 days, the RSI has risen in step with the stock price; no top divergence is evident, and momentum is still present.
MACD: The MACD line (4.01) > the Signal line (2.58). The histogram is positive and continues to expand. The golden cross is maintained. With the indicator located above the zero axis, bullish momentum continues to strengthen, with no divergence observed.
Bollinger Bands: The bands are in an expansion phase. The latest closing price of $153.47 has broken above the upper band, indicating a strong trend. However, be cautious of the risk of a mean reversion back toward the middle band that can be triggered when band width expands and then narrows.
Fibonacci: The current price of $153.47 is above the Fibonacci 61.8% level ($150.98) and below the Fibonacci 50.0% level ($165.23). The next upside target reference is $165.23, and the near-term support is $150.98.
Overall Assessment
Regarding key support, $150.98 corresponds to the Fibonacci 61.8% retracement. The stock has recently broken effectively above this pressure level, and that area has now turned into support. If the level is lost, then $145.14 (the September 8 intraday low with a lower shadow) forms a near-term bottom reference. If the price continues to fall, you can watch the EMA60 ($141.65) and the MA50 ($135.99) as two medium-term strong support levels.
On the resistance side, focus first on the intraday high of $155.00 on September 8. On the medium-term directional front, the Fibonacci 50.0% retracement level at $165.23 is the more distant, key medium-term resistance. If near-term momentum continues, it can be referenced as a medium-term target direction.
$SPCX


币圈淘金小旋风
·
--
$ZEC $SOL $BNB Recently, the US stock market has basically been a dead pond—no energy or momentum. Yesterday, all three major indexes closed lower across the board. It looks like a simple pullback at first glance, but what really matters is where the money is going. At the market’s foundation, trading logic is undergoing a major shift.💥
Once oil prices firmly hold above 100, inflation pressure will rise again—giving the Federal Reserve a stronger pretext to keep hiking rates. As long as rate-hike expectations heat up and liquidity tightens, the crypto market will definitely feel the pressure too.💥
Previously, the market was driven forward by AI-related hot themes. Now, funds are taking priority and focusing on macro data like inflation and oil prices. Money is shifting to risk avoidance instead of blindly chasing high-risk assets. For coins like BTC and ETH, it’s therefore hard to sustain a continuous rally. Choppy, back-and-forth price action will become the norm.💥
Fellow retail traders, don’t keep using old ways of trading. Don’t assume you can just go all-in simply because it’s a bull market. Once the macro wind changes, needle-like spikes through the chart will happen more frequently. Keep leverage under control—don’t rush in just because you see a small rebound.💥
Right now, the priority is to stay on the sidelines, watch more and move less. Keep an eye on oil prices and Fed-related news. The market logic has already changed—old experience is more likely to get you into a big pitfall. Preserving capital comes first.💥#原油涨至7月来最高 #灰度ZcashETF资产突破5亿美元 #美国银行集团完成USBDC稳定币试点
Once oil prices firmly hold above 100, inflation pressure will rise again—giving the Federal Reserve a stronger pretext to keep hiking rates. As long as rate-hike expectations heat up and liquidity tightens, the crypto market will definitely feel the pressure too.💥
Previously, the market was driven forward by AI-related hot themes. Now, funds are taking priority and focusing on macro data like inflation and oil prices. Money is shifting to risk avoidance instead of blindly chasing high-risk assets. For coins like BTC and ETH, it’s therefore hard to sustain a continuous rally. Choppy, back-and-forth price action will become the norm.💥
Fellow retail traders, don’t keep using old ways of trading. Don’t assume you can just go all-in simply because it’s a bull market. Once the macro wind changes, needle-like spikes through the chart will happen more frequently. Keep leverage under control—don’t rush in just because you see a small rebound.💥
Right now, the priority is to stay on the sidelines, watch more and move less. Keep an eye on oil prices and Fed-related news. The market logic has already changed—old experience is more likely to get you into a big pitfall. Preserving capital comes first.💥#原油涨至7月来最高 #灰度ZcashETF资产突破5亿美元 #美国银行集团完成USBDC稳定币试点



Arsalan Bhat 01
·
--
🧧 RED PACKET DROP! 🔥
Can you grab it before it’s gone? 👀⚡
GO GO GO! 🧧
Can you grab it before it’s gone? 👀⚡
GO GO GO! 🧧


白鲨观点5
·
--
Fear and Greed Index hits 71 and people shout “top”? Don’t get fooled.
Lately, lots of people have been saying: “It’s getting greedy—so it’s going to drop.” The Fear and Greed Index has reached 71, so “run.”
Let me say one thing: is 71 really “greed”?
Let me show you a few numbers:
2021 bull market peak: 95
October 2025, when BTC touched 126,000: 88
Now: 71 — just at the threshold of “greed.”
What is real greed?
It’s the market aunt asking you what coin to buy.
It’s the taxi driver talking about the candlestick chart.
It’s your mom wanting to get in—
that’s real greed.
What about now?
There are still plenty of people shouting “a bull market rebound” and “pump it to unload.”
The bears are still stubborn, and the bulls are still hesitating.
Price rises amid doubt and ends amid celebration.
If so many people are still in doubt now, it clearly hasn’t ended yet.
Lately, lots of people have been saying: “It’s getting greedy—so it’s going to drop.” The Fear and Greed Index has reached 71, so “run.”
Let me say one thing: is 71 really “greed”?
Let me show you a few numbers:
2021 bull market peak: 95
October 2025, when BTC touched 126,000: 88
Now: 71 — just at the threshold of “greed.”
What is real greed?
It’s the market aunt asking you what coin to buy.
It’s the taxi driver talking about the candlestick chart.
It’s your mom wanting to get in—
that’s real greed.
What about now?
There are still plenty of people shouting “a bull market rebound” and “pump it to unload.”
The bears are still stubborn, and the bulls are still hesitating.
Price rises amid doubt and ends amid celebration.
If so many people are still in doubt now, it clearly hasn’t ended yet.


大嗯BNB
·
--
BTC is hovering around 79,000 to 80,000, and everyone is watching what will happen when CPI comes out tomorrow.
But today I’d rather talk about a piece of data most people ignore: over the past 7 days, futures buyers have net entered with $81.5 million, while spot buyers are net selling $8.2 million.
Futures are buying, spot is selling—this is a signal, not a direction.
When futures drive the price higher but spot fails to follow, it usually means several things are true at the same time: first, this upswing is being built with leverage—not real buy-side demand; second, spot holders are using the price rise to distribute, not add to positions; third, the market’s “elasticity” is getting more brittle—the more leverage there is, the faster liquidation accelerates once the direction reverses.
CoinMarketCap’s research director Alice Liu said: “The market is carrying a lot of leverage, but it hasn’t paid a high price yet.”
The numbers from the prediction market are quite straightforward: there’s an 86% probability that BTC will touch 78,000 before September 13, and a 68% probability it will touch 80,000 at the same time—this combination suggests the market expects a path of first dipping to 78,000, then seeing whether it can get back to 80,000, rather than moving in a straight line upward.
$76,757 is structural support, and $80,571 is the decision resistance—BTC is currently trapped between these two price levels. PPI comes out today, CPI tomorrow, the CLARITY Act the day after tomorrow, and FOMC the day after that—four catalysts in four consecutive days, and each one can pry open a crack in the structure built by leverage.
What I’m most worried about isn’t that any single data point comes in above expectations—it’s that two of the four data points turn negative at the same time. In that scenario, the $81.5 million net long exposure in futures could turn into sell orders forced by liquidation in a very short time, affecting price more directly than any fundamental analysis.
Leverage isn’t a bad thing—it reflects market confidence. But before these four data releases come out, leverage is sitting there while spot is distributing—together, this makes me feel that the relatively cheaper move right now is to adjust your position to a state where you don’t need to stare at the candlestick chart every four hours.
Has anyone in the square felt the contradiction of “futures-driven but spot doesn’t acknowledge it”? Share how you’re responding.
$BTC #BTC
But today I’d rather talk about a piece of data most people ignore: over the past 7 days, futures buyers have net entered with $81.5 million, while spot buyers are net selling $8.2 million.
Futures are buying, spot is selling—this is a signal, not a direction.
When futures drive the price higher but spot fails to follow, it usually means several things are true at the same time: first, this upswing is being built with leverage—not real buy-side demand; second, spot holders are using the price rise to distribute, not add to positions; third, the market’s “elasticity” is getting more brittle—the more leverage there is, the faster liquidation accelerates once the direction reverses.
CoinMarketCap’s research director Alice Liu said: “The market is carrying a lot of leverage, but it hasn’t paid a high price yet.”
The numbers from the prediction market are quite straightforward: there’s an 86% probability that BTC will touch 78,000 before September 13, and a 68% probability it will touch 80,000 at the same time—this combination suggests the market expects a path of first dipping to 78,000, then seeing whether it can get back to 80,000, rather than moving in a straight line upward.
$76,757 is structural support, and $80,571 is the decision resistance—BTC is currently trapped between these two price levels. PPI comes out today, CPI tomorrow, the CLARITY Act the day after tomorrow, and FOMC the day after that—four catalysts in four consecutive days, and each one can pry open a crack in the structure built by leverage.
What I’m most worried about isn’t that any single data point comes in above expectations—it’s that two of the four data points turn negative at the same time. In that scenario, the $81.5 million net long exposure in futures could turn into sell orders forced by liquidation in a very short time, affecting price more directly than any fundamental analysis.
Leverage isn’t a bad thing—it reflects market confidence. But before these four data releases come out, leverage is sitting there while spot is distributing—together, this makes me feel that the relatively cheaper move right now is to adjust your position to a state where you don’t need to stare at the candlestick chart every four hours.
Has anyone in the square felt the contradiction of “futures-driven but spot doesn’t acknowledge it”? Share how you’re responding.
$BTC #BTC

Log in to explore more content