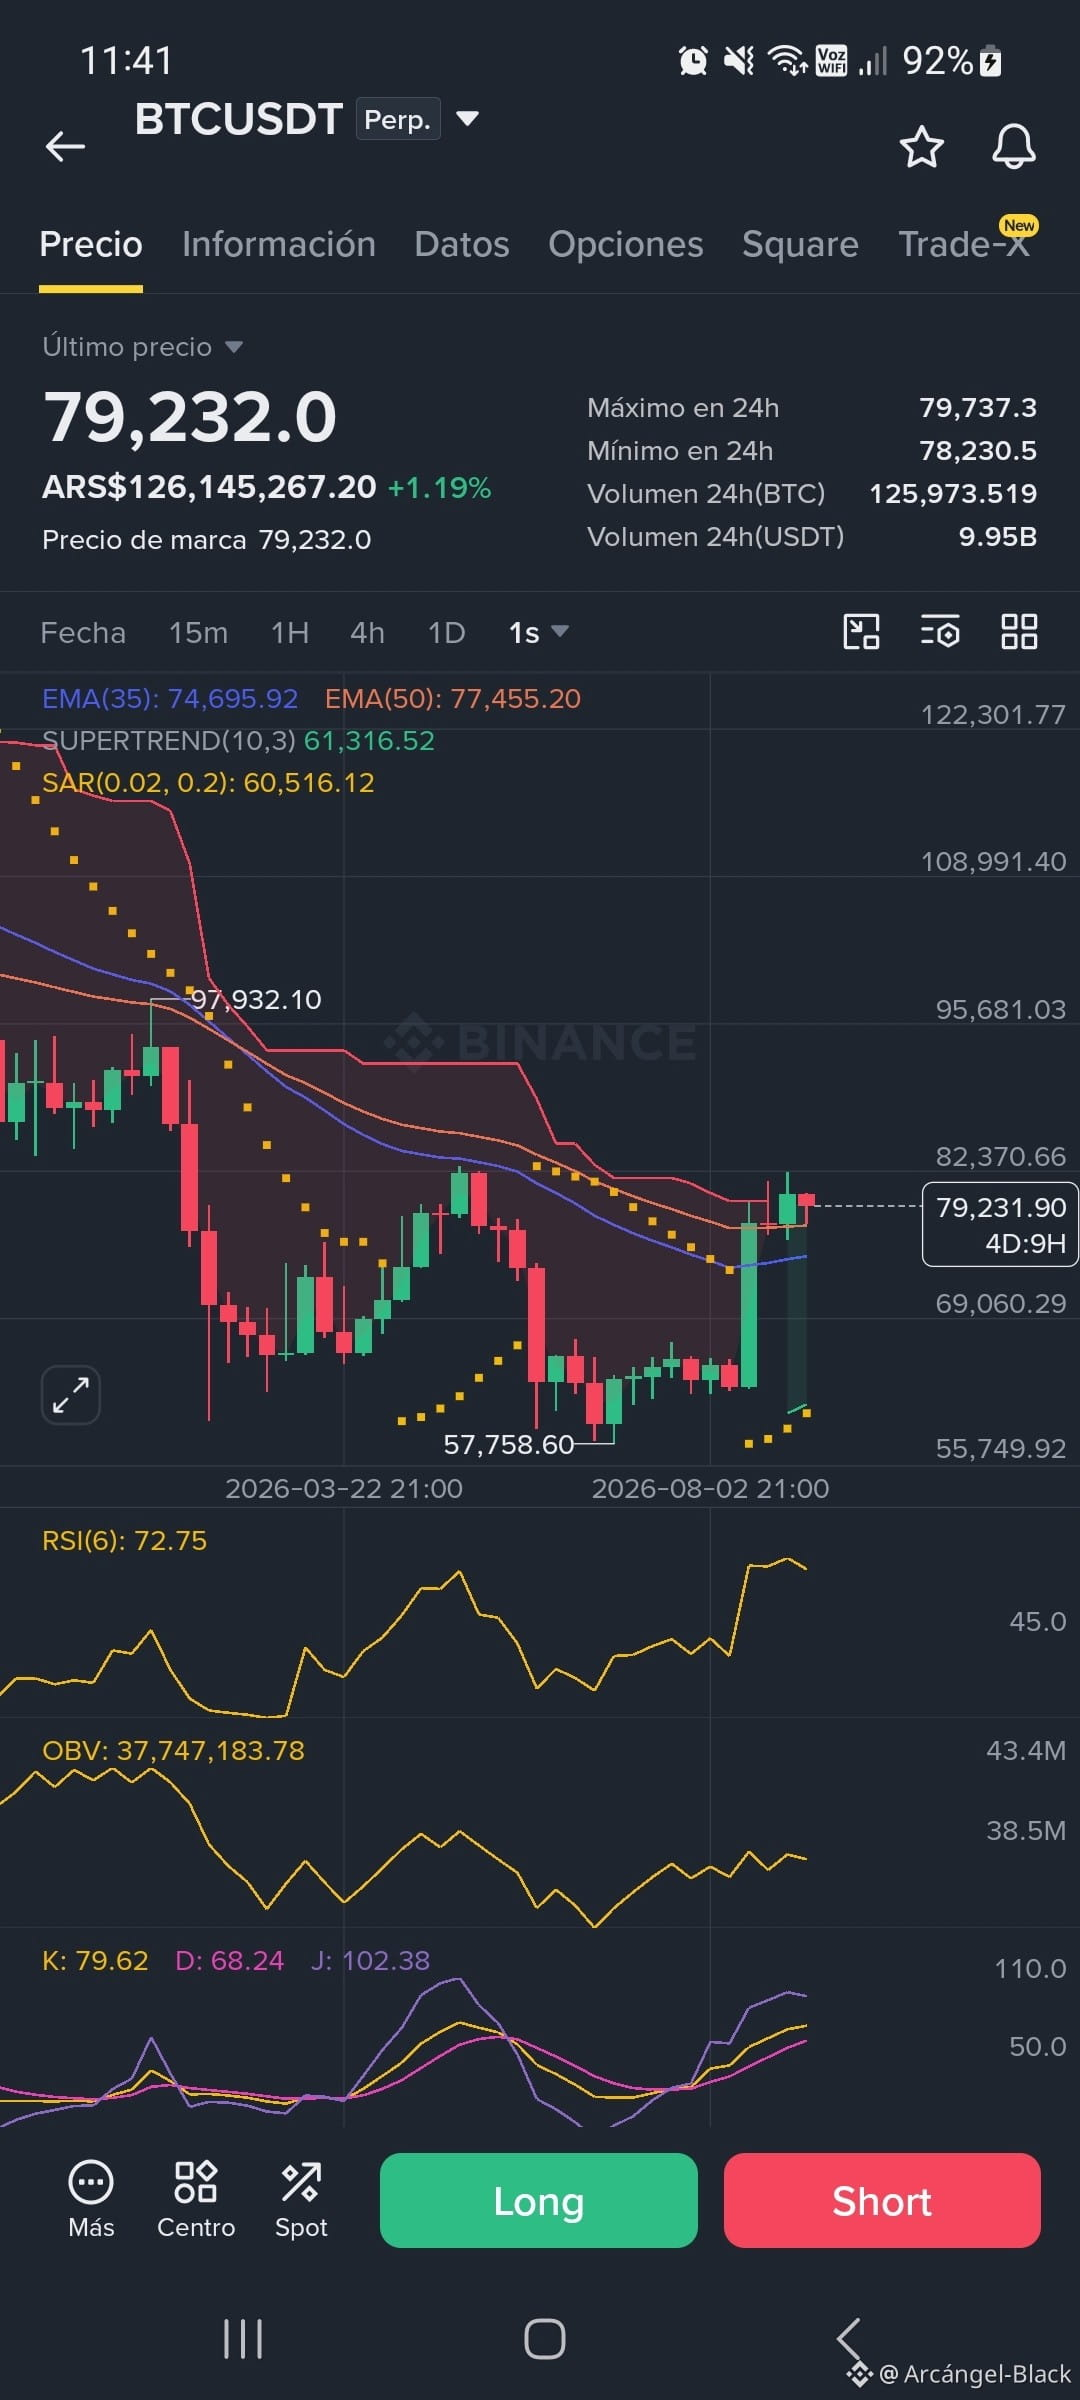
TECHNICAL ANALYSIS OF BTC/USDT
Current price: 79,232.0 USDT
Timeframe: 1 week (1s)
Overall Trend and Trend Indicators
Bitcoin’s price is above the 35-period EMA (74,695.92 USDT) and the 50-period EMA (77,455.20 USDT), indicating a considerable bullish rebound after having touched a low in the 57,758.60 USDT zone.
The Supertrend indicator (10,3) is at 61,316.52 USDT and the Parabolic SAR at 60,516.12 USDT—both below the current price—confirming a bullish recovery structure on the macro timeframe.
Oscillators and Momentum Indicators
RSI (6): At 72.75, entering the overbought zone. This indicates strength in buying pressure, although it warns about the possibility of a slowdown or consolidation in the short term.
Stochastic (KDJ): The K line is at 79.62, D at 68.24, and J at 102.38. Shows a clear bullish alignment with strong upward momentum.
OBV (On-Balance Volume): Displays a steady upward curve at 37,747,183.78, validating the price move supported by incoming buying volume.
Key Levels
Immediate resistance: 82,370.00 USDT - 82,500.00 USDT (local highs zone prior to the larger correction).
Immediate support: 77,455.00 USDT (aligned with the 50 EMA).
Secondary support: 74,695.00 USDT (aligned with the 35 EMA).
Outlook
The weekly chart structure reflects a strong shift in momentum to the upside. To keep the move going, I would look for consolidation around the 79,000 USDT area to then challenge the 82,370 USDT resistance. If a correction occurs due to overbought conditions in oscillators like the RSI, the main supports to watch for potential entries are in the 77,400 to 74,700 USDT range.
Current price: 79,232.0 USDT
Timeframe: 1 week (1s)
Overall Trend and Trend Indicators
Bitcoin’s price is above the 35-period EMA (74,695.92 USDT) and the 50-period EMA (77,455.20 USDT), indicating a considerable bullish rebound after having touched a low in the 57,758.60 USDT zone.
The Supertrend indicator (10,3) is at 61,316.52 USDT and the Parabolic SAR at 60,516.12 USDT—both below the current price—confirming a bullish recovery structure on the macro timeframe.
Oscillators and Momentum Indicators
RSI (6): At 72.75, entering the overbought zone. This indicates strength in buying pressure, although it warns about the possibility of a slowdown or consolidation in the short term.
Stochastic (KDJ): The K line is at 79.62, D at 68.24, and J at 102.38. Shows a clear bullish alignment with strong upward momentum.
OBV (On-Balance Volume): Displays a steady upward curve at 37,747,183.78, validating the price move supported by incoming buying volume.
Key Levels
Immediate resistance: 82,370.00 USDT - 82,500.00 USDT (local highs zone prior to the larger correction).
Immediate support: 77,455.00 USDT (aligned with the 50 EMA).
Secondary support: 74,695.00 USDT (aligned with the 35 EMA).
Outlook
The weekly chart structure reflects a strong shift in momentum to the upside. To keep the move going, I would look for consolidation around the 79,000 USDT area to then challenge the 82,370 USDT resistance. If a correction occurs due to overbought conditions in oscillators like the RSI, the main supports to watch for potential entries are in the 77,400 to 74,700 USDT range.