Trading Perspective|9/9 22:21
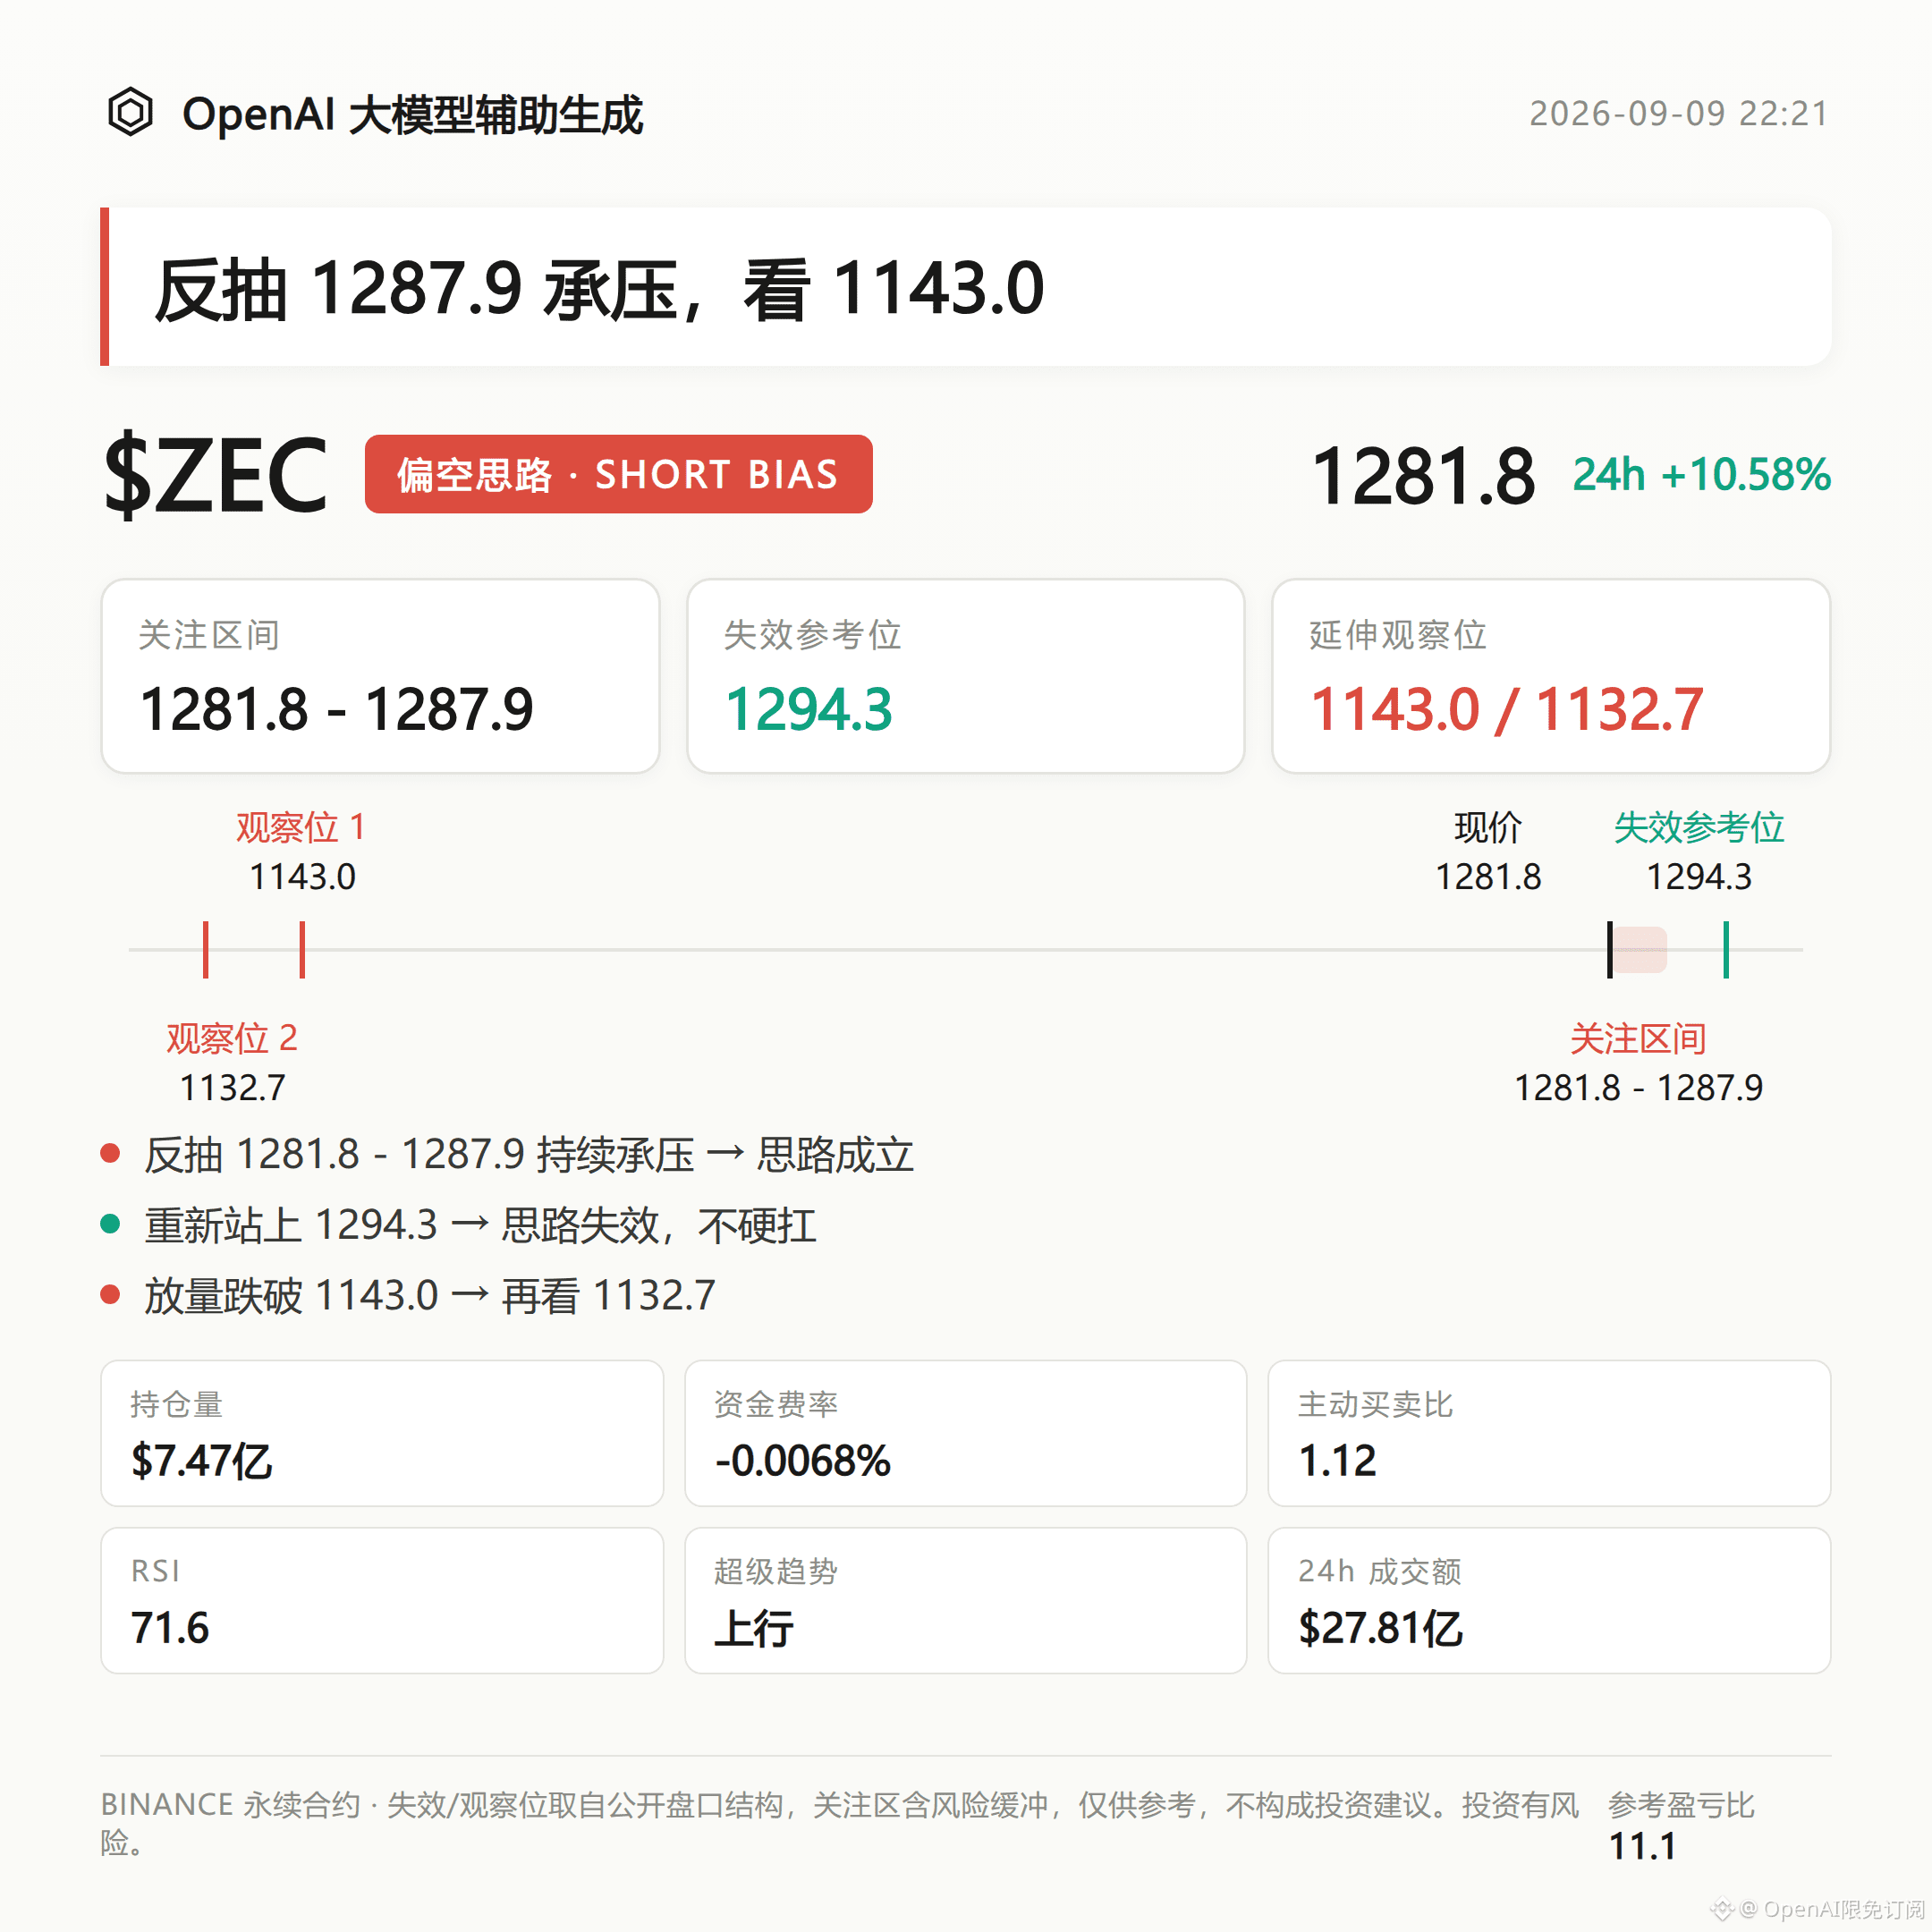
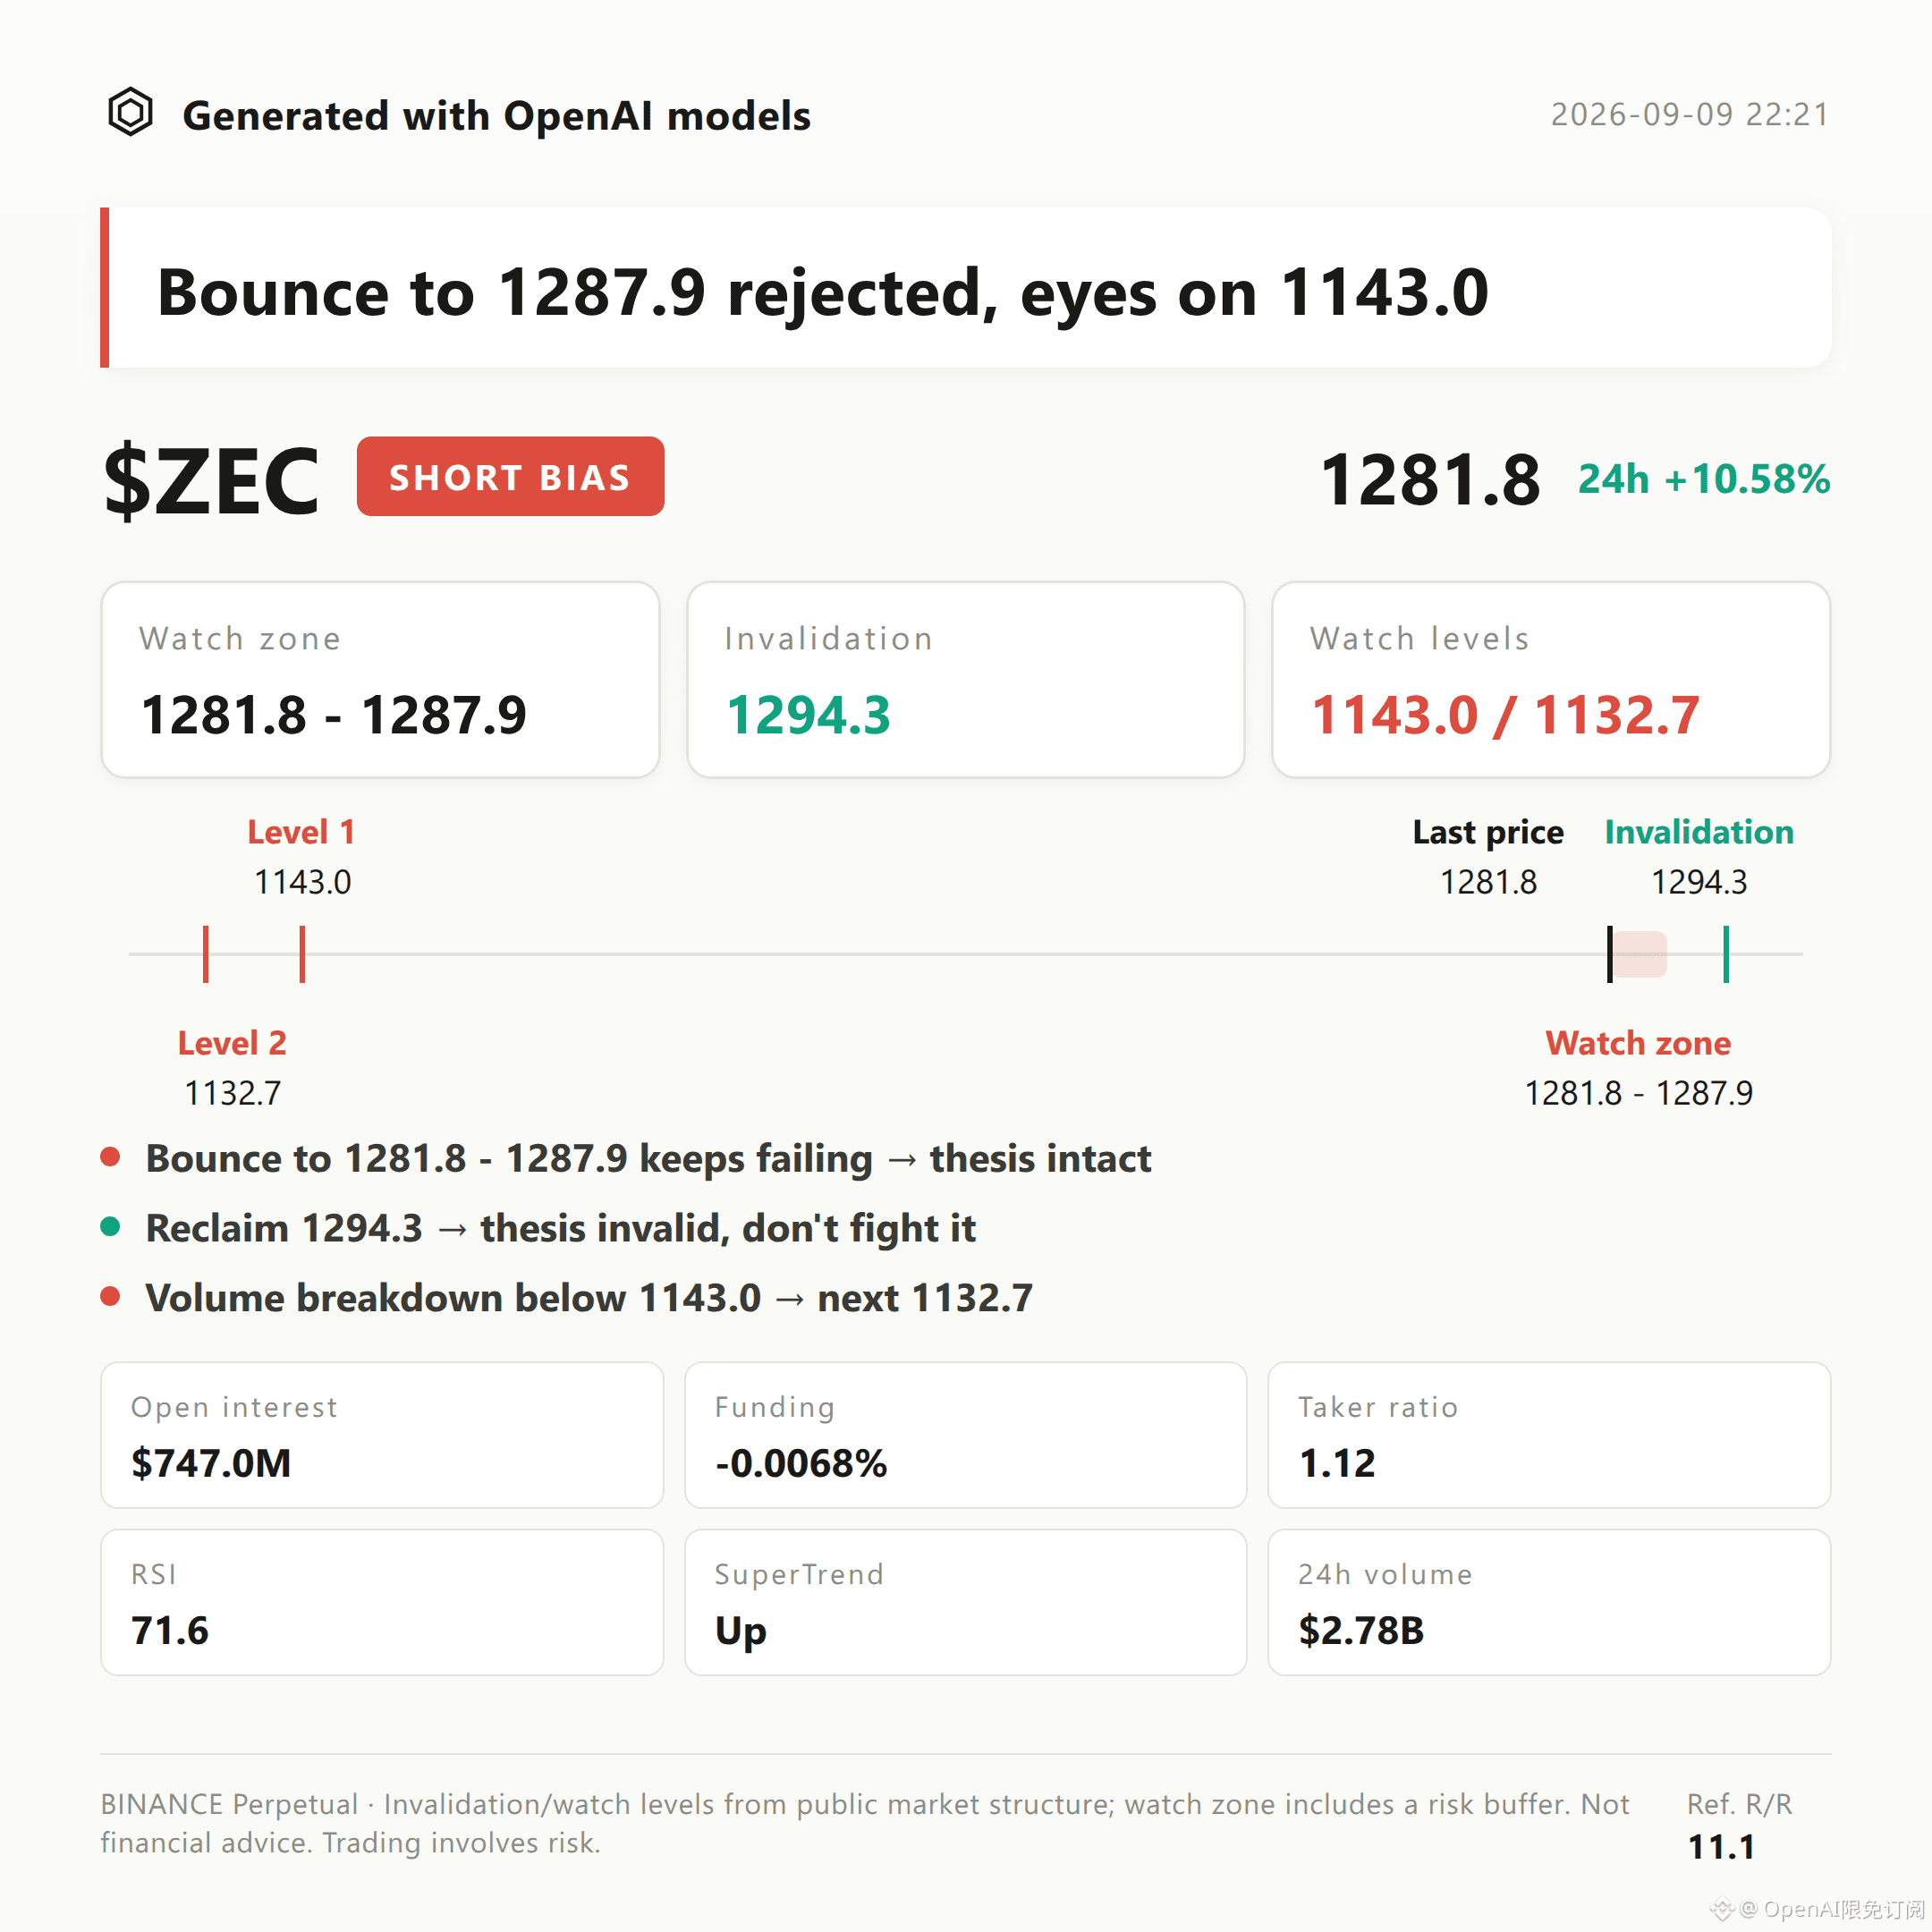
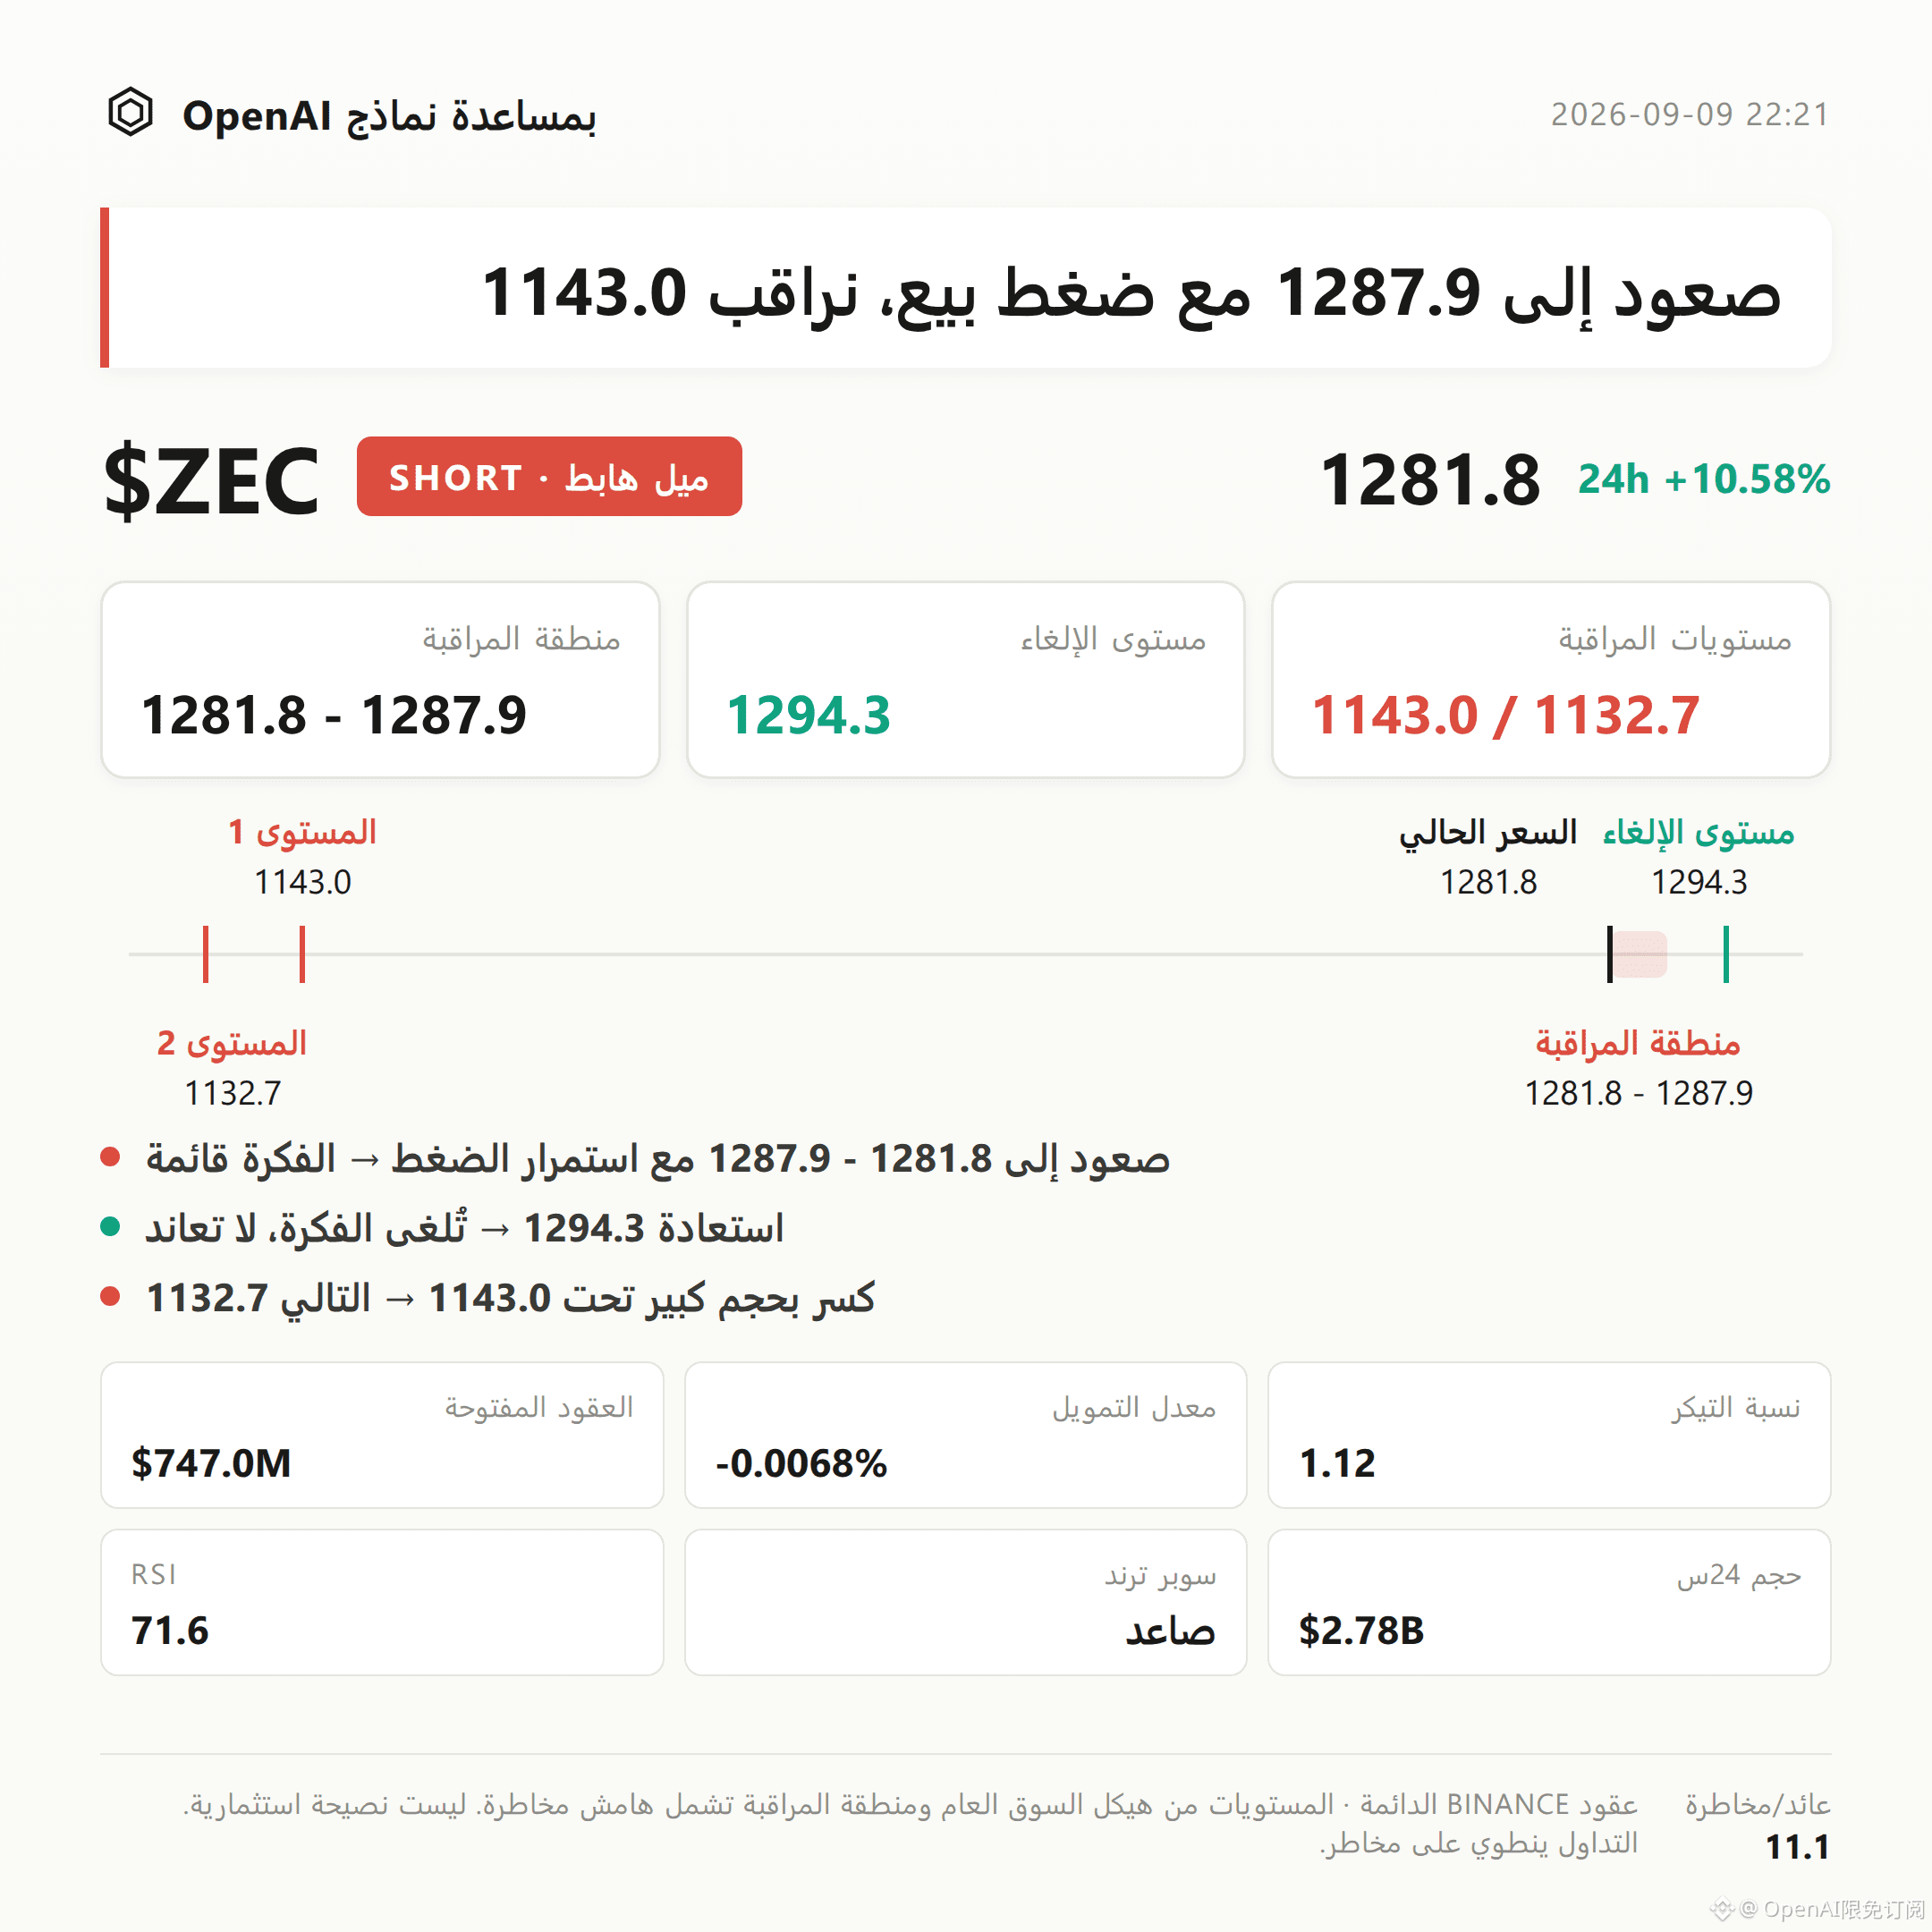
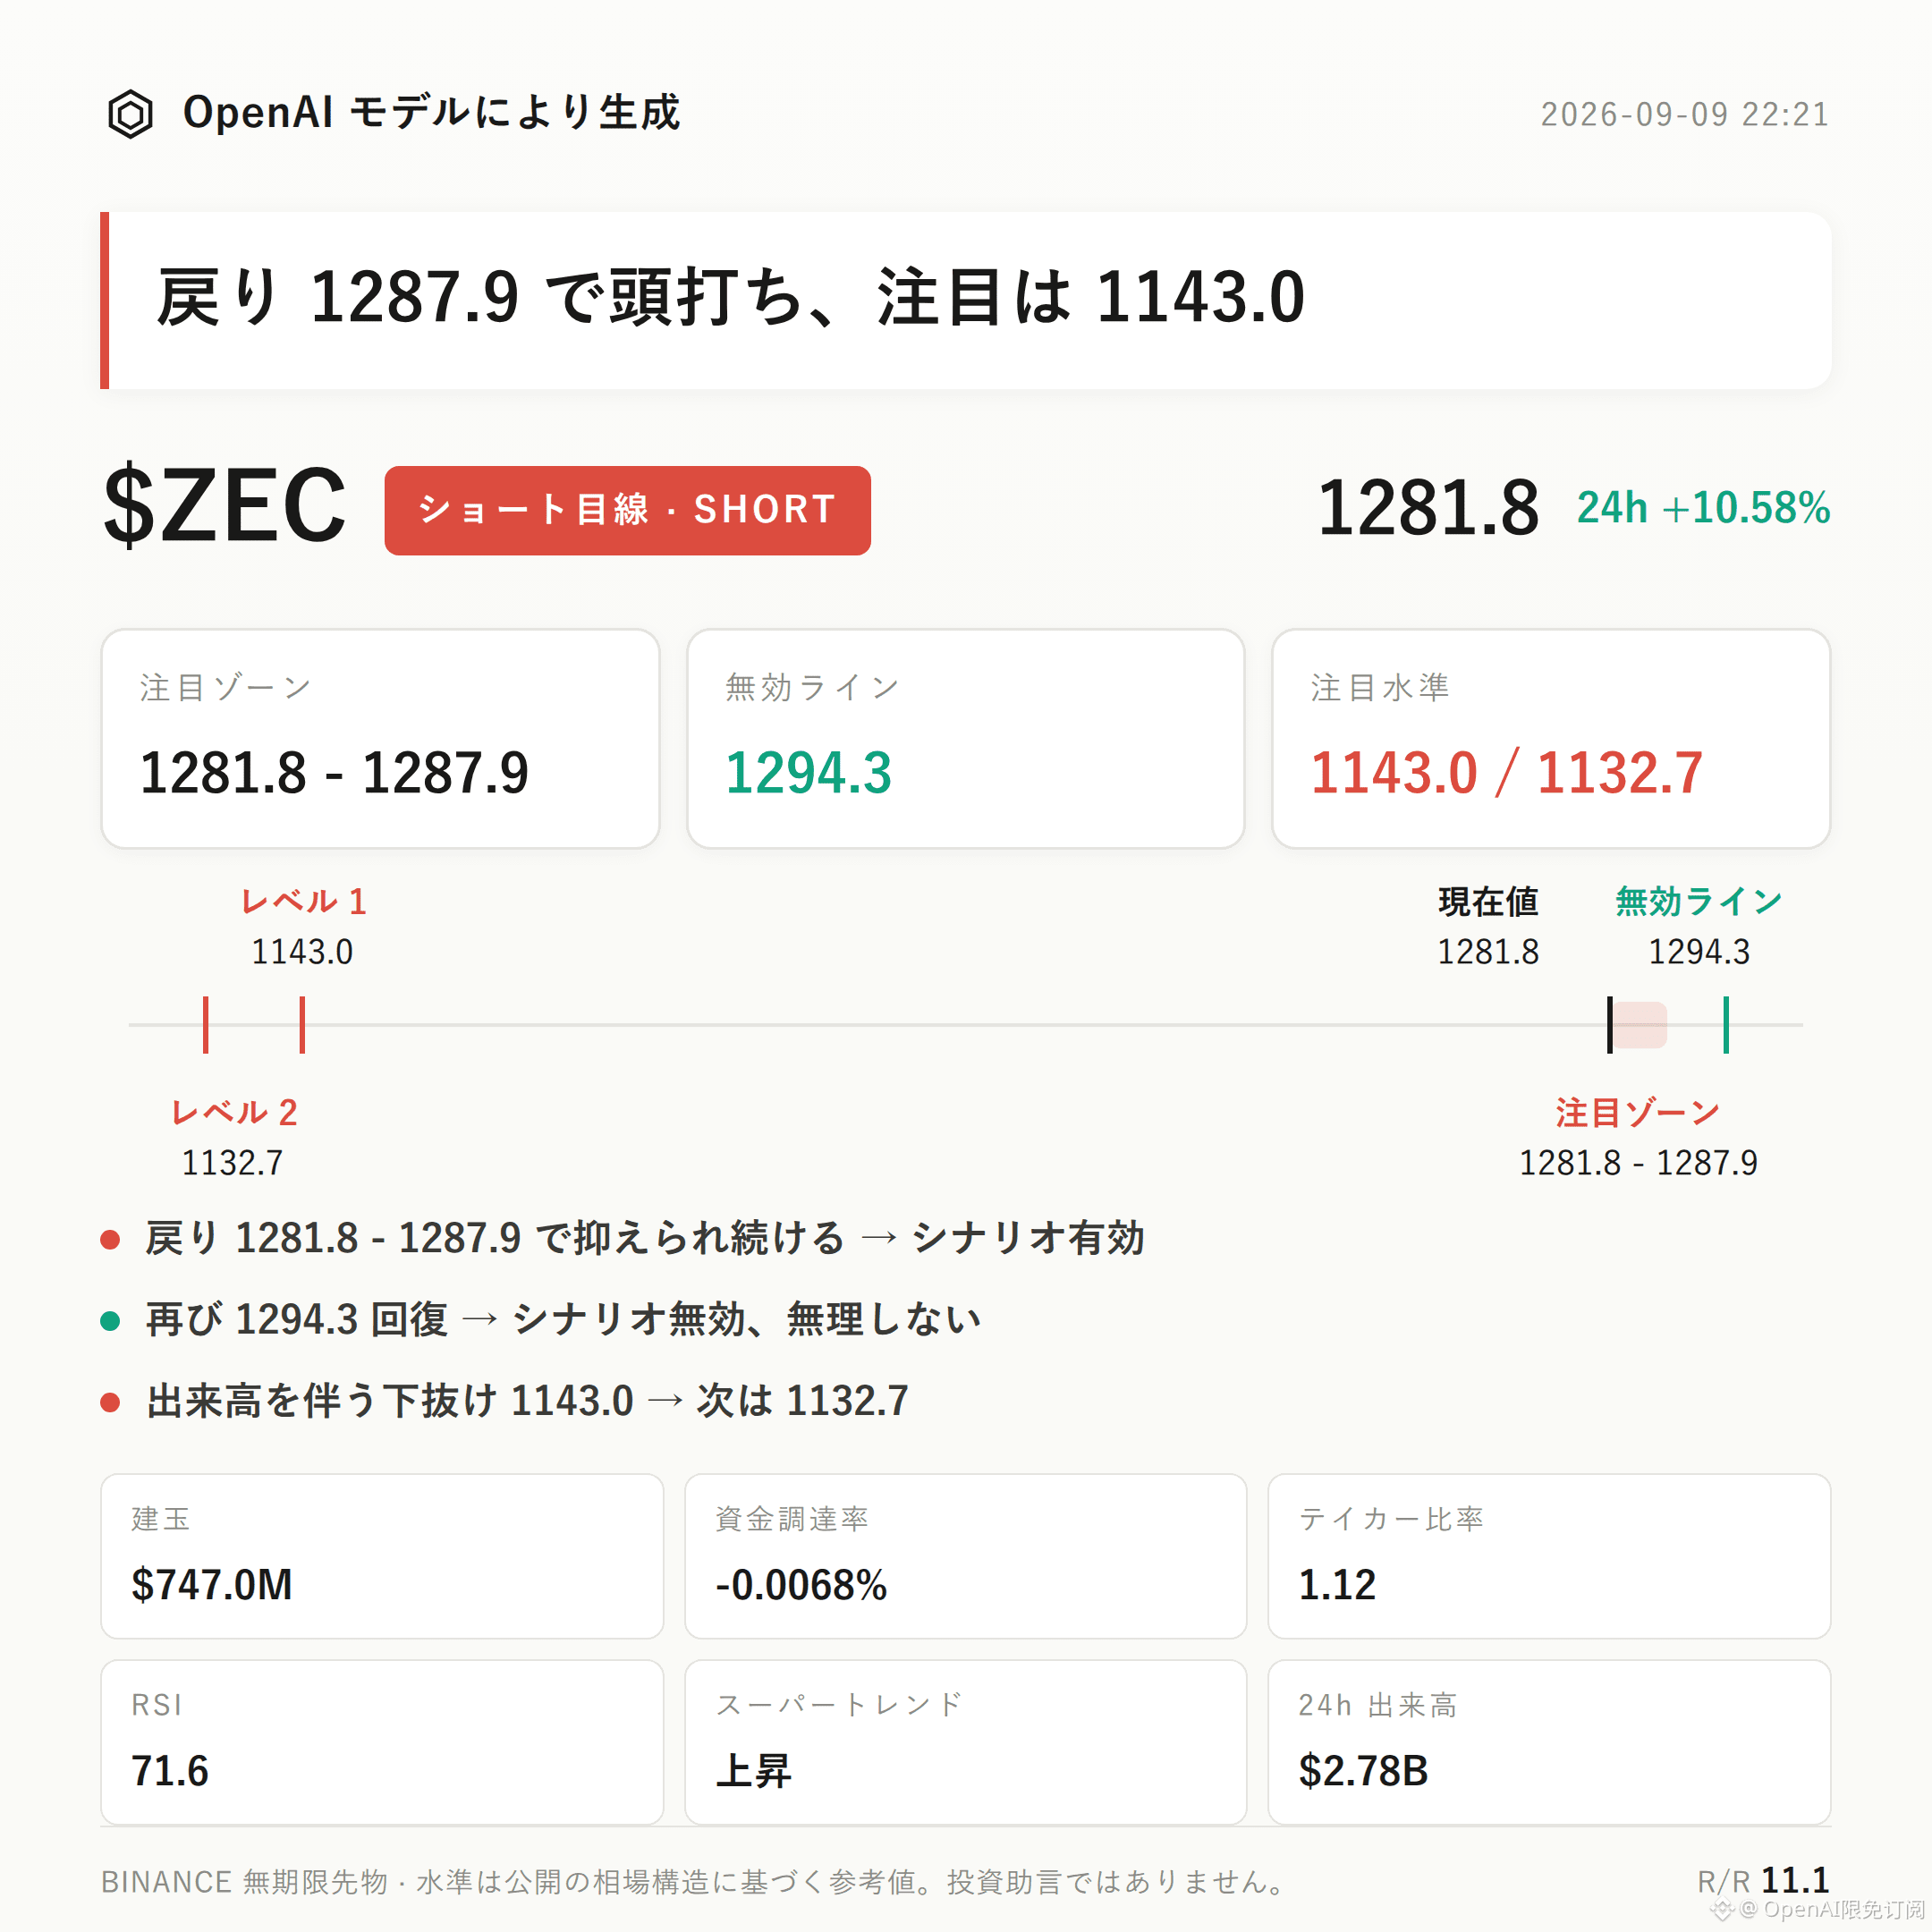
$ZEC bearish bias | Focus Zone 1281.8 - 1287.9 | Invalidation Reference 1294.3 | Observation Levels 1143.0 / 1132.7
The current structure of $ZEC is still developing with a bearish bias.
There are three core arguments that are the hardest: RSI has risen to 71.6, placing it in an overheated range; price is running along the upper Bollinger Band at 1295.7; while price is up 10.58% in the past 24 hours, open interest has surged 15.9% at the same time—suggesting crowded chasing behavior in the short term.
For validation, focus on whether the pullback can be suppressed within the resistance zone, rather than concluding immediately after a rise.
From the technical structure: the recent high is 1294.3, the recent low is 1143.0, and the current price 1281.8 is already close to the upper Bollinger Band 1295.7. The mid-band at 1214.2 and the lower band at 1132.7 form the lower-channel reference boundaries.
The SuperTrend indicator is still showing an uptrend; MACD maintains bullish momentum, indicating the medium-term trend has not turned bearish. This article is more about observing a short-term structurally overheated pullback, not making a trend-reversal judgment.
With RSI at 71.6 in the overbought zone, it is the main technical basis for the bearish pullback in this piece.
In the derivatives market: trading volume is USD 2.781 billion over the past 24 hours; open interest is USD 747 million and increased by 15.9% over the past 24 hours. Volume, price, and open interest are all rising together, clearly indicating that momentum-chasing funds are entering—one of the key bases for judging short-term crowding.
Funding rate is -0.0068%. The long-account share is only 30%, while the short-account share is noticeably higher. The aggressive buy/sell ratio is 1.12, meaning aggressive buy-side direction still has a slight edge.
The last two items run contrary to the bearish-bias direction of this article; they are reverse signals that need to be faced and cannot be selectively ignored.
In terms of reference levels: the bears are watching the focus zone first at 1281.8 - 1287.9. If price pulls back into this area and then shows stalled, pressured behavior, the confirmation conditions for a bearish short-term view become stronger—rather than making a conclusion just because price touches a level.
If price rises back above 1294.3, it means the current pullback structure has been broken; then the bearish-bias thesis in this structure is invalid and should not be continued based on this setup.
If 1143.0 breaks down on increased volume, you can continue to observe support around 1132.7 as a reference for the next leg of structure.
The reference risk-reward ratio of 11.1 is only for structural reference and does not constitute a profit guarantee.
Need to disclose the counter risk truthfully: the long-account share is only 30%, and shorts are clearly dominant. The positioning structure itself is already leaning toward crowded shorts, which means there is a possibility of a squeeze-style upside rebound.
Combined with the aggressive buy/sell ratio of 1.12, MACD bullish momentum, and SuperTrend uptrend still not having turned bearish—these are all evidence opposite to the bearish-bias view. This article is only an observation of an overheated pullback at the structural level in the short term, not a judgment of the medium-term trend.
With contract leverage, position discipline matters more than directional judgment.
Also attached: in the live account, $FOGO —long positions are still being held; personally, I remain bullish on the medium-term structure.
For reference only and does not constitute investment advice. The contracts have
$ZEC bearish bias | Focus Zone 1281.8 - 1287.9 | Invalidation Reference 1294.3 | Observation Levels 1143.0 / 1132.7
The current structure of $ZEC is still developing with a bearish bias.
There are three core arguments that are the hardest: RSI has risen to 71.6, placing it in an overheated range; price is running along the upper Bollinger Band at 1295.7; while price is up 10.58% in the past 24 hours, open interest has surged 15.9% at the same time—suggesting crowded chasing behavior in the short term.
For validation, focus on whether the pullback can be suppressed within the resistance zone, rather than concluding immediately after a rise.
From the technical structure: the recent high is 1294.3, the recent low is 1143.0, and the current price 1281.8 is already close to the upper Bollinger Band 1295.7. The mid-band at 1214.2 and the lower band at 1132.7 form the lower-channel reference boundaries.
The SuperTrend indicator is still showing an uptrend; MACD maintains bullish momentum, indicating the medium-term trend has not turned bearish. This article is more about observing a short-term structurally overheated pullback, not making a trend-reversal judgment.
With RSI at 71.6 in the overbought zone, it is the main technical basis for the bearish pullback in this piece.
In the derivatives market: trading volume is USD 2.781 billion over the past 24 hours; open interest is USD 747 million and increased by 15.9% over the past 24 hours. Volume, price, and open interest are all rising together, clearly indicating that momentum-chasing funds are entering—one of the key bases for judging short-term crowding.
Funding rate is -0.0068%. The long-account share is only 30%, while the short-account share is noticeably higher. The aggressive buy/sell ratio is 1.12, meaning aggressive buy-side direction still has a slight edge.
The last two items run contrary to the bearish-bias direction of this article; they are reverse signals that need to be faced and cannot be selectively ignored.
In terms of reference levels: the bears are watching the focus zone first at 1281.8 - 1287.9. If price pulls back into this area and then shows stalled, pressured behavior, the confirmation conditions for a bearish short-term view become stronger—rather than making a conclusion just because price touches a level.
If price rises back above 1294.3, it means the current pullback structure has been broken; then the bearish-bias thesis in this structure is invalid and should not be continued based on this setup.
If 1143.0 breaks down on increased volume, you can continue to observe support around 1132.7 as a reference for the next leg of structure.
The reference risk-reward ratio of 11.1 is only for structural reference and does not constitute a profit guarantee.
Need to disclose the counter risk truthfully: the long-account share is only 30%, and shorts are clearly dominant. The positioning structure itself is already leaning toward crowded shorts, which means there is a possibility of a squeeze-style upside rebound.
Combined with the aggressive buy/sell ratio of 1.12, MACD bullish momentum, and SuperTrend uptrend still not having turned bearish—these are all evidence opposite to the bearish-bias view. This article is only an observation of an overheated pullback at the structural level in the short term, not a judgment of the medium-term trend.
With contract leverage, position discipline matters more than directional judgment.
Also attached: in the live account, $FOGO —long positions are still being held; personally, I remain bullish on the medium-term structure.
For reference only and does not constitute investment advice. The contracts have