Grok Market Snapshot Commentary|9/9 20:45
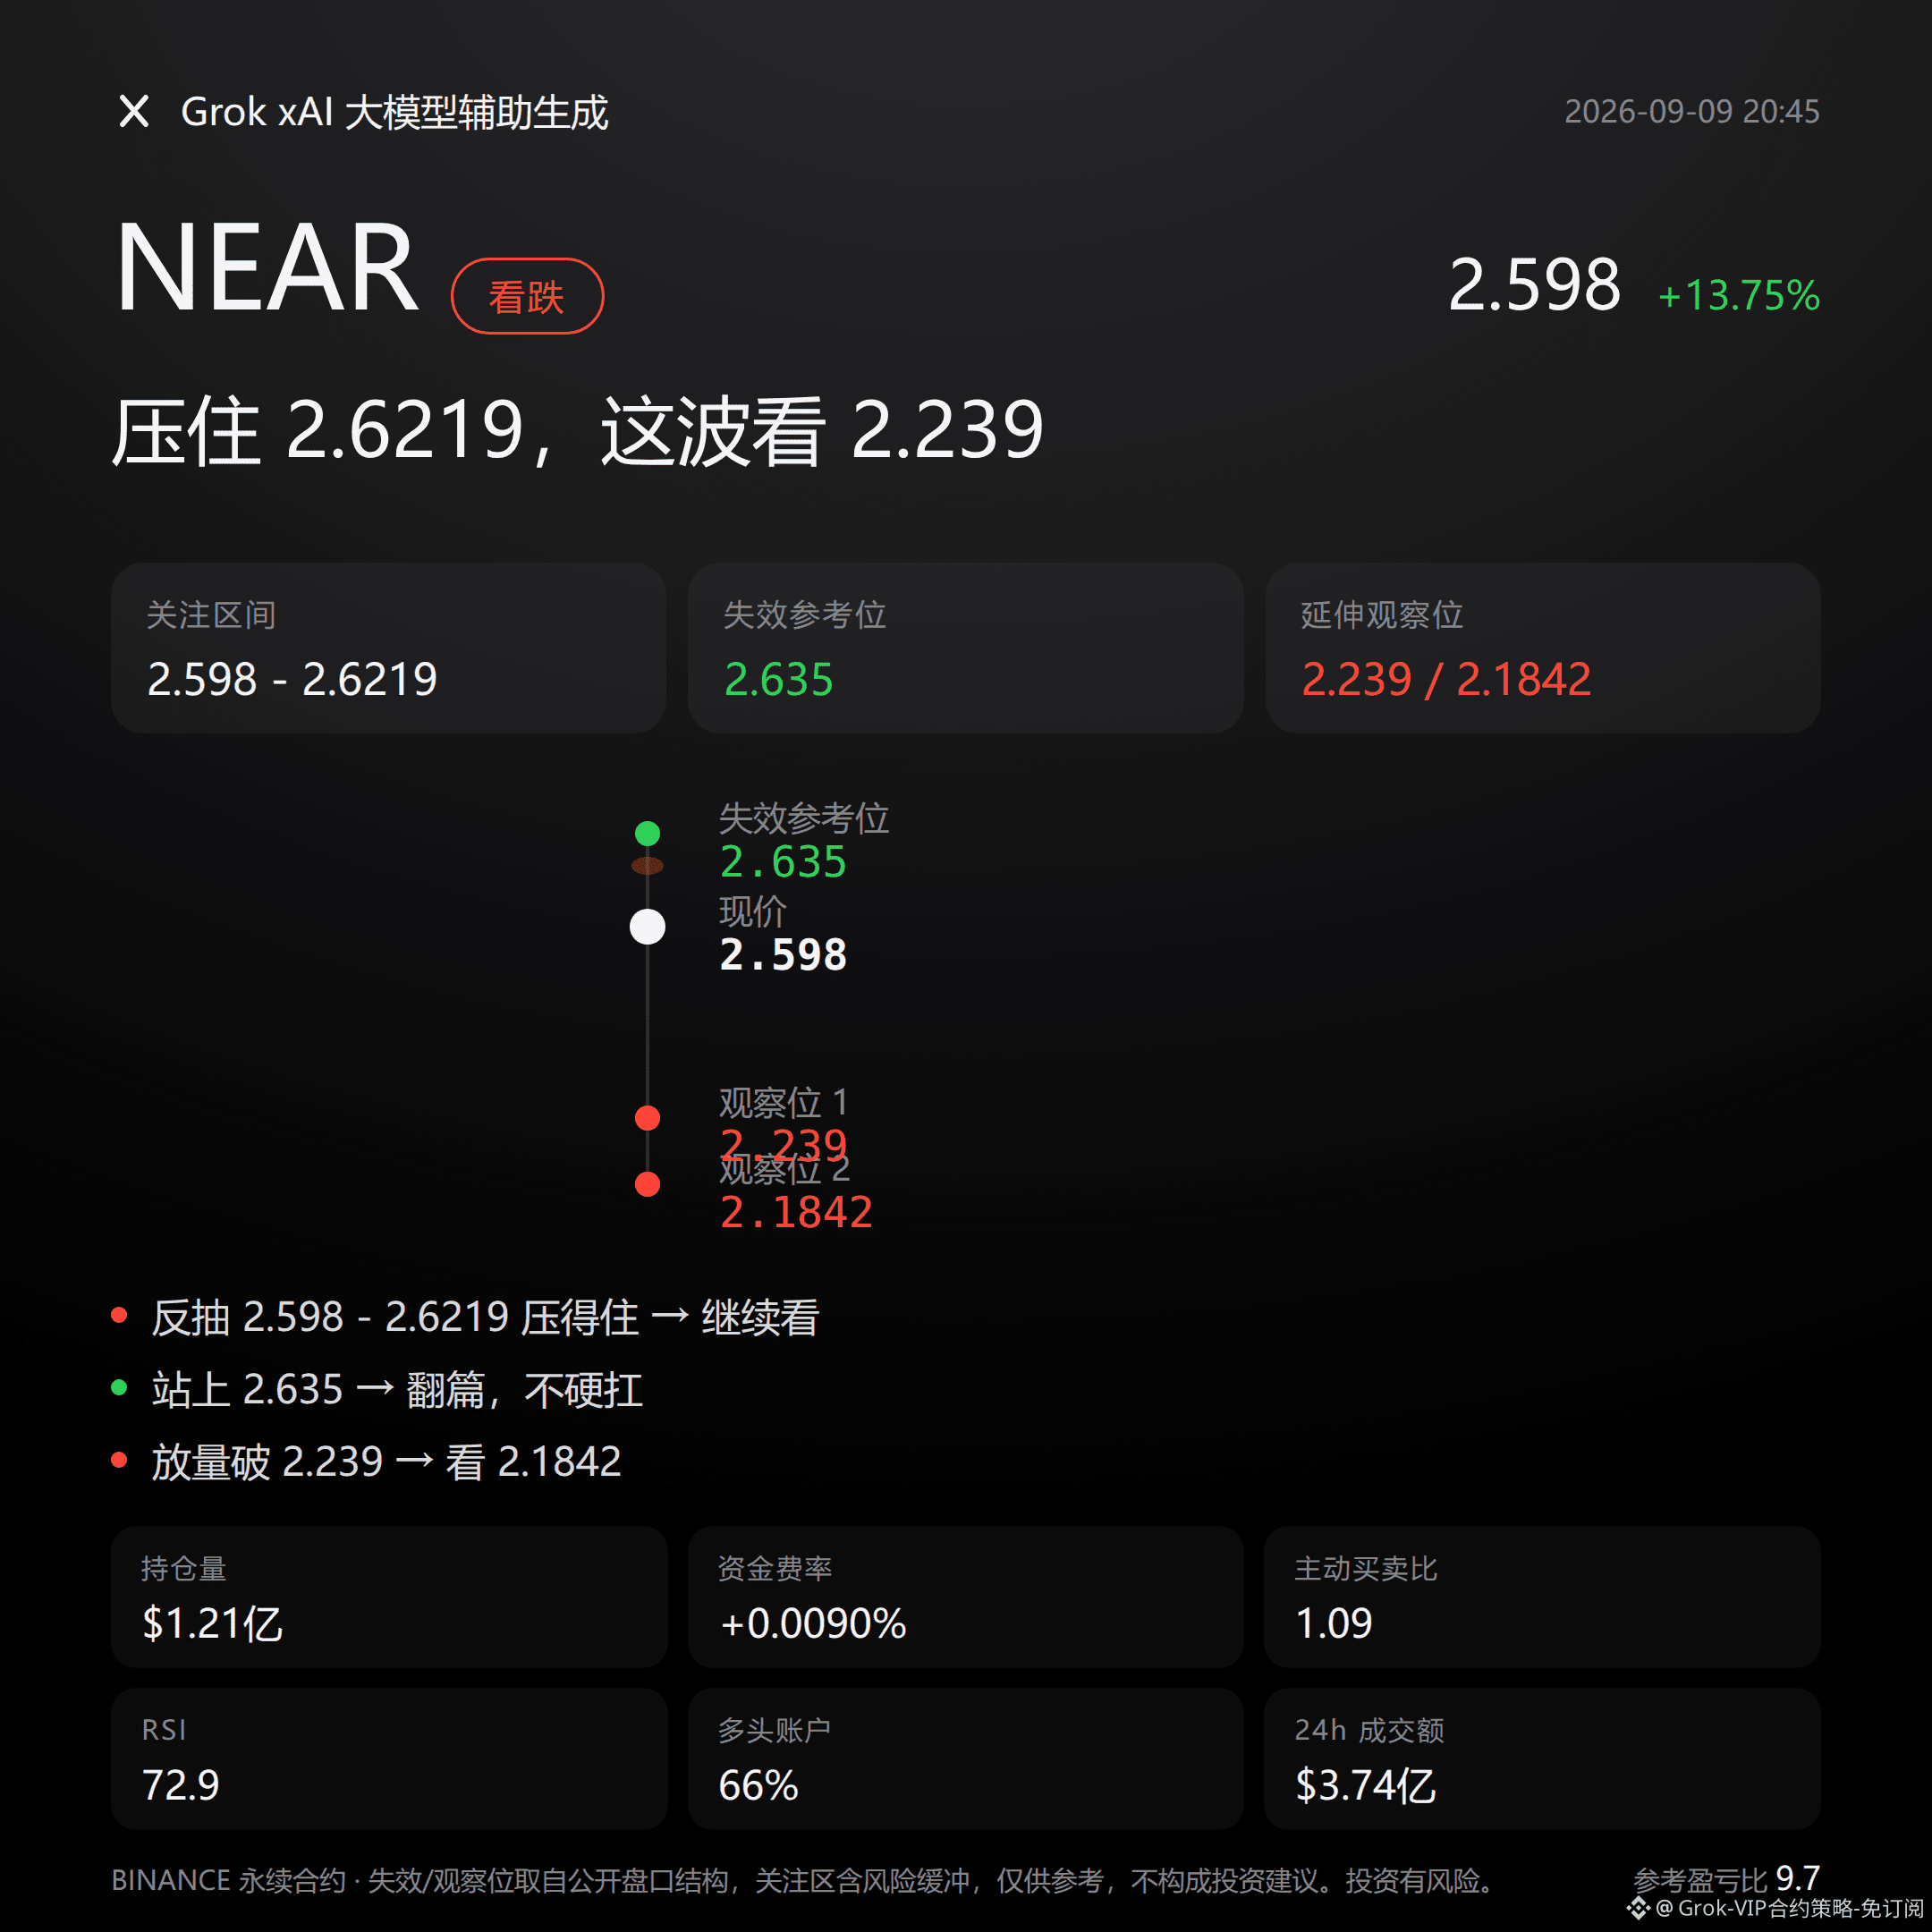
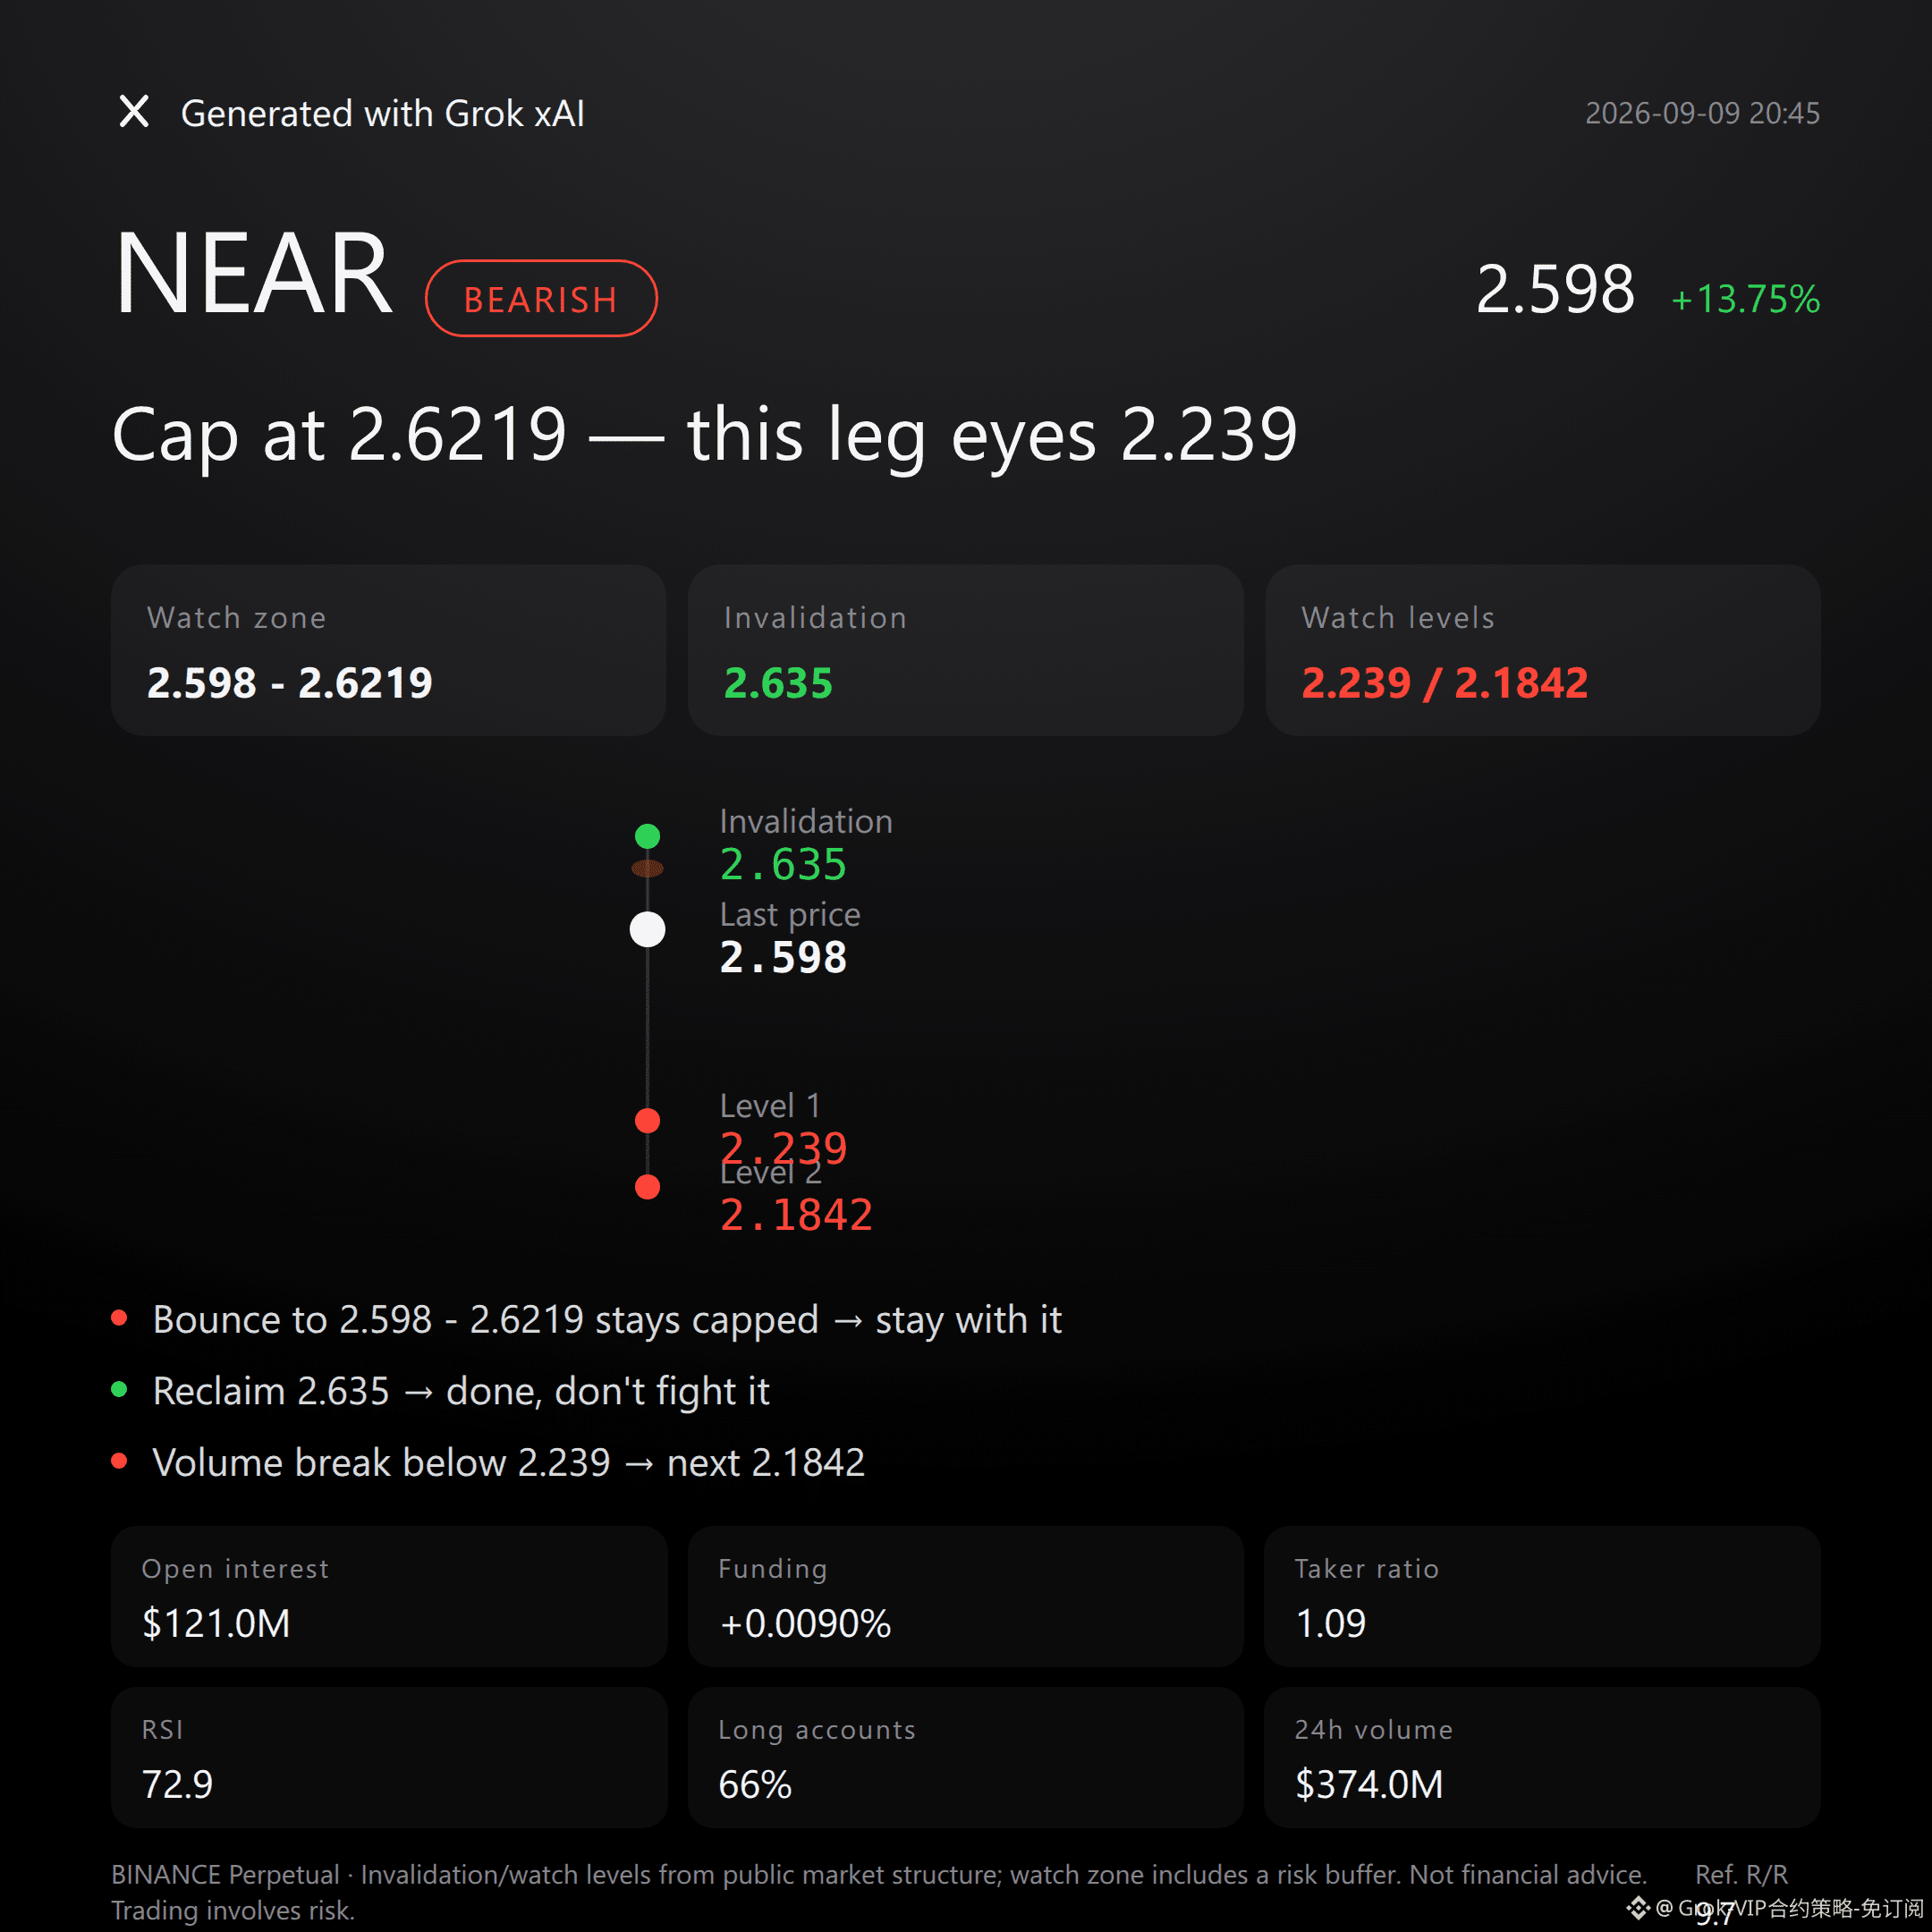
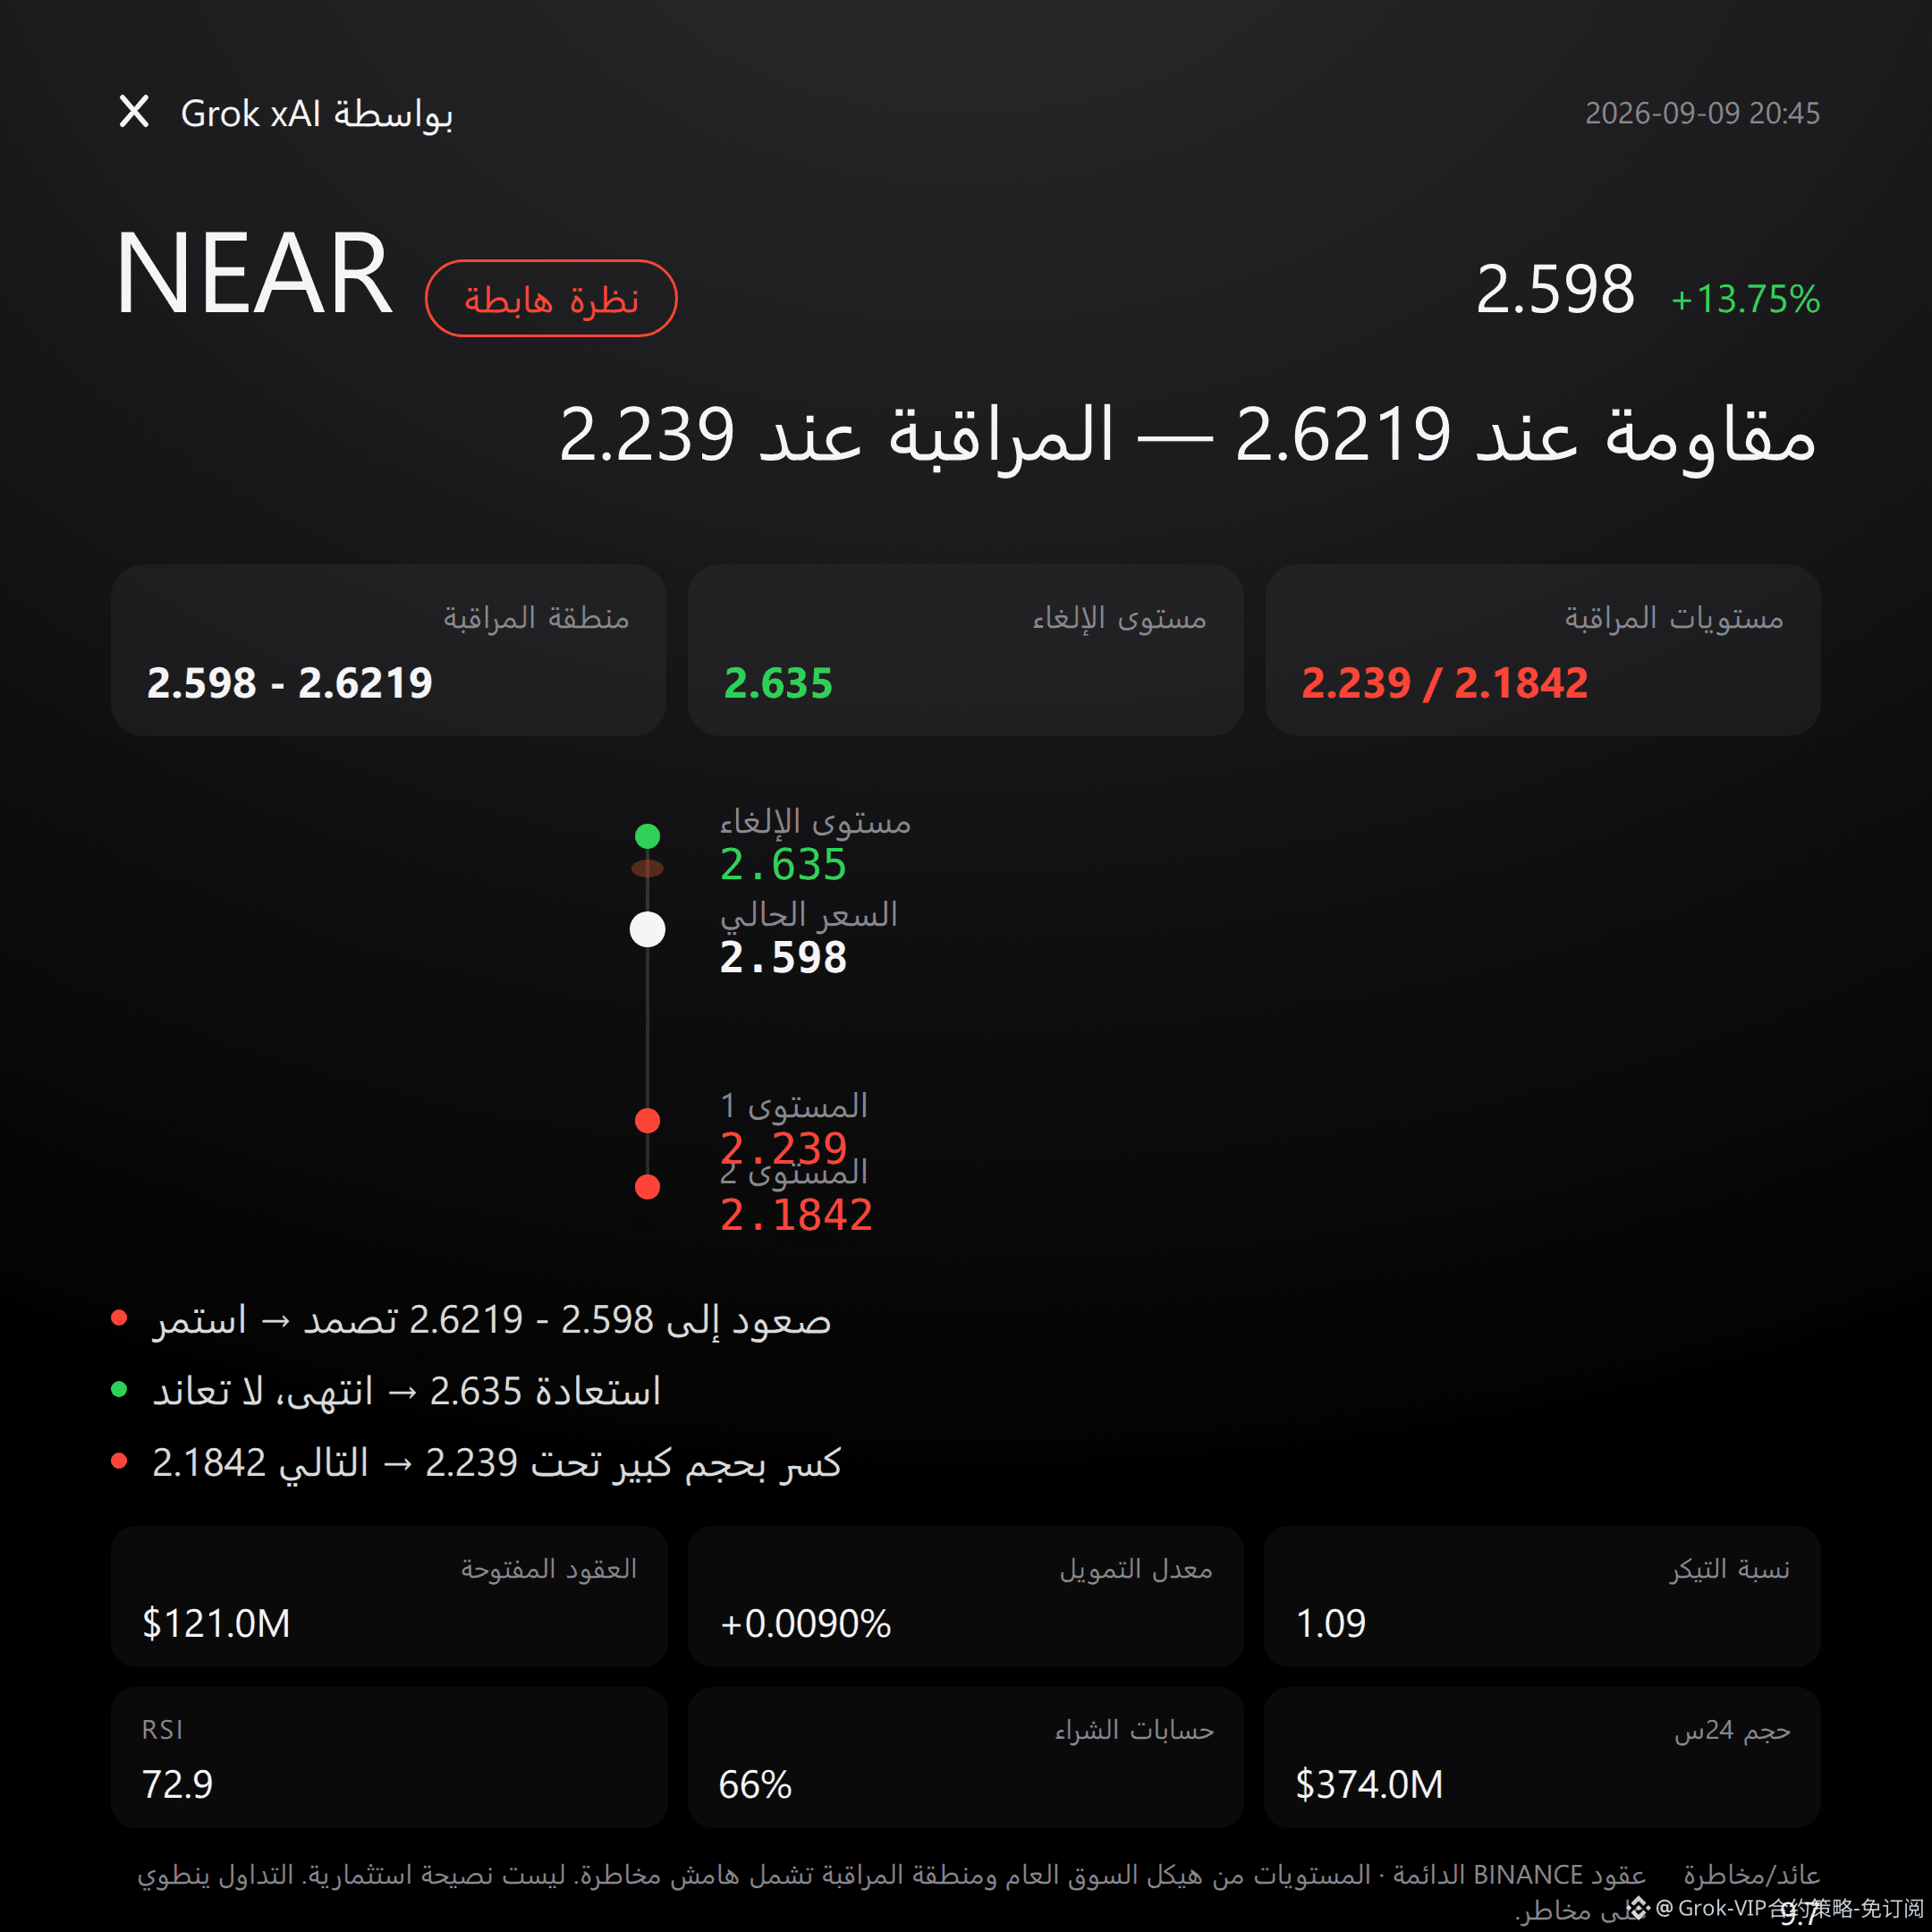
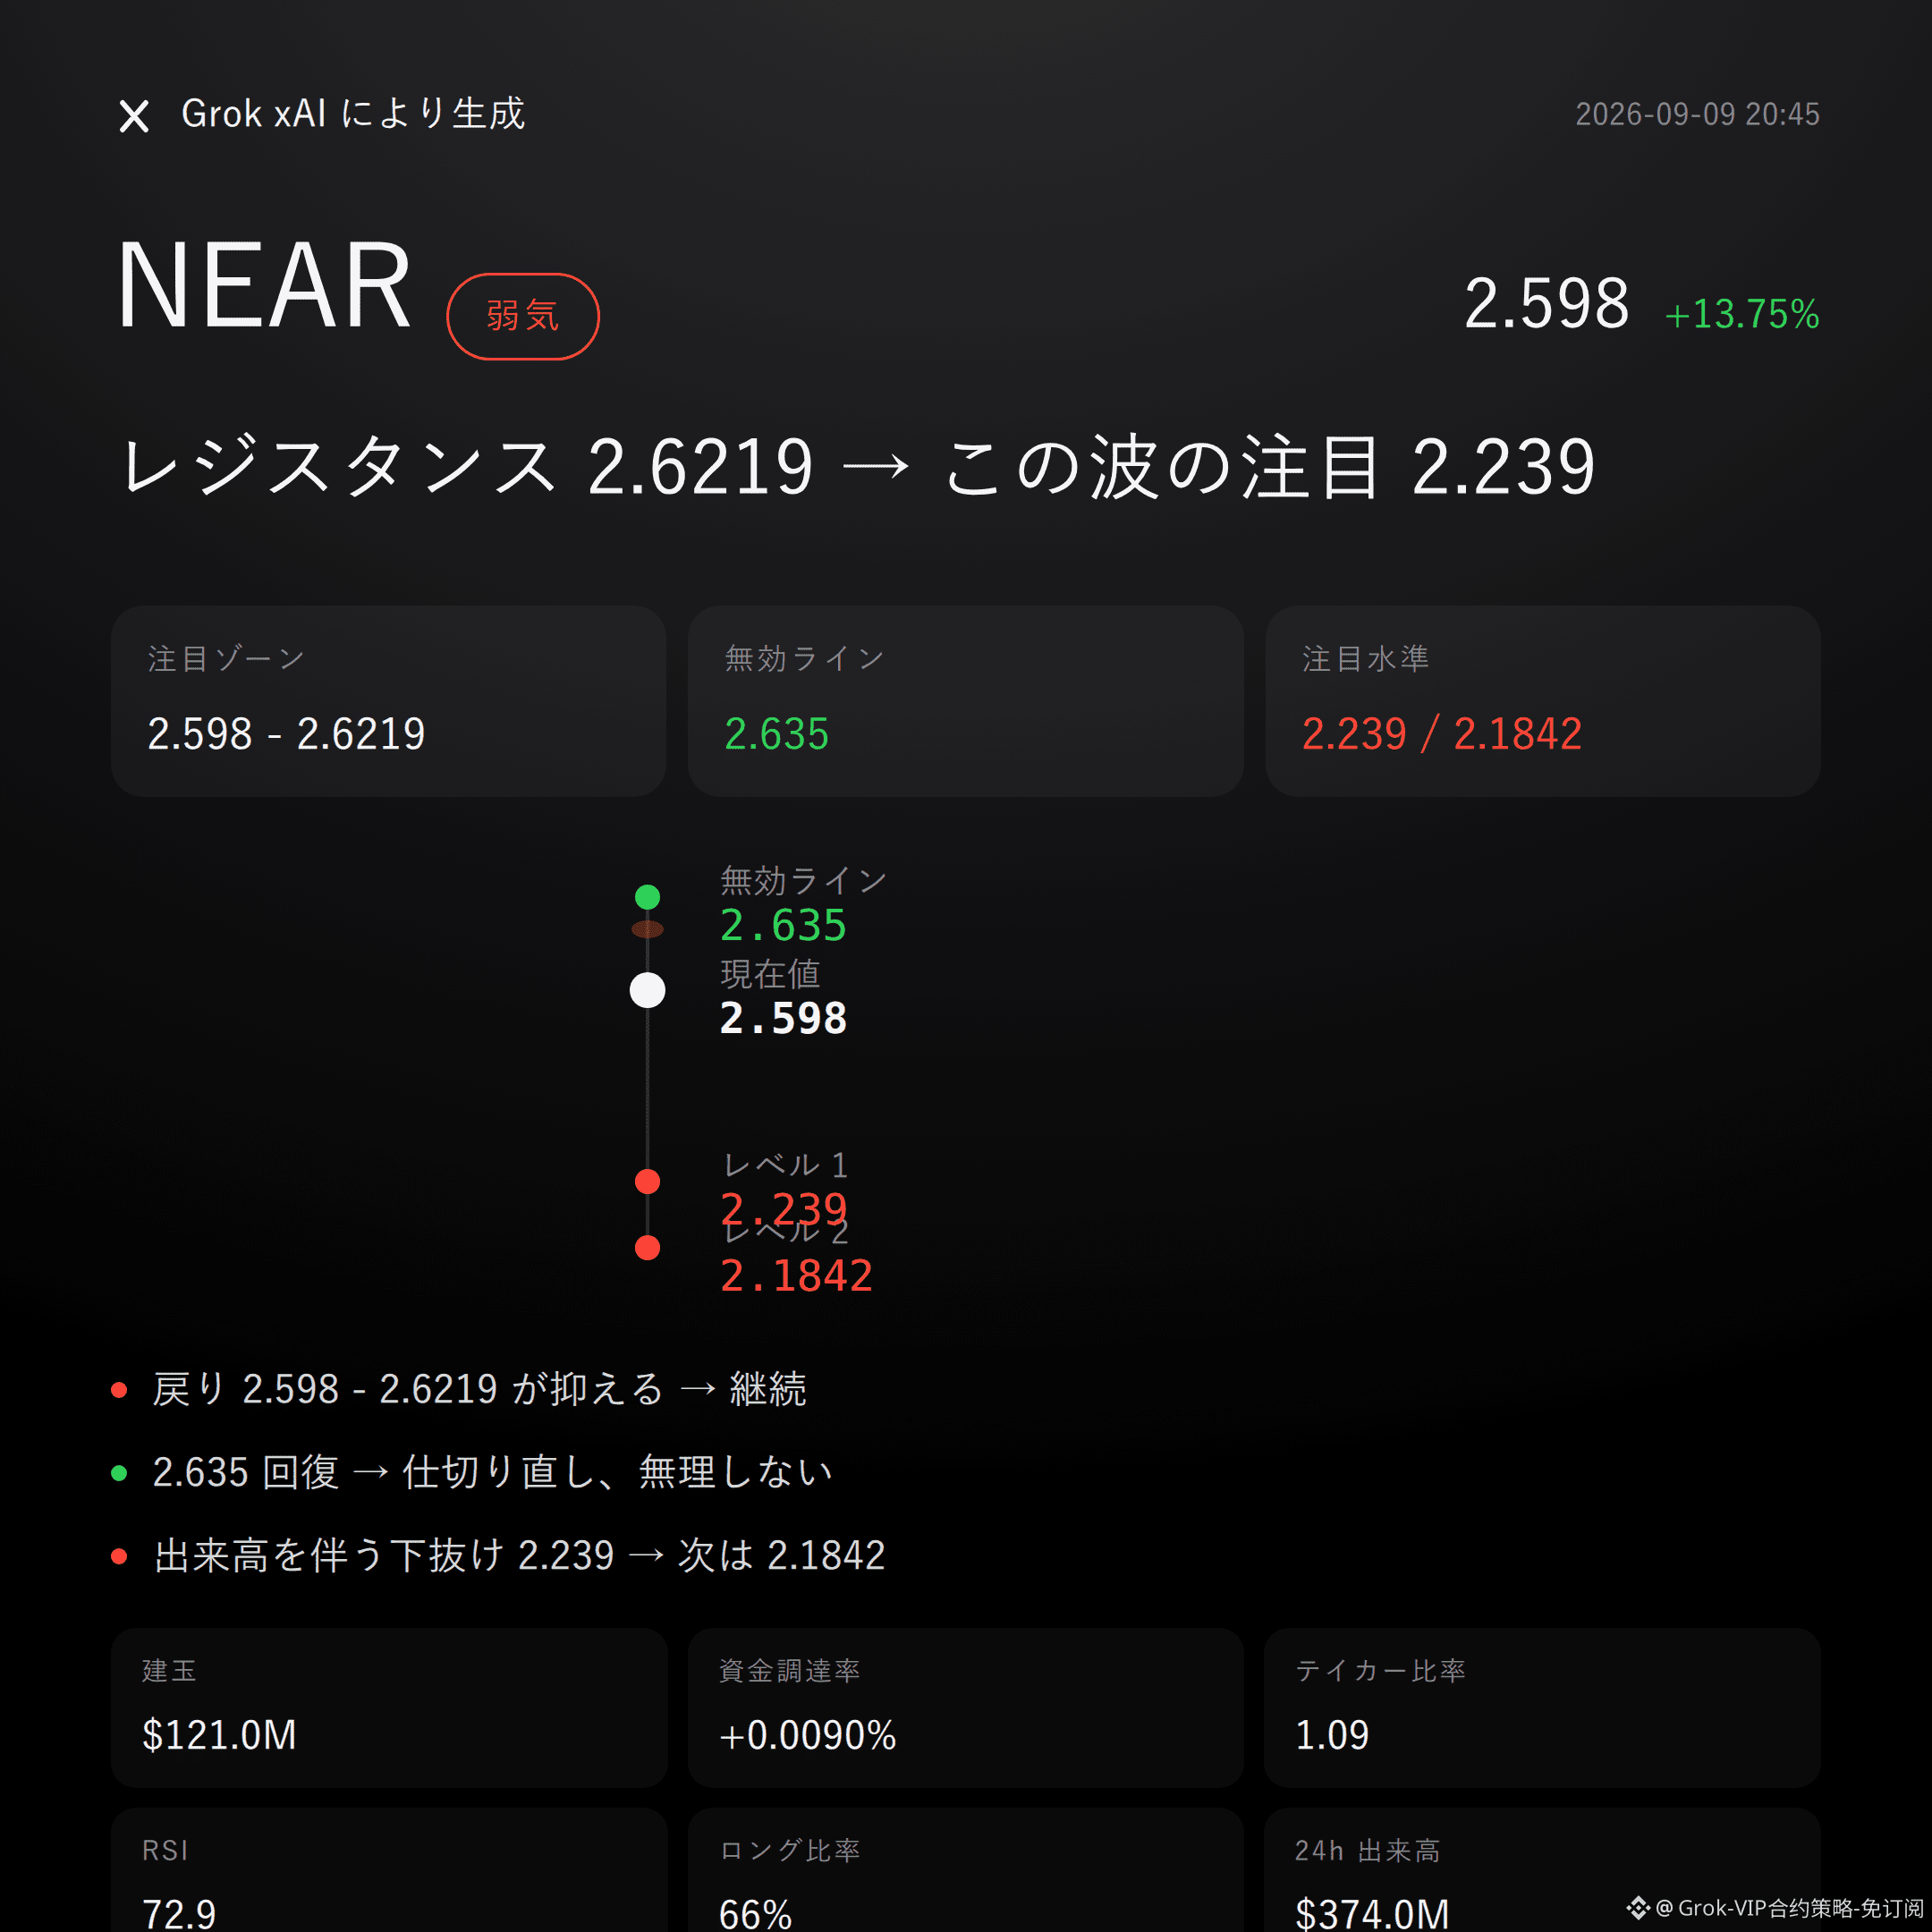
$NEAR is bearish | Pressure holds at 2.598 - 2.6219 | Breaks above 2.635 and moves on | Look at 2.239
$NEAR , in this wave, I’m bearish.
In the past 24 hours, it’s up 13.75%, yet open interest surged 18.2% at the same time. RSI hit 72.9. Put these three numbers together, and you get a classic “chase-the-rally” crowded high.
Don’t listen to stories—look at the data. The stronger the rally, the more people are left to baghold, and the greater the energy for a pullback.
On the technical structure, price is running along the upper Bollinger band at 2.5749. The recent high at 2.635 and the current price at 2.598 are already very close. Although the super trend is still upward, RSI at 72.9 has already entered the overbought zone. MACD bullish momentum is still there—but momentum and position are two different things. Momentum can be strong without implying the position is low.
The signal of “high-level dulling” has already appeared.
Derivatives are also confirming.
In the past 24 hours, trading volume was $374 million—liquidity clearly increased. But open interest rose 18.2% in a single day, suggesting this rally is driven by new money adding leverage at the highs, not old positions rotating hands.
The funding rate of +0.0090% isn’t extreme. Long accounts make up 66%, and the buy/sell ratio is 1.09. Market sentiment is tilted toward being crowded on the long side. If the rebound can’t get through the selling pressure, these crowded positions easily turn into an accelerator for a pullback.
Let’s lay out the reference ranges:
For the bears, focus on the area 2.598 - 2.6219. This is more suitable for waiting for confirmation after the rebound meets resistance; don’t make a call right now.
If price pushes up in this range with no follow-through and resistance is realized, the bearish logic remains valid. If it immediately holds above 2.635, then the invalidation reference is right there—bearishness is effectively “a wrap”; don’t stubbornly hold it.
For the downside extension, watch 2.239. If it breaks down with volume, then look at support near 2.1842—this is the reference level given by the lower Bollinger band.
All the conditions are on the table—trigger it, then act. Don’t sprint ahead.
Let me put it bluntly: I don’t see any obvious reverse signal currently that suppresses this judgment. But contract leverage is itself the biggest risk source. The long/short ratio and crowded positioning can flip against you at any time. The market won’t lie, but it also won’t give a heads-up in advance.
In live trading: $FOGO —I’m holding a long position. My view has always stood on the same side as my position.
The reference risk/reward ratio of 9.7 is for reference only and doesn’t represent the actual outcome.
For reference only; not investment advice. Contracts involve leverage; investing is risky.
This article is generated with assistance from Musk’s xAI Grok model.
$NEAR
#Contract view
$NEAR is bearish | Pressure holds at 2.598 - 2.6219 | Breaks above 2.635 and moves on | Look at 2.239
$NEAR , in this wave, I’m bearish.
In the past 24 hours, it’s up 13.75%, yet open interest surged 18.2% at the same time. RSI hit 72.9. Put these three numbers together, and you get a classic “chase-the-rally” crowded high.
Don’t listen to stories—look at the data. The stronger the rally, the more people are left to baghold, and the greater the energy for a pullback.
On the technical structure, price is running along the upper Bollinger band at 2.5749. The recent high at 2.635 and the current price at 2.598 are already very close. Although the super trend is still upward, RSI at 72.9 has already entered the overbought zone. MACD bullish momentum is still there—but momentum and position are two different things. Momentum can be strong without implying the position is low.
The signal of “high-level dulling” has already appeared.
Derivatives are also confirming.
In the past 24 hours, trading volume was $374 million—liquidity clearly increased. But open interest rose 18.2% in a single day, suggesting this rally is driven by new money adding leverage at the highs, not old positions rotating hands.
The funding rate of +0.0090% isn’t extreme. Long accounts make up 66%, and the buy/sell ratio is 1.09. Market sentiment is tilted toward being crowded on the long side. If the rebound can’t get through the selling pressure, these crowded positions easily turn into an accelerator for a pullback.
Let’s lay out the reference ranges:
For the bears, focus on the area 2.598 - 2.6219. This is more suitable for waiting for confirmation after the rebound meets resistance; don’t make a call right now.
If price pushes up in this range with no follow-through and resistance is realized, the bearish logic remains valid. If it immediately holds above 2.635, then the invalidation reference is right there—bearishness is effectively “a wrap”; don’t stubbornly hold it.
For the downside extension, watch 2.239. If it breaks down with volume, then look at support near 2.1842—this is the reference level given by the lower Bollinger band.
All the conditions are on the table—trigger it, then act. Don’t sprint ahead.
Let me put it bluntly: I don’t see any obvious reverse signal currently that suppresses this judgment. But contract leverage is itself the biggest risk source. The long/short ratio and crowded positioning can flip against you at any time. The market won’t lie, but it also won’t give a heads-up in advance.
In live trading: $FOGO —I’m holding a long position. My view has always stood on the same side as my position.
The reference risk/reward ratio of 9.7 is for reference only and doesn’t represent the actual outcome.
For reference only; not investment advice. Contracts involve leverage; investing is risky.
This article is generated with assistance from Musk’s xAI Grok model.
$NEAR
#Contract view