
橙子Joyce
292 Posts

橙子Joyce
 Square Verified+
价值投资者:以十年为单位投资美股及BTC.ETH.BNB.SOL.推特X:@Joyce88ai
Frequent Trader
8.7 Years
766 Following
33.5K+ Followers
41.6K+ Liked
Posts
All
Quotes
Videos
Live
PINNED
Verified
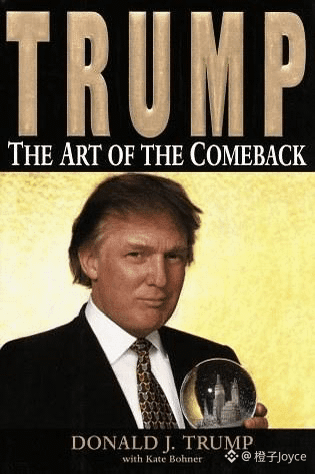
Underestimated Risks in the U.S. Midterm Elections?
The market is seriously underestimating the risk that the results of the U.S. midterm elections could be challenged, triggering political and legal disputes. At the same time, hedging costs on Wall Street have fallen to their lowest level of the year, and the implied volatility of S&P 500 put options for November has dropped below 15%, creating a low-cost window to buy protection early.
The probability that the election results could be disputed, or even spark political turmoil, is being severely underestimated by the market, and current pricing in the options market does not fully reflect this tail risk.
As the market calmed in August, the implied volatility of S&P 500 put options has fallen significantly from its July highs. The calmer the market, the cheaper protection becomes; but once election risk is truly priced into assets, volatility could rise rapidly, and the cost of hedging at that point would increase markedly.
The core logic is built on the current polling situation. Polls generally show Trump’s approval rating slipping, Democrats likely to regain control of the House, and Republicans expected to keep their Senate majority.
What the market is truly overlooking is not the election result itself, but the political and legal disputes that could emerge if the result is challenged. If the final outcome is unfavorable to Trump, the market is severely underestimating the likelihood that Trump would react strongly and challenge results in certain districts.
In that scenario, Trump may launch legal challenges to every “contested” district, delaying the certification process and triggering a wave of media coverage around disputes such as “what happens next” and claims that the election was “stolen.”
This political uncertainty could ultimately spill over into financial markets and drive volatility sharply higher. For markets, the most dangerous outcome is not necessarily that one side wins, but that the election result remains unconfirmed for an extended period, creating persistent uncertainty.
The market is seriously underestimating the risk that the results of the U.S. midterm elections could be challenged, triggering political and legal disputes. At the same time, hedging costs on Wall Street have fallen to their lowest level of the year, and the implied volatility of S&P 500 put options for November has dropped below 15%, creating a low-cost window to buy protection early.
The probability that the election results could be disputed, or even spark political turmoil, is being severely underestimated by the market, and current pricing in the options market does not fully reflect this tail risk.
As the market calmed in August, the implied volatility of S&P 500 put options has fallen significantly from its July highs. The calmer the market, the cheaper protection becomes; but once election risk is truly priced into assets, volatility could rise rapidly, and the cost of hedging at that point would increase markedly.
The core logic is built on the current polling situation. Polls generally show Trump’s approval rating slipping, Democrats likely to regain control of the House, and Republicans expected to keep their Senate majority.
What the market is truly overlooking is not the election result itself, but the political and legal disputes that could emerge if the result is challenged. If the final outcome is unfavorable to Trump, the market is severely underestimating the likelihood that Trump would react strongly and challenge results in certain districts.
In that scenario, Trump may launch legal challenges to every “contested” district, delaying the certification process and triggering a wave of media coverage around disputes such as “what happens next” and claims that the election was “stolen.”
This political uncertainty could ultimately spill over into financial markets and drive volatility sharply higher. For markets, the most dangerous outcome is not necessarily that one side wins, but that the election result remains unconfirmed for an extended period, creating persistent uncertainty.

PINNED
Verified
$SpaceX (SPCX.US)$ After nearly two months, the company’s market capitalization has once again risen above $2 trillion. Estimated in a report: SpaceX’s weight in the Nasdaq-100 is expected to increase to about 1.51%, which would drive passive net buying of roughly $12.4 billion in stocks by index funds and ETFs tracking the index. However, it’s worth noting that passive buying is mechanism-driven and represents predictable inflows; some “smart money” may have already positioned ahead of time. When the effect actually takes hold, the degree of upward price elasticity depends on the attitude of active capital at that time. The following reviews SpaceX’s current stock price trend and key structure one by one from a technical perspective.
SpaceX is currently maintaining a short-term uptrend, with a strong breakout from the prior consolidation range, and the structure is intact. Of note, the EMA60 has crossed above the EMA20, and short- to mid-term momentum remains biased bullish.
Key Technical Indicator Interpretations
EMA moving averages: EMA5 is $148.07, EMA10 is $144.87, EMA20 is $140.99. The EMA60 breaking above the EMA20 is an upgrade signal for the medium-term structural trend; the moving-average structure is healthy.
RSI: 62.58, sitting in a neutral-to-strong range. Over the past 10 days, the RSI has risen in step with the stock price; no top divergence is evident, and momentum is still present.
MACD: The MACD line (4.01) > the Signal line (2.58). The histogram is positive and continues to expand. The golden cross is maintained. With the indicator located above the zero axis, bullish momentum continues to strengthen, with no divergence observed.
Bollinger Bands: The bands are in an expansion phase. The latest closing price of $153.47 has broken above the upper band, indicating a strong trend. However, be cautious of the risk of a mean reversion back toward the middle band that can be triggered when band width expands and then narrows.
Fibonacci: The current price of $153.47 is above the Fibonacci 61.8% level ($150.98) and below the Fibonacci 50.0% level ($165.23). The next upside target reference is $165.23, and the near-term support is $150.98.
Overall Assessment
Regarding key support, $150.98 corresponds to the Fibonacci 61.8% retracement. The stock has recently broken effectively above this pressure level, and that area has now turned into support. If the level is lost, then $145.14 (the September 8 intraday low with a lower shadow) forms a near-term bottom reference. If the price continues to fall, you can watch the EMA60 ($141.65) and the MA50 ($135.99) as two medium-term strong support levels.
On the resistance side, focus first on the intraday high of $155.00 on September 8. On the medium-term directional front, the Fibonacci 50.0% retracement level at $165.23 is the more distant, key medium-term resistance. If near-term momentum continues, it can be referenced as a medium-term target direction.
$SPCX
SpaceX is currently maintaining a short-term uptrend, with a strong breakout from the prior consolidation range, and the structure is intact. Of note, the EMA60 has crossed above the EMA20, and short- to mid-term momentum remains biased bullish.
Key Technical Indicator Interpretations
EMA moving averages: EMA5 is $148.07, EMA10 is $144.87, EMA20 is $140.99. The EMA60 breaking above the EMA20 is an upgrade signal for the medium-term structural trend; the moving-average structure is healthy.
RSI: 62.58, sitting in a neutral-to-strong range. Over the past 10 days, the RSI has risen in step with the stock price; no top divergence is evident, and momentum is still present.
MACD: The MACD line (4.01) > the Signal line (2.58). The histogram is positive and continues to expand. The golden cross is maintained. With the indicator located above the zero axis, bullish momentum continues to strengthen, with no divergence observed.
Bollinger Bands: The bands are in an expansion phase. The latest closing price of $153.47 has broken above the upper band, indicating a strong trend. However, be cautious of the risk of a mean reversion back toward the middle band that can be triggered when band width expands and then narrows.
Fibonacci: The current price of $153.47 is above the Fibonacci 61.8% level ($150.98) and below the Fibonacci 50.0% level ($165.23). The next upside target reference is $165.23, and the near-term support is $150.98.
Overall Assessment
Regarding key support, $150.98 corresponds to the Fibonacci 61.8% retracement. The stock has recently broken effectively above this pressure level, and that area has now turned into support. If the level is lost, then $145.14 (the September 8 intraday low with a lower shadow) forms a near-term bottom reference. If the price continues to fall, you can watch the EMA60 ($141.65) and the MA50 ($135.99) as two medium-term strong support levels.
On the resistance side, focus first on the intraday high of $155.00 on September 8. On the medium-term directional front, the Fibonacci 50.0% retracement level at $165.23 is the more distant, key medium-term resistance. If near-term momentum continues, it can be referenced as a medium-term target direction.
$SPCX

SPCX-2.74%
SPCXUS-2.96%

远方1688BNB
·
--
As long as you keep getting better, it’s okay to go slowly. Believe that every day is a good day, and everything is good news!
#定投BTC #DCA into BNB
#定投BTC #DCA into BNB


叮当 Doraemon
·
--
Oh no, it’s over—everyone goes their own way. A trader lost more than $190,000 from chasing LAPTOP
September 9, according to Lookonchain monitoring, a trader chased higher prices for a token related to Hunter Biden, LAPTOP, and lost $200,000, leaving only about $3,000. The trader withdrew $250,000 from Binance in advance, planning to buy immediately after LAPTOP goes live. In the end, he spent $200,000 to buy 919 LAPTOP at a high price of $218 per token; currently, this position is worth only about $3,000.


灼见
·
--
🚨 $1 Billion Is Buying BTC, But the Price Won’t Rise.
This may be the most concerning—and most promising—signal in today’s Crypto market.
Over the past 3 trading days, US spot BTC ETF total net inflows are approximately:
$1.01 BILLION.
Institutions aren’t running away.
On the contrary—they’re still buying.
But what about $BTC?
It’s still being held below $80K, oscillating back around the $78K area.
So the real question right now isn’t:
“Is anyone buying BTC?”
The answer is obvious:
Yes.
The real question is:
Who is selling to them?
Think about that logic.
If billions in ETF money enter the market every day, yet the price doesn’t break through in sync—
it means there’s a massive supply of sell orders above.
But on the other hand:
What if this batch of sell orders gradually gets absorbed by ETF inflows?
That’s the part I think is most worth watching right now.
Because the market may be going through an unseen:
SUPPLY vs DEMAND war.
At the same time, another signal is also interesting:
🟠 $BTC: Institutions keep buying, but the price is suppressed
🟣 $ETH: Temporary lack of clear direction
🟡 $BNB: In the past 7 days, it has still maintained clear relative strength
So I’m not in a hurry to guess the next BTC candlestick.
I’m only looking at two questions:
① Will ETF money keep flowing in?
② When BTC doesn’t rise, who is still rallying?
The second question is especially important.
Because if BTC continues to trade sideways, while large ecosystem assets like BNB keep showing Relative Strength—
capital rotation may already have happened,
but most people are still watching BTC’s $80K.
The most dangerous time for the market is when:
Nobody wants to buy.
But the most interesting time for the market is when:
Someone is buying like crazy, yet the price doesn’t rise—for now.
Because this kind of balance
usually doesn’t last forever.
👇 Which do you think will happen next?
BTC breaks above $80K / BNB keeps outperforming / the whole market pulls back again?
#BTC #ETH #BNB
This may be the most concerning—and most promising—signal in today’s Crypto market.
Over the past 3 trading days, US spot BTC ETF total net inflows are approximately:
$1.01 BILLION.
Institutions aren’t running away.
On the contrary—they’re still buying.
But what about $BTC?
It’s still being held below $80K, oscillating back around the $78K area.
So the real question right now isn’t:
“Is anyone buying BTC?”
The answer is obvious:
Yes.
The real question is:
Who is selling to them?
Think about that logic.
If billions in ETF money enter the market every day, yet the price doesn’t break through in sync—
it means there’s a massive supply of sell orders above.
But on the other hand:
What if this batch of sell orders gradually gets absorbed by ETF inflows?
That’s the part I think is most worth watching right now.
Because the market may be going through an unseen:
SUPPLY vs DEMAND war.
At the same time, another signal is also interesting:
🟠 $BTC: Institutions keep buying, but the price is suppressed
🟣 $ETH: Temporary lack of clear direction
🟡 $BNB: In the past 7 days, it has still maintained clear relative strength
So I’m not in a hurry to guess the next BTC candlestick.
I’m only looking at two questions:
① Will ETF money keep flowing in?
② When BTC doesn’t rise, who is still rallying?
The second question is especially important.
Because if BTC continues to trade sideways, while large ecosystem assets like BNB keep showing Relative Strength—
capital rotation may already have happened,
but most people are still watching BTC’s $80K.
The most dangerous time for the market is when:
Nobody wants to buy.
But the most interesting time for the market is when:
Someone is buying like crazy, yet the price doesn’t rise—for now.
Because this kind of balance
usually doesn’t last forever.
👇 Which do you think will happen next?
BTC breaks above $80K / BNB keeps outperforming / the whole market pulls back again?
#BTC #ETH #BNB

go

Suadagar Ali
·
--
#BNB ETH BTC$
follow like and
🌹☘️🥀🌹comments
repost
follow like and
🌹☘️🥀🌹comments
repost


阿波罗1111
·
--
Whether it can be implemented is the key to a real project
First, don’t look at the superficial numbers;
Second, don’t listen to what the project team says;
Third, remember: the fundamental thing is to analyze any project from a logical standpoint;
Fourth, study the project itself—first the whitepaper, second the roadmap, third the steps, and fourth the implementation!
In the end, you’ll find out why many scam projects never make it to exchanges: because scammers know they’re lying!
It’s a pity that what “green” investors want is narrative, big promises, and unrealistic lies, as well as emotional comfort!
In the end, the green investors deserve it! Because of cognitive shortcomings!
First, don’t look at the superficial numbers;
Second, don’t listen to what the project team says;
Third, remember: the fundamental thing is to analyze any project from a logical standpoint;
Fourth, study the project itself—first the whitepaper, second the roadmap, third the steps, and fourth the implementation!
In the end, you’ll find out why many scam projects never make it to exchanges: because scammers know they’re lying!
It’s a pity that what “green” investors want is narrative, big promises, and unrealistic lies, as well as emotional comfort!
In the end, the green investors deserve it! Because of cognitive shortcomings!


加密野狼
·
--
🚨 [Situation Update] The Middle East powder keg has been ignited—yet BTC is trading independently? With 🧧
In the past 72 hours, geopolitics has exploded into chaos:
🇮🇷🇺🇸 The US and Iran have clashed head-on in the Persian Gulf—US forces destroyed five Iranian oil tankers, and Iran fired back with missiles striking US bases in Jordan. Iran has announced it will declare the Strait of Hormuz a “no-go zone,” with daily passage volume falling from 130 ships to just 10. Brent crude has surged toward $100.
🇷🇺🇺🇦 After a brief 3-day ceasefire, fighting in Russia-Ukraine has reignited, with Kyiv again hit by multiple rounds of missile and drone attacks.
Traditional markets are trembling, but BTC is different this time.
In the past, BTC has been highly correlated with US stocks. But during this round of geopolitical conflict—oil prices broke above $100 and gold is rising, while BTC didn’t follow stocks down. Instead, it’s held steady in the $78,000–$80,000 range. The market is pricing in a new narrative: Bitcoin is shifting from a “risk asset” to “digital gold.”
Technical signals also back it up: on September 8, BTC’s 50-day moving average crossed above the 200-day moving average, forming a “golden cross”—the first time since November 2025. In the past three weeks, US spot Bitcoin ETFs saw net inflows of up to $3.8 billion, marking the strongest institutional buying record of 2026.
But don’t get too excited yet—the next 48 hours is the real battleground:
📅 September 10 PPI data
📅 September 11 August CPI data (key!)
📅 September 15–16 FOMC meeting
At present, CME pricing for September rate hikes has surged to 60–66%. If CPI runs hot → the probability of hikes rises further → BTC could jump to $75,000. If CPI is mild → rate-hike expectations ease → BTC may retest $82,000 and even $85,000.
Long vs. short showdown—where do you stand?
🧧 Share like comment: BTC
⚠️ The above does not constitute investment advice—DYOR!
#BTC #cryptocurrency #geopolitics #bitcoin #美联储何时降息?
In the past 72 hours, geopolitics has exploded into chaos:
🇮🇷🇺🇸 The US and Iran have clashed head-on in the Persian Gulf—US forces destroyed five Iranian oil tankers, and Iran fired back with missiles striking US bases in Jordan. Iran has announced it will declare the Strait of Hormuz a “no-go zone,” with daily passage volume falling from 130 ships to just 10. Brent crude has surged toward $100.
🇷🇺🇺🇦 After a brief 3-day ceasefire, fighting in Russia-Ukraine has reignited, with Kyiv again hit by multiple rounds of missile and drone attacks.
Traditional markets are trembling, but BTC is different this time.
In the past, BTC has been highly correlated with US stocks. But during this round of geopolitical conflict—oil prices broke above $100 and gold is rising, while BTC didn’t follow stocks down. Instead, it’s held steady in the $78,000–$80,000 range. The market is pricing in a new narrative: Bitcoin is shifting from a “risk asset” to “digital gold.”
Technical signals also back it up: on September 8, BTC’s 50-day moving average crossed above the 200-day moving average, forming a “golden cross”—the first time since November 2025. In the past three weeks, US spot Bitcoin ETFs saw net inflows of up to $3.8 billion, marking the strongest institutional buying record of 2026.
But don’t get too excited yet—the next 48 hours is the real battleground:
📅 September 10 PPI data
📅 September 11 August CPI data (key!)
📅 September 15–16 FOMC meeting
At present, CME pricing for September rate hikes has surged to 60–66%. If CPI runs hot → the probability of hikes rises further → BTC could jump to $75,000. If CPI is mild → rate-hike expectations ease → BTC may retest $82,000 and even $85,000.
Long vs. short showdown—where do you stand?
🧧 Share like comment: BTC
⚠️ The above does not constitute investment advice—DYOR!
#BTC #cryptocurrency #geopolitics #bitcoin #美联储何时降息?

自由1688
·
--
Decentralized AI Token VVV Soars 34% in a Single Day—Privacy Computing Is Here!
Hey everyone, fellow veterans deep in the Web3 and AI space—Decentralized AI (DeAI) has just kicked off a strong run of momentum!
Erik Voorhees. Image: Decrypt/Venice AI
The ecosystem token of the well-known privacy-focused AI platform Venice, VVV, skyrocketed 34% in a single day on Tuesday, smashing through $24.77. And the spark that ignited this rally was, surprisingly, an intellectual property dispute exposed by AI giant OpenAI.
Let me break down this VVV surge with hardcore analysis—the core logic behind it and the wealth code:
🔥 1. Big Tech Fails: OpenAI Faces a Trust Crisis
Academic authorship dispute: A mathematician at New York University (NYU) sparked a public dispute with OpenAI over authorship rights concerning a proof in fluid dynamics.
Erik Voorhees. Image: Decrypt/Venice AI
The ecosystem token of the well-known privacy-focused AI platform Venice, VVV, skyrocketed 34% in a single day on Tuesday, smashing through $24.77. And the spark that ignited this rally was, surprisingly, an intellectual property dispute exposed by AI giant OpenAI.
Let me break down this VVV surge with hardcore analysis—the core logic behind it and the wealth code:
🔥 1. Big Tech Fails: OpenAI Faces a Trust Crisis
Academic authorship dispute: A mathematician at New York University (NYU) sparked a public dispute with OpenAI over authorship rights concerning a proof in fluid dynamics.


晚风Vesper_1688
·
--
🌙 As the night grows quieter, a cup of clear tea settles the restlessness within 🍃
The noise of rise and fall on the board will eventually end 📊,
and the cultivation of trading is hidden between choosing and waiting 🕯️.
Don’t obsess over daily gains or losses—learn to stop at the right time and reflect in calmness.
Opportunities never fail to appear; only by staying steady and focused can you see the cycle ✨.
Simplify and let go of the unnecessary, stick to your trading principles, and quietly wait for your moment 💎.
Wishing fellow travelers: let go of impatience, and keep your heart in harmony 🌌
#交易心理
#原油涨至7月来最高
#1688家族family
The noise of rise and fall on the board will eventually end 📊,
and the cultivation of trading is hidden between choosing and waiting 🕯️.
Don’t obsess over daily gains or losses—learn to stop at the right time and reflect in calmness.
Opportunities never fail to appear; only by staying steady and focused can you see the cycle ✨.
Simplify and let go of the unnecessary, stick to your trading principles, and quietly wait for your moment 💎.
Wishing fellow travelers: let go of impatience, and keep your heart in harmony 🌌
#交易心理
#原油涨至7月来最高
#1688家族family

go

Syco 疯子
·
--
🌹 Hey fam good morning🌞 🎁🧧
In trading every dip is a chance, every spike a
lesson. Trade smart, stay disciplined, and let
Consistency turn moves into profits.
here is your today 🎁🎁
$BNB
In trading every dip is a chance, every spike a
lesson. Trade smart, stay disciplined, and let
Consistency turn moves into profits.
here is your today 🎁🎁
$BNB


易琳Ten
·
--
Trading has never been just a test of intelligence
Traditional IQ tests measure language, logic, and spatial reasoning—but none of these determine whether a trader can reach the top of the market.
Real top-tier trading ability comes from three core qualities:
First, probabilistic intuition.
It’s not about predicting the future; it’s about quickly judging win probability amid uncertainty—knowing when to act and when to wait.
Second, emotional control.
When facing massive unrealized losses, consecutive stop-outs, and market panic, you can still stay calm and not be ruled by greed or fear.
Third, pattern recognition ability.
By reading complex price fluctuations, fund flows, and market sentiment, you can capture patterns others can’t see.
Real top-tier trading ability comes from three core qualities:
First, probabilistic intuition.
It’s not about predicting the future; it’s about quickly judging win probability amid uncertainty—knowing when to act and when to wait.
Second, emotional control.
When facing massive unrealized losses, consecutive stop-outs, and market panic, you can still stay calm and not be ruled by greed or fear.
Third, pattern recognition ability.
By reading complex price fluctuations, fund flows, and market sentiment, you can capture patterns others can’t see.


长得帅不如跑的快1688
·
--
🚨 $1 BILLION is buying Bitcoin — yet BTC still can’t break higher.
This may be the most interesting signal in crypto right now.
Over the last three trading sessions, U.S. spot Bitcoin ETFs recorded roughly:
$1.01 BILLION in net inflows.
Institutions aren’t leaving.
They’re BUYING.
Yet $BTC is still below $80K, trading around the $78K area.
So the real question is no longer:
“Is anyone buying Bitcoin?”
Clearly, yes.
The better question is:
WHO IS SELLING TO THEM?
Think about it.
If hundreds of millions of dollars keep entering through ETFs while price refuses to break out —
there must be significant supply being absorbed.
But flip that logic around.
What happens when that supply eventually runs out?
That’s what I’m watching.
Because underneath this boring price action may be a massive invisible battle:
SUPPLY vs DEMAND.
And there’s another interesting signal:
🟠 $BTC: Institutional buying, but price remains capped
🟣 $ETH: Still searching for direction
🟡 $BNB: Still showing clear relative strength over the past week
So I’m not trying to predict BTC’s next candle.
I’m watching two things:
1️⃣ Do ETF inflows continue?
2️⃣ Who keeps outperforming while BTC goes nowhere?
The second question matters.
If BTC continues consolidating while major ecosystem assets like BNB maintain relative strength —
rotation may already be happening.
Most people are simply too focused on BTC’s $80K battle to notice.
The most dangerous market is one where:
Nobody wants to buy.
But one of the most interesting markets is where:
Someone is buying aggressively — and price STILL hasn’t moved.
Because that equilibrium rarely lasts forever.
👇 What happens FIRST?
BTC > $80K / BNB keeps outperforming / Market pulls back again?
#BTC #ETH #BNB
This may be the most interesting signal in crypto right now.
Over the last three trading sessions, U.S. spot Bitcoin ETFs recorded roughly:
$1.01 BILLION in net inflows.
Institutions aren’t leaving.
They’re BUYING.
Yet $BTC is still below $80K, trading around the $78K area.
So the real question is no longer:
“Is anyone buying Bitcoin?”
Clearly, yes.
The better question is:
WHO IS SELLING TO THEM?
Think about it.
If hundreds of millions of dollars keep entering through ETFs while price refuses to break out —
there must be significant supply being absorbed.
But flip that logic around.
What happens when that supply eventually runs out?
That’s what I’m watching.
Because underneath this boring price action may be a massive invisible battle:
SUPPLY vs DEMAND.
And there’s another interesting signal:
🟠 $BTC: Institutional buying, but price remains capped
🟣 $ETH: Still searching for direction
🟡 $BNB: Still showing clear relative strength over the past week
So I’m not trying to predict BTC’s next candle.
I’m watching two things:
1️⃣ Do ETF inflows continue?
2️⃣ Who keeps outperforming while BTC goes nowhere?
The second question matters.
If BTC continues consolidating while major ecosystem assets like BNB maintain relative strength —
rotation may already be happening.
Most people are simply too focused on BTC’s $80K battle to notice.
The most dangerous market is one where:
Nobody wants to buy.
But one of the most interesting markets is where:
Someone is buying aggressively — and price STILL hasn’t moved.
Because that equilibrium rarely lasts forever.
👇 What happens FIRST?
BTC > $80K / BNB keeps outperforming / Market pulls back again?
#BTC #ETH #BNB


加倉妹
·
--
Watching the city’s countless home lights, my heart is full of hope!
😊 Face each day with joy, and bravely pursue your goals. Believe in yourself, keep working hard— a wonderful future is sure to come!
😊 Face each day with joy, and bravely pursue your goals. Believe in yourself, keep working hard— a wonderful future is sure to come!


大仁Jaron
·
--
The “sweet spot poison pill” of index weights: SpaceX’s $12.4 billion passive buying is about to collide head-on with a flood of 2.3 billion shares set to be unblocked
A “non-fundamental” rally triggered by index rules
The wave of buying ahead for SpaceX has little to do with its business prospects. It’s more like a mechanical outcome produced after an index construction rule that few people pay attention to gets triggered.
The Nasdaq 100’s quarterly rebalance effective September 21 is expected to raise SpaceX’s weighting from 1.25% to about 1.51%. According to a team led by JPMorgan strategist Min Moon, this adjustment will trigger roughly $12.4 billion in passive net buying.
The direct reason for the jump in weighting is that the free-float ratio has risen from less than 10% after the IPO to nearly 30%—after more than 1 billion shares of lock-up stock are released, the index rules automatically amplify the inclusion weight of this mega-cap with a market value of more than $2 trillion.
The wave of buying ahead for SpaceX has little to do with its business prospects. It’s more like a mechanical outcome produced after an index construction rule that few people pay attention to gets triggered.
The Nasdaq 100’s quarterly rebalance effective September 21 is expected to raise SpaceX’s weighting from 1.25% to about 1.51%. According to a team led by JPMorgan strategist Min Moon, this adjustment will trigger roughly $12.4 billion in passive net buying.
The direct reason for the jump in weighting is that the free-float ratio has risen from less than 10% after the IPO to nearly 30%—after more than 1 billion shares of lock-up stock are released, the index rules automatically amplify the inclusion weight of this mega-cap with a market value of more than $2 trillion.


路人1688luren
·
--
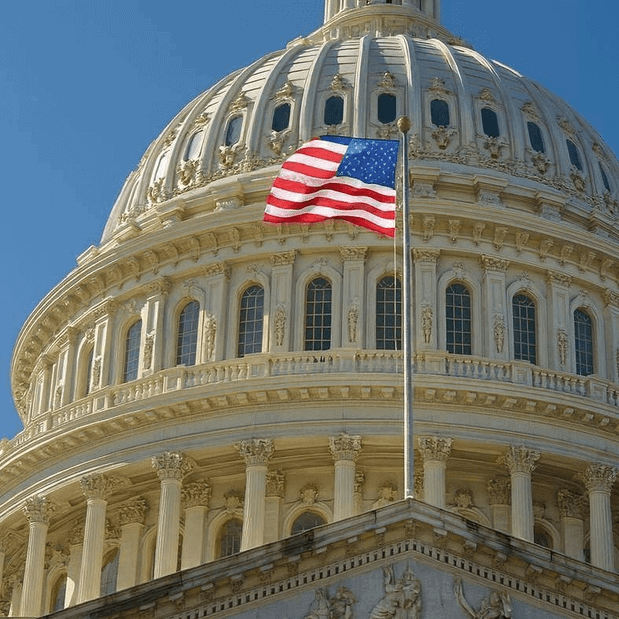
#灰度ZcashETF资产突破5亿美元 9月15日Ripple's Chief Legal Officer Stuart Alderoty stated at a blockchain seminar in Wyoming that September 15 will serve as a key indicator of the prospects for the CLARITY Act—on that day, the Senate will hold its first procedural vote, and the legislation can move forward only with the support of 60 votes. Alderoty said that if the bill fails, the SEC and the CFTC will continue to advance their respective rulemaking, and he hopes the bill can pass. Citing research data from the National Crypto Association, he warned that if the legislation cannot be passed, the United States could push 232,000 crypto-related jobs and $55 billion in economic activity overseas. On the same day, the SEC proposed a new rule titled “Regulation Crypto Assets,” providing an exemption pathway for digital asset financing.$BNB




大丽7613
·
--
Two major bearish shocks in the crypto market are about to hit!
Will the Clarity Act still be able to pass?
Now we have new information.
Which coin has the biggest potential for bottom-fishing?
By comparing on-chain data, I found—this coin is absolutely amazing!
Which coin are you planning to bottom-fish?
Will the Clarity Act still be able to pass?
Now we have new information.
Which coin has the biggest potential for bottom-fishing?
By comparing on-chain data, I found—this coin is absolutely amazing!
Which coin are you planning to bottom-fish?

可可529
·
--
Who helped you when you found yourself at your hardest
Be sure to remember them for life
The most precious virtue in how to live
is to be grateful and never forget
Don’t tear down the bridge after crossing it
Others never had an obligation
to share your troubles
To be willing to help when you’re in the snowstorm
and lend a hand
those who reach out
are truly hoping in their hearts
that you’ll get better
they are rare benefactors
Gratitude is never measured
by how big or small the kindness is
Even if it’s only a sentence of comfort
or a moment of help
it must be kept close in your heart
In all the ways people interact in this world
what’s most valuable
is to keep a heart full of gratitude
Knowing how to remember people’s kindness
and understanding others’ hardships
is the highest-level cultivation of a person!
Be sure to remember them for life
The most precious virtue in how to live
is to be grateful and never forget
Don’t tear down the bridge after crossing it
Others never had an obligation
to share your troubles
To be willing to help when you’re in the snowstorm
and lend a hand
those who reach out
are truly hoping in their hearts
that you’ll get better
they are rare benefactors
Gratitude is never measured
by how big or small the kindness is
Even if it’s only a sentence of comfort
or a moment of help
it must be kept close in your heart
In all the ways people interact in this world
what’s most valuable
is to keep a heart full of gratitude
Knowing how to remember people’s kindness
and understanding others’ hardships
is the highest-level cultivation of a person!




520龙行天下
·
--
Australian Compliance Project TITAN Pay|Binance Square AMA Special Event Rolls Out
On September 10th, tomorrow evening at 8:00 PM, tune in to the 520 Long Xing Tian Xia livestream ✨
Time: 20:30–24:00
We’ll engage in an in-depth discussion on global stablecoin payments, and break down why crypto payments are the fourth payment revolution.
Join industry partners to talk about opportunities and challenges in Hong Kong’s stablecoin issuance, with plenty of interactive giveaways on-site 🎁
On September 10th, tomorrow evening at 8:00 PM, tune in to the 520 Long Xing Tian Xia livestream ✨
Time: 20:30–24:00
We’ll engage in an in-depth discussion on global stablecoin payments, and break down why crypto payments are the fourth payment revolution.
Join industry partners to talk about opportunities and challenges in Hong Kong’s stablecoin issuance, with plenty of interactive giveaways on-site 🎁

Log in to explore more content