$BTC
Latest Analysis — Sept 9, 2026
Current snapshot
- Price: $79,499.81
- 24h: +1.46% to $79,500 high
- August: +∼25% — best month in 21 months
- YTD: -11.72%, but only -7% vs S&P 500 +10% f7228196df0b
*What’s driving it*
1. Fed expectations: BTC rallied to $81,400 intraday after Fed Governor Waller signaled possible rate hold. But caution is back ahead of Sept 16 Fed decision — markets pricing 57% chance of hike. Lower rates = good for risk assets like BTC
2. Technical breakout: Broke downtrend of lower peaks since May. BTC vaulted above 21, 55, 100, 200-day MAs with a "golden cross" on 21-day
3. Flows: Bitcoin ETFs saw $1.01B net inflows in prior 3 trading days, including $730.8M on Sept 3. Strategy also bought 4,603 BTC at ∼$80,318 in late Aug df0be8847729a27328c1baf1
Key levels to watch
- Support: $75,674 Aug 23 low, then $71,781 halfway point of August rally. A break below opens $62,677 then $57,776
- Resistance: $82,793 May high = 61.8% Fibonacci retracement. Above that eyes $90,000 then $97,867 YTD peak a273
September outlook
Historically September averages -2.86% for BTC, and analysts flag risks from CPI data Sept 11, Fed meeting Sept 16, and geopolitical tensions. But if liquidity + institutional demand hold, BTC could consolidate its biggest recovery of 2026. 8196
Bottom line: BTC is catching its breath after a 30% surge. Bulls control above $71,781, but Fed + inflation data this week will decide if we retest $80K-$82K or slip back to $75K. a273
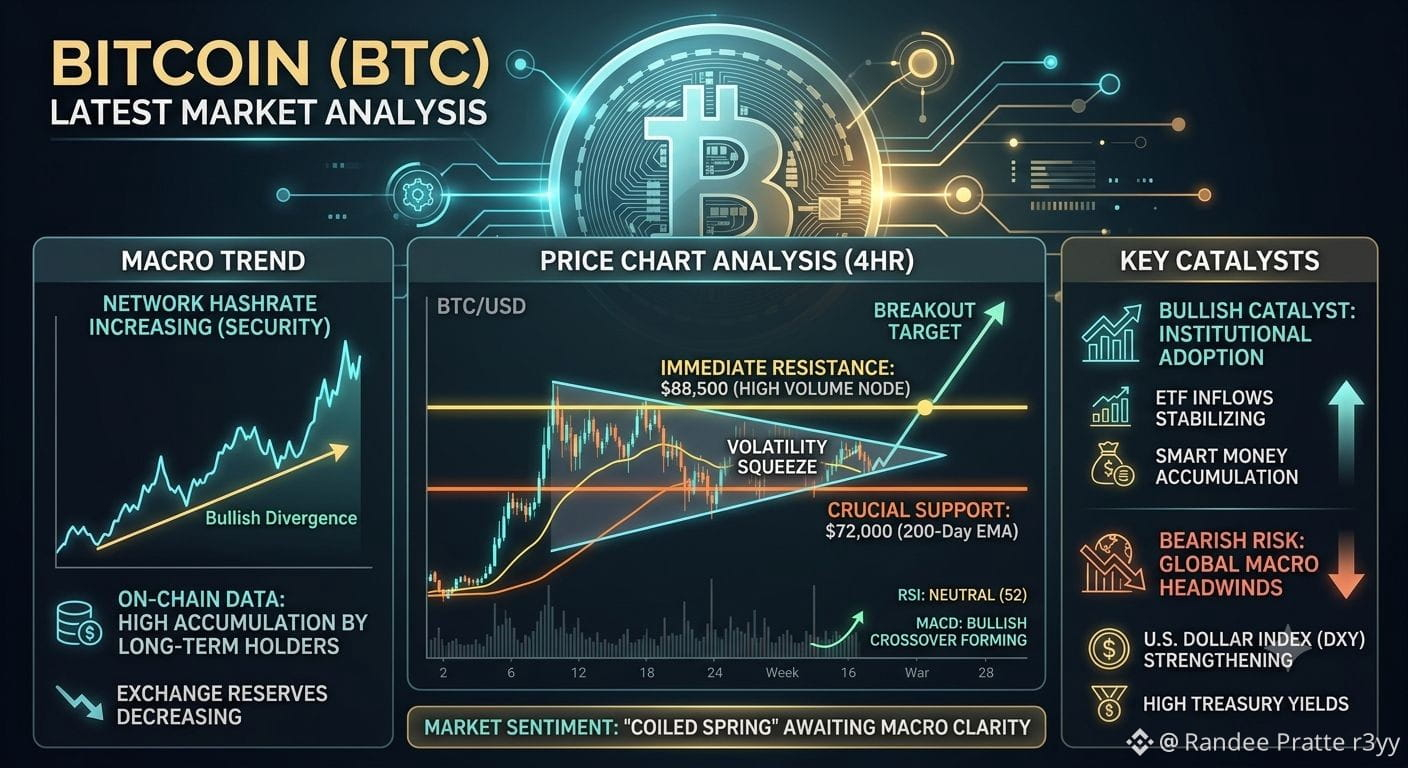
Here’s a quick chart visual:
Let me know if you want this broken down for short-term trading vs long-term hold, or a version focused on ETFs and institutional flows?
#ADPJobsSurge #OilRisesToHighestSinceJuly #USDestroysFiveIranianOilTankers #USStocksCloseLowerIntelRises9% #IranSaysItStruckTwoUSDestroyers
Latest Analysis — Sept 9, 2026
Current snapshot
- Price: $79,499.81
- 24h: +1.46% to $79,500 high
- August: +∼25% — best month in 21 months
- YTD: -11.72%, but only -7% vs S&P 500 +10% f7228196df0b
*What’s driving it*
1. Fed expectations: BTC rallied to $81,400 intraday after Fed Governor Waller signaled possible rate hold. But caution is back ahead of Sept 16 Fed decision — markets pricing 57% chance of hike. Lower rates = good for risk assets like BTC
2. Technical breakout: Broke downtrend of lower peaks since May. BTC vaulted above 21, 55, 100, 200-day MAs with a "golden cross" on 21-day
3. Flows: Bitcoin ETFs saw $1.01B net inflows in prior 3 trading days, including $730.8M on Sept 3. Strategy also bought 4,603 BTC at ∼$80,318 in late Aug df0be8847729a27328c1baf1
Key levels to watch
- Support: $75,674 Aug 23 low, then $71,781 halfway point of August rally. A break below opens $62,677 then $57,776
- Resistance: $82,793 May high = 61.8% Fibonacci retracement. Above that eyes $90,000 then $97,867 YTD peak a273
September outlook
Historically September averages -2.86% for BTC, and analysts flag risks from CPI data Sept 11, Fed meeting Sept 16, and geopolitical tensions. But if liquidity + institutional demand hold, BTC could consolidate its biggest recovery of 2026. 8196
Bottom line: BTC is catching its breath after a 30% surge. Bulls control above $71,781, but Fed + inflation data this week will decide if we retest $80K-$82K or slip back to $75K. a273
Here’s a quick chart visual:
Let me know if you want this broken down for short-term trading vs long-term hold, or a version focused on ETFs and institutional flows?
#ADPJobsSurge #OilRisesToHighestSinceJuly #USDestroysFiveIranianOilTankers #USStocksCloseLowerIntelRises9% #IranSaysItStruckTwoUSDestroyers