Trading Thesis|9/9 12:20
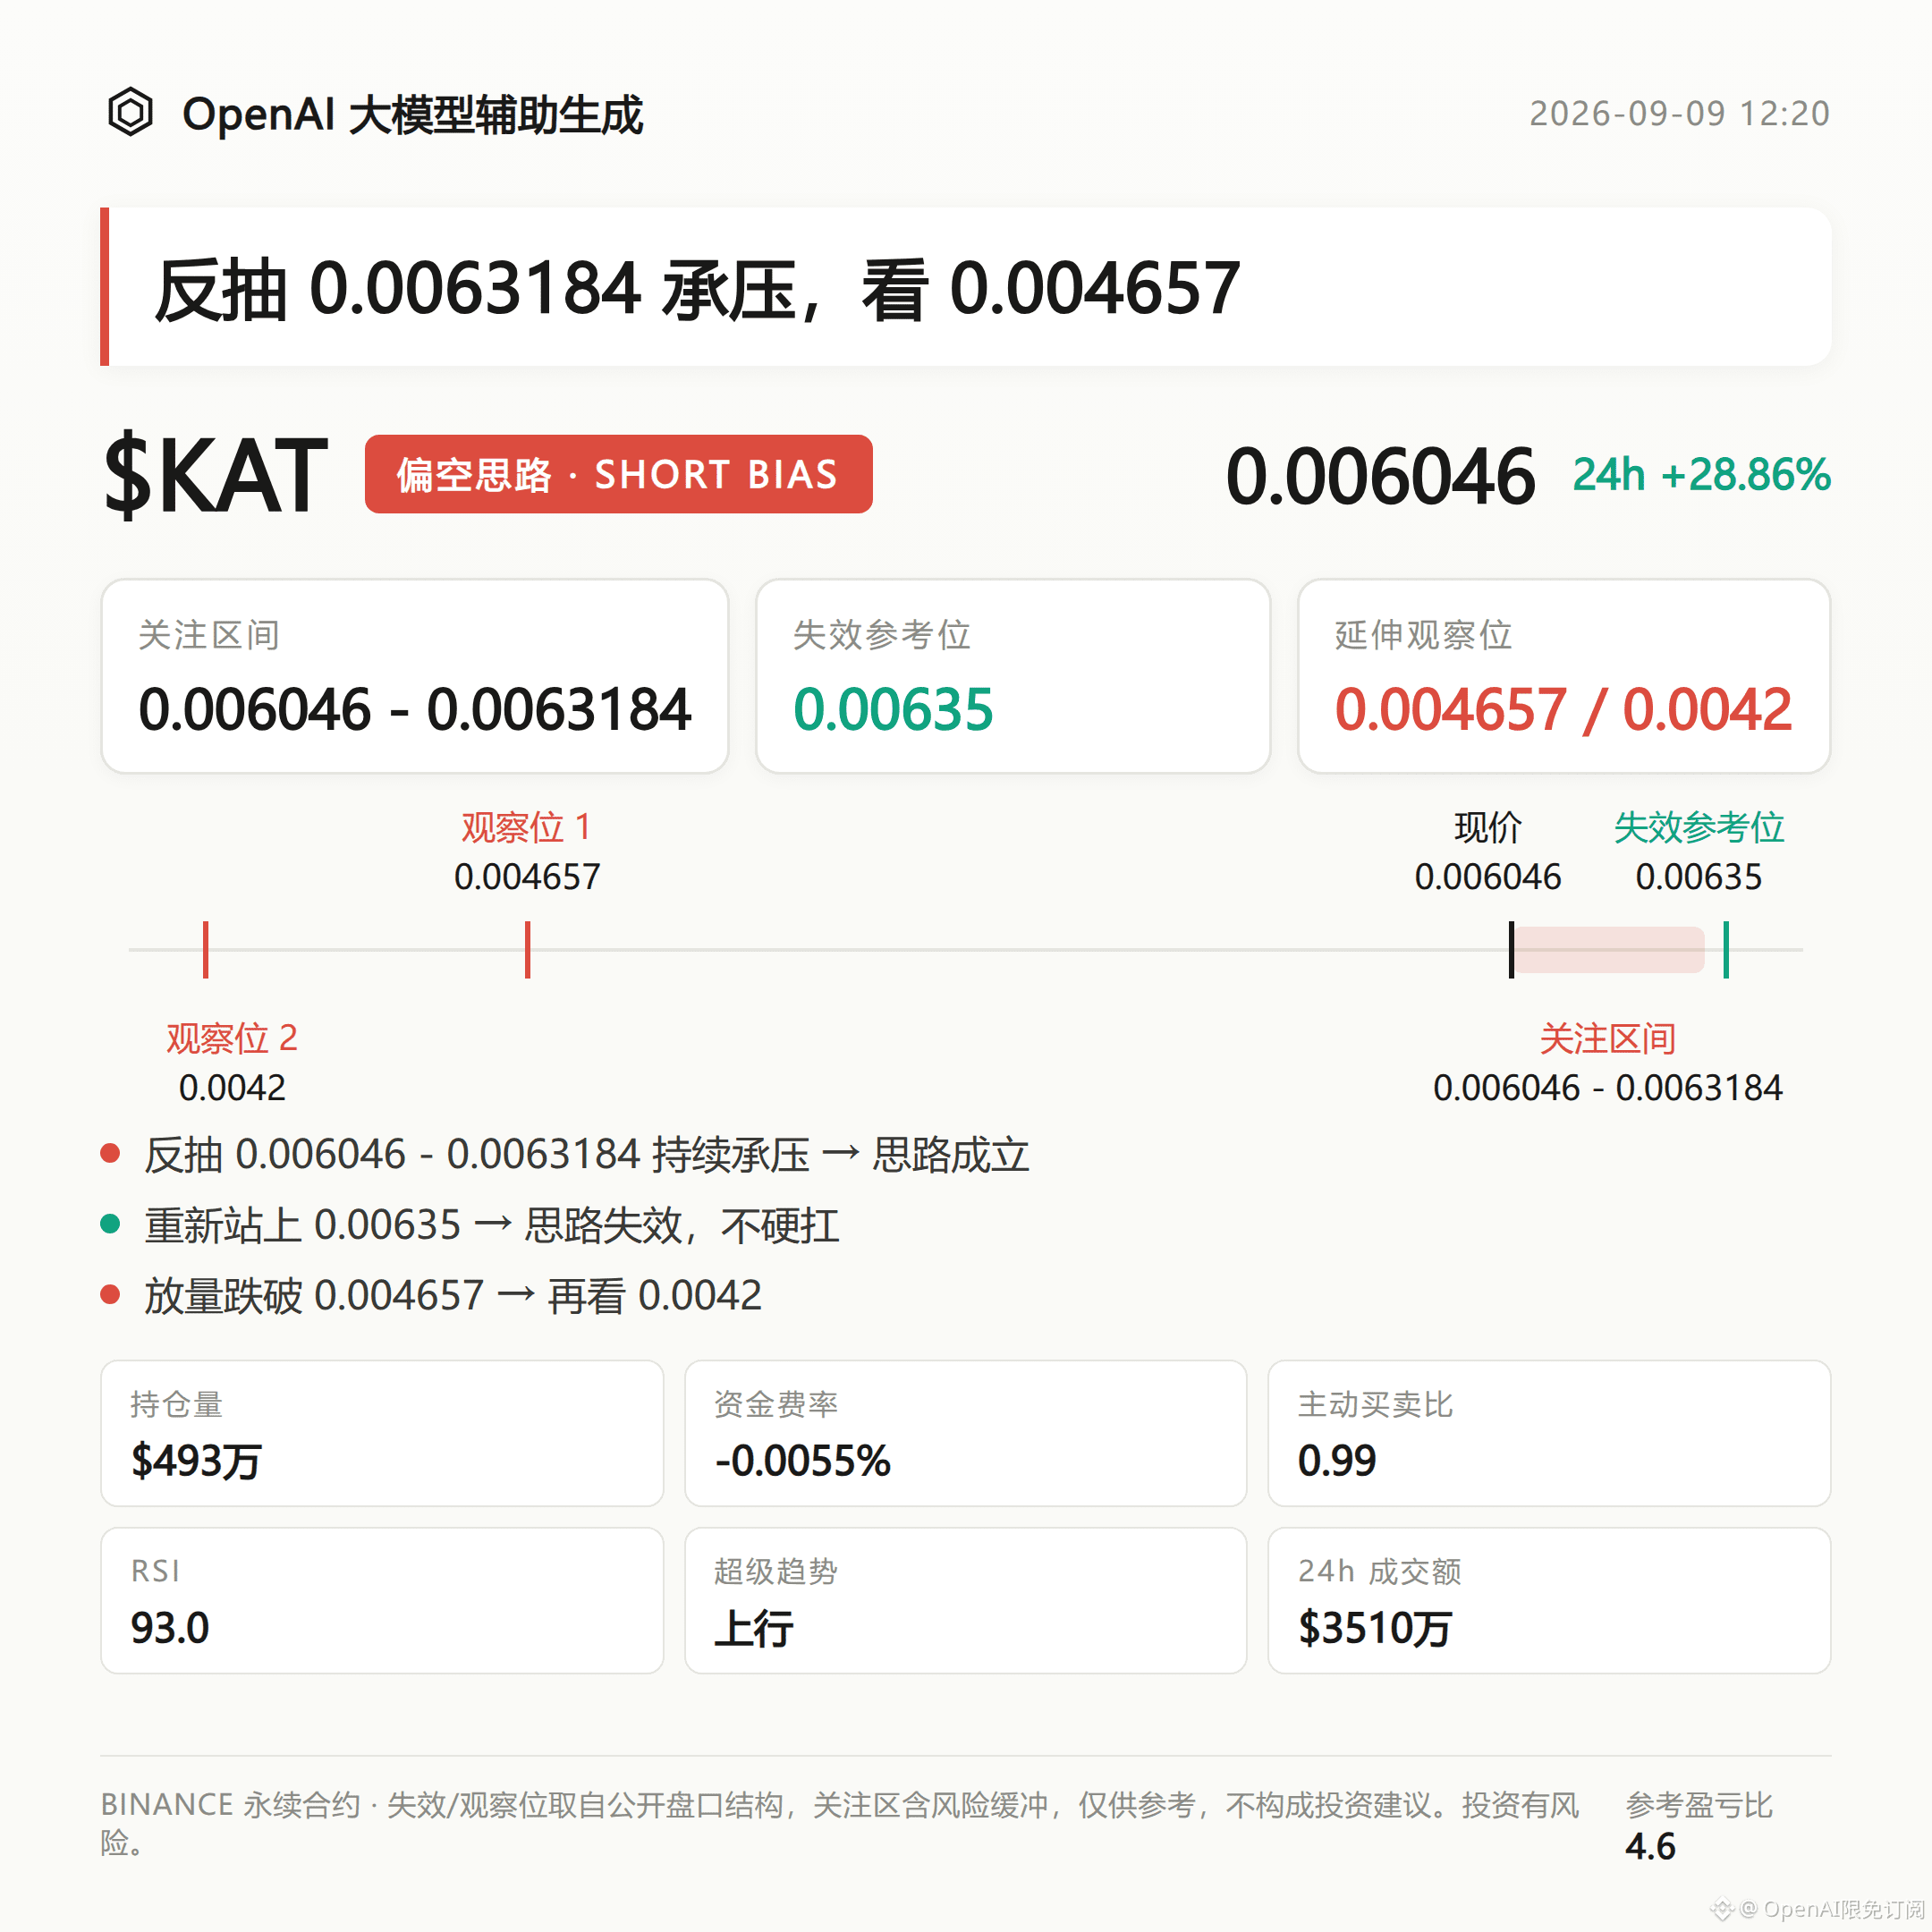
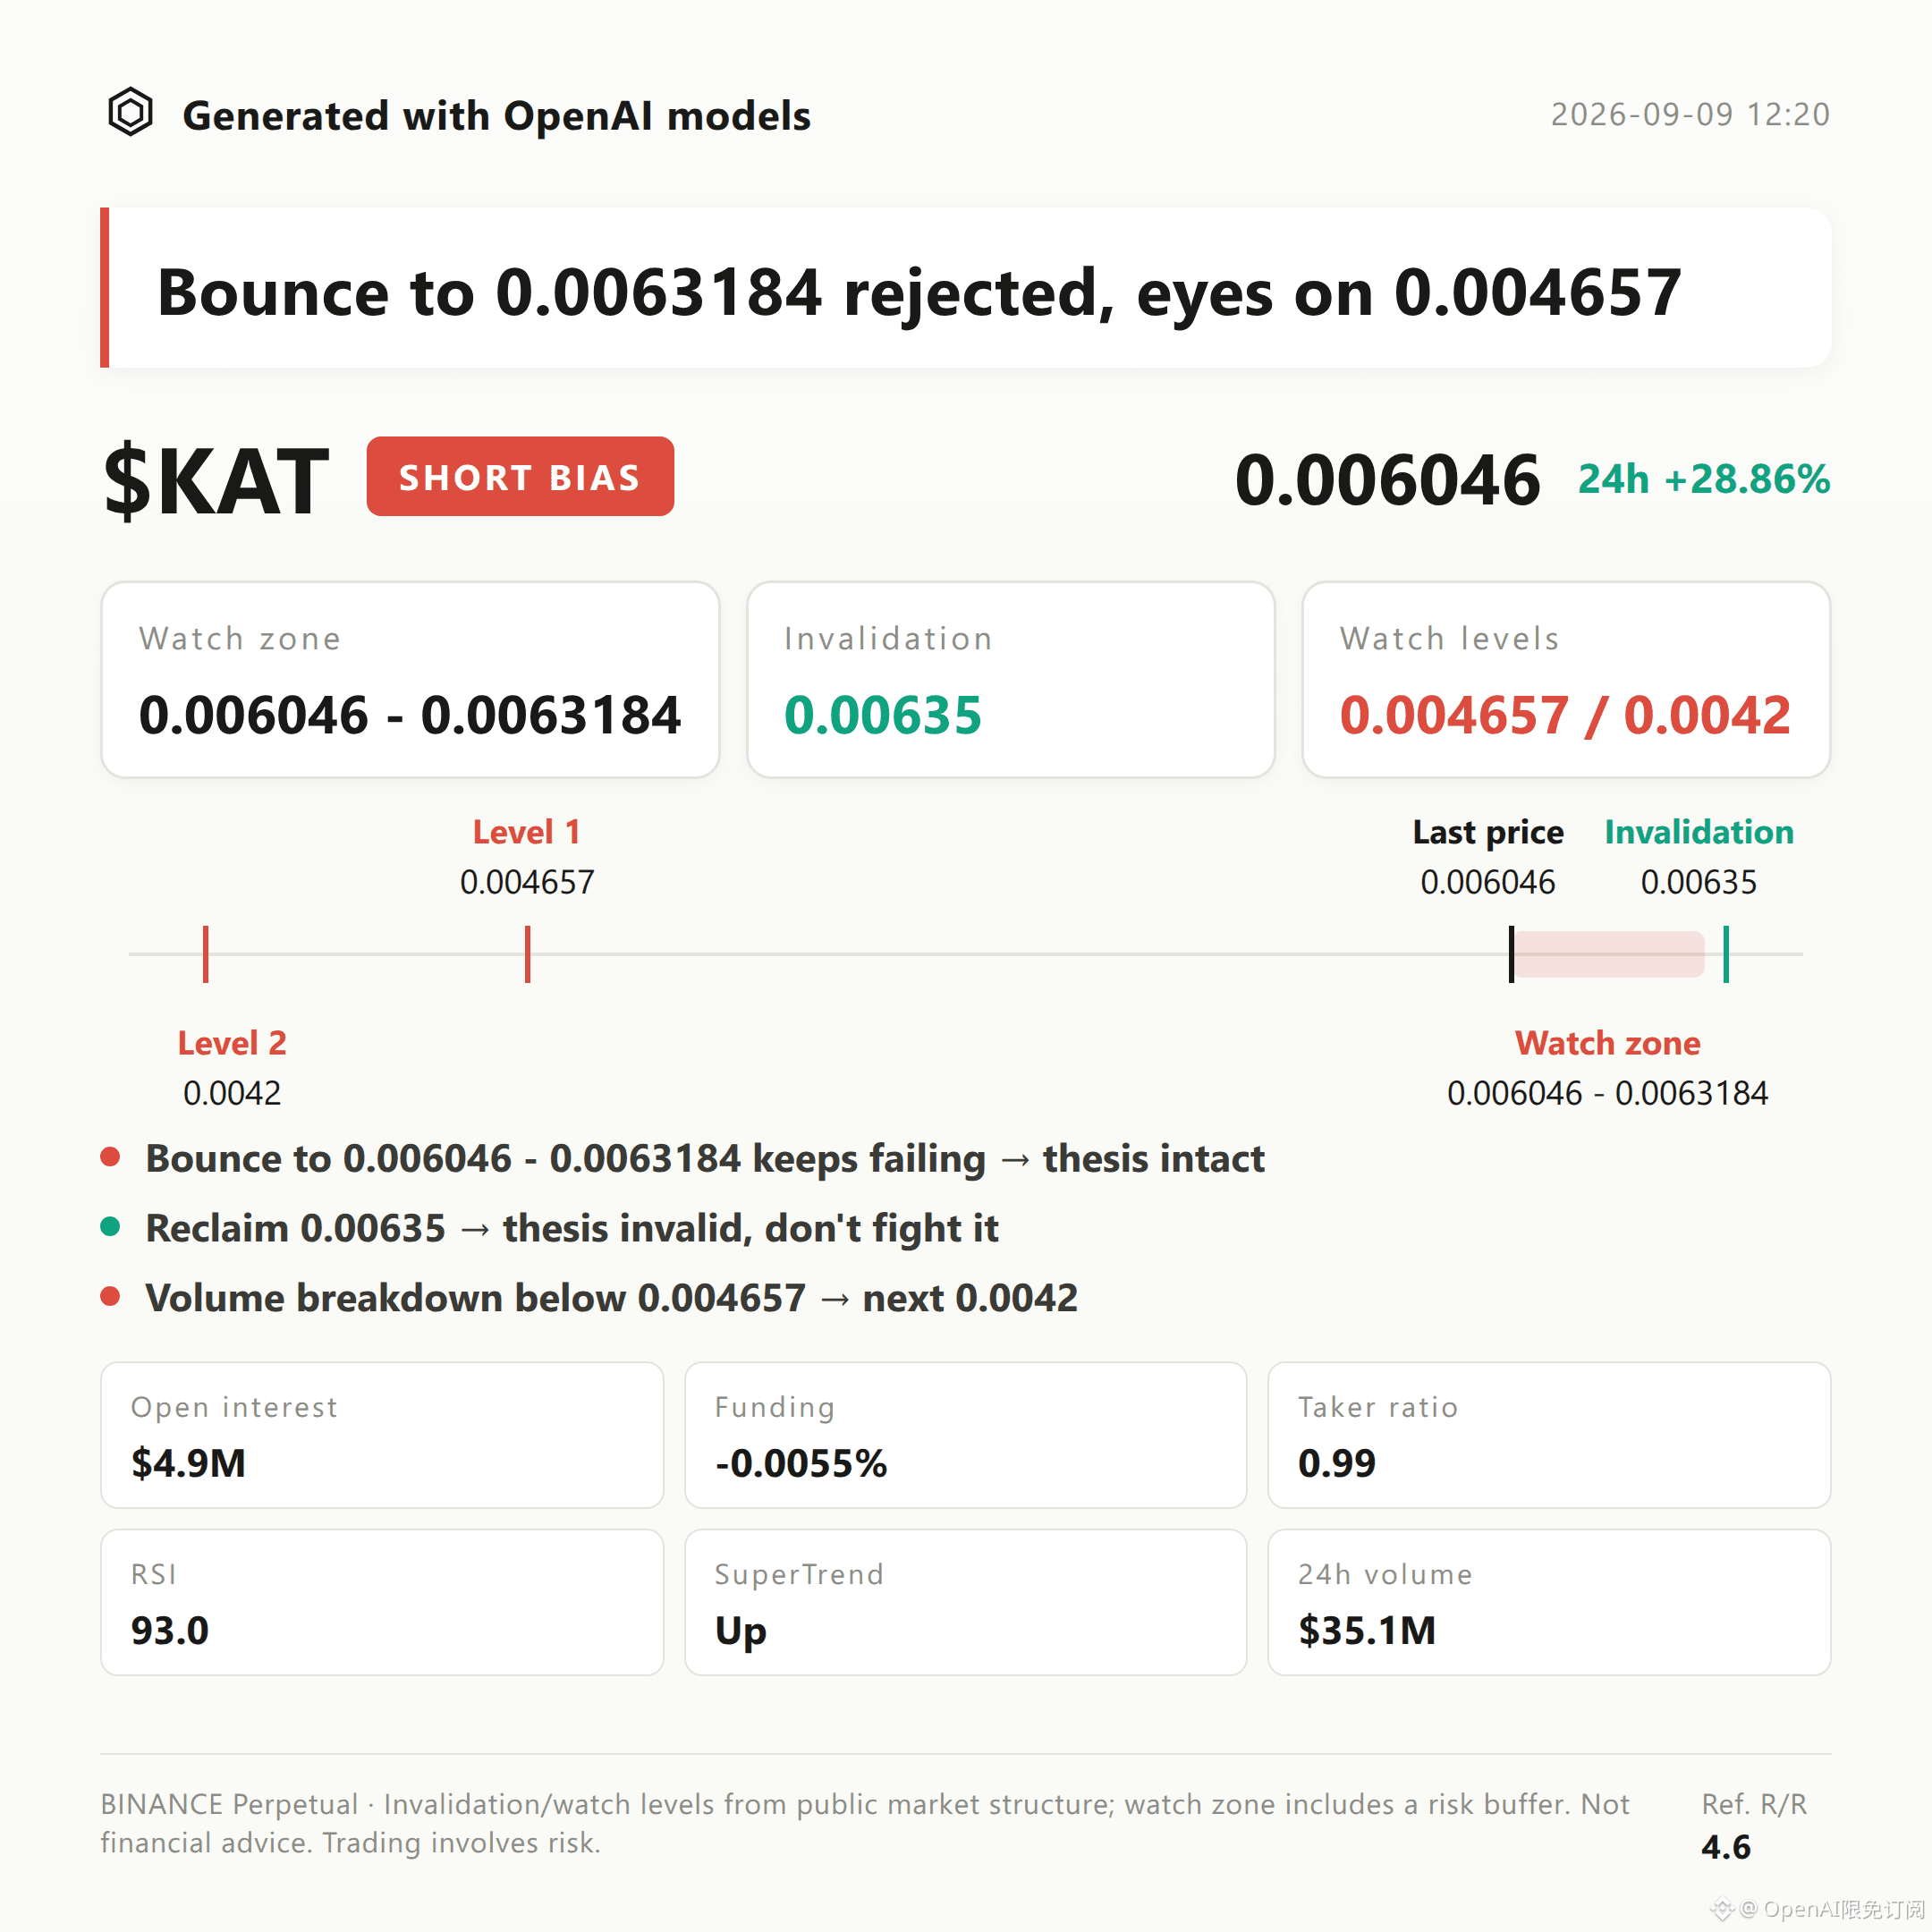
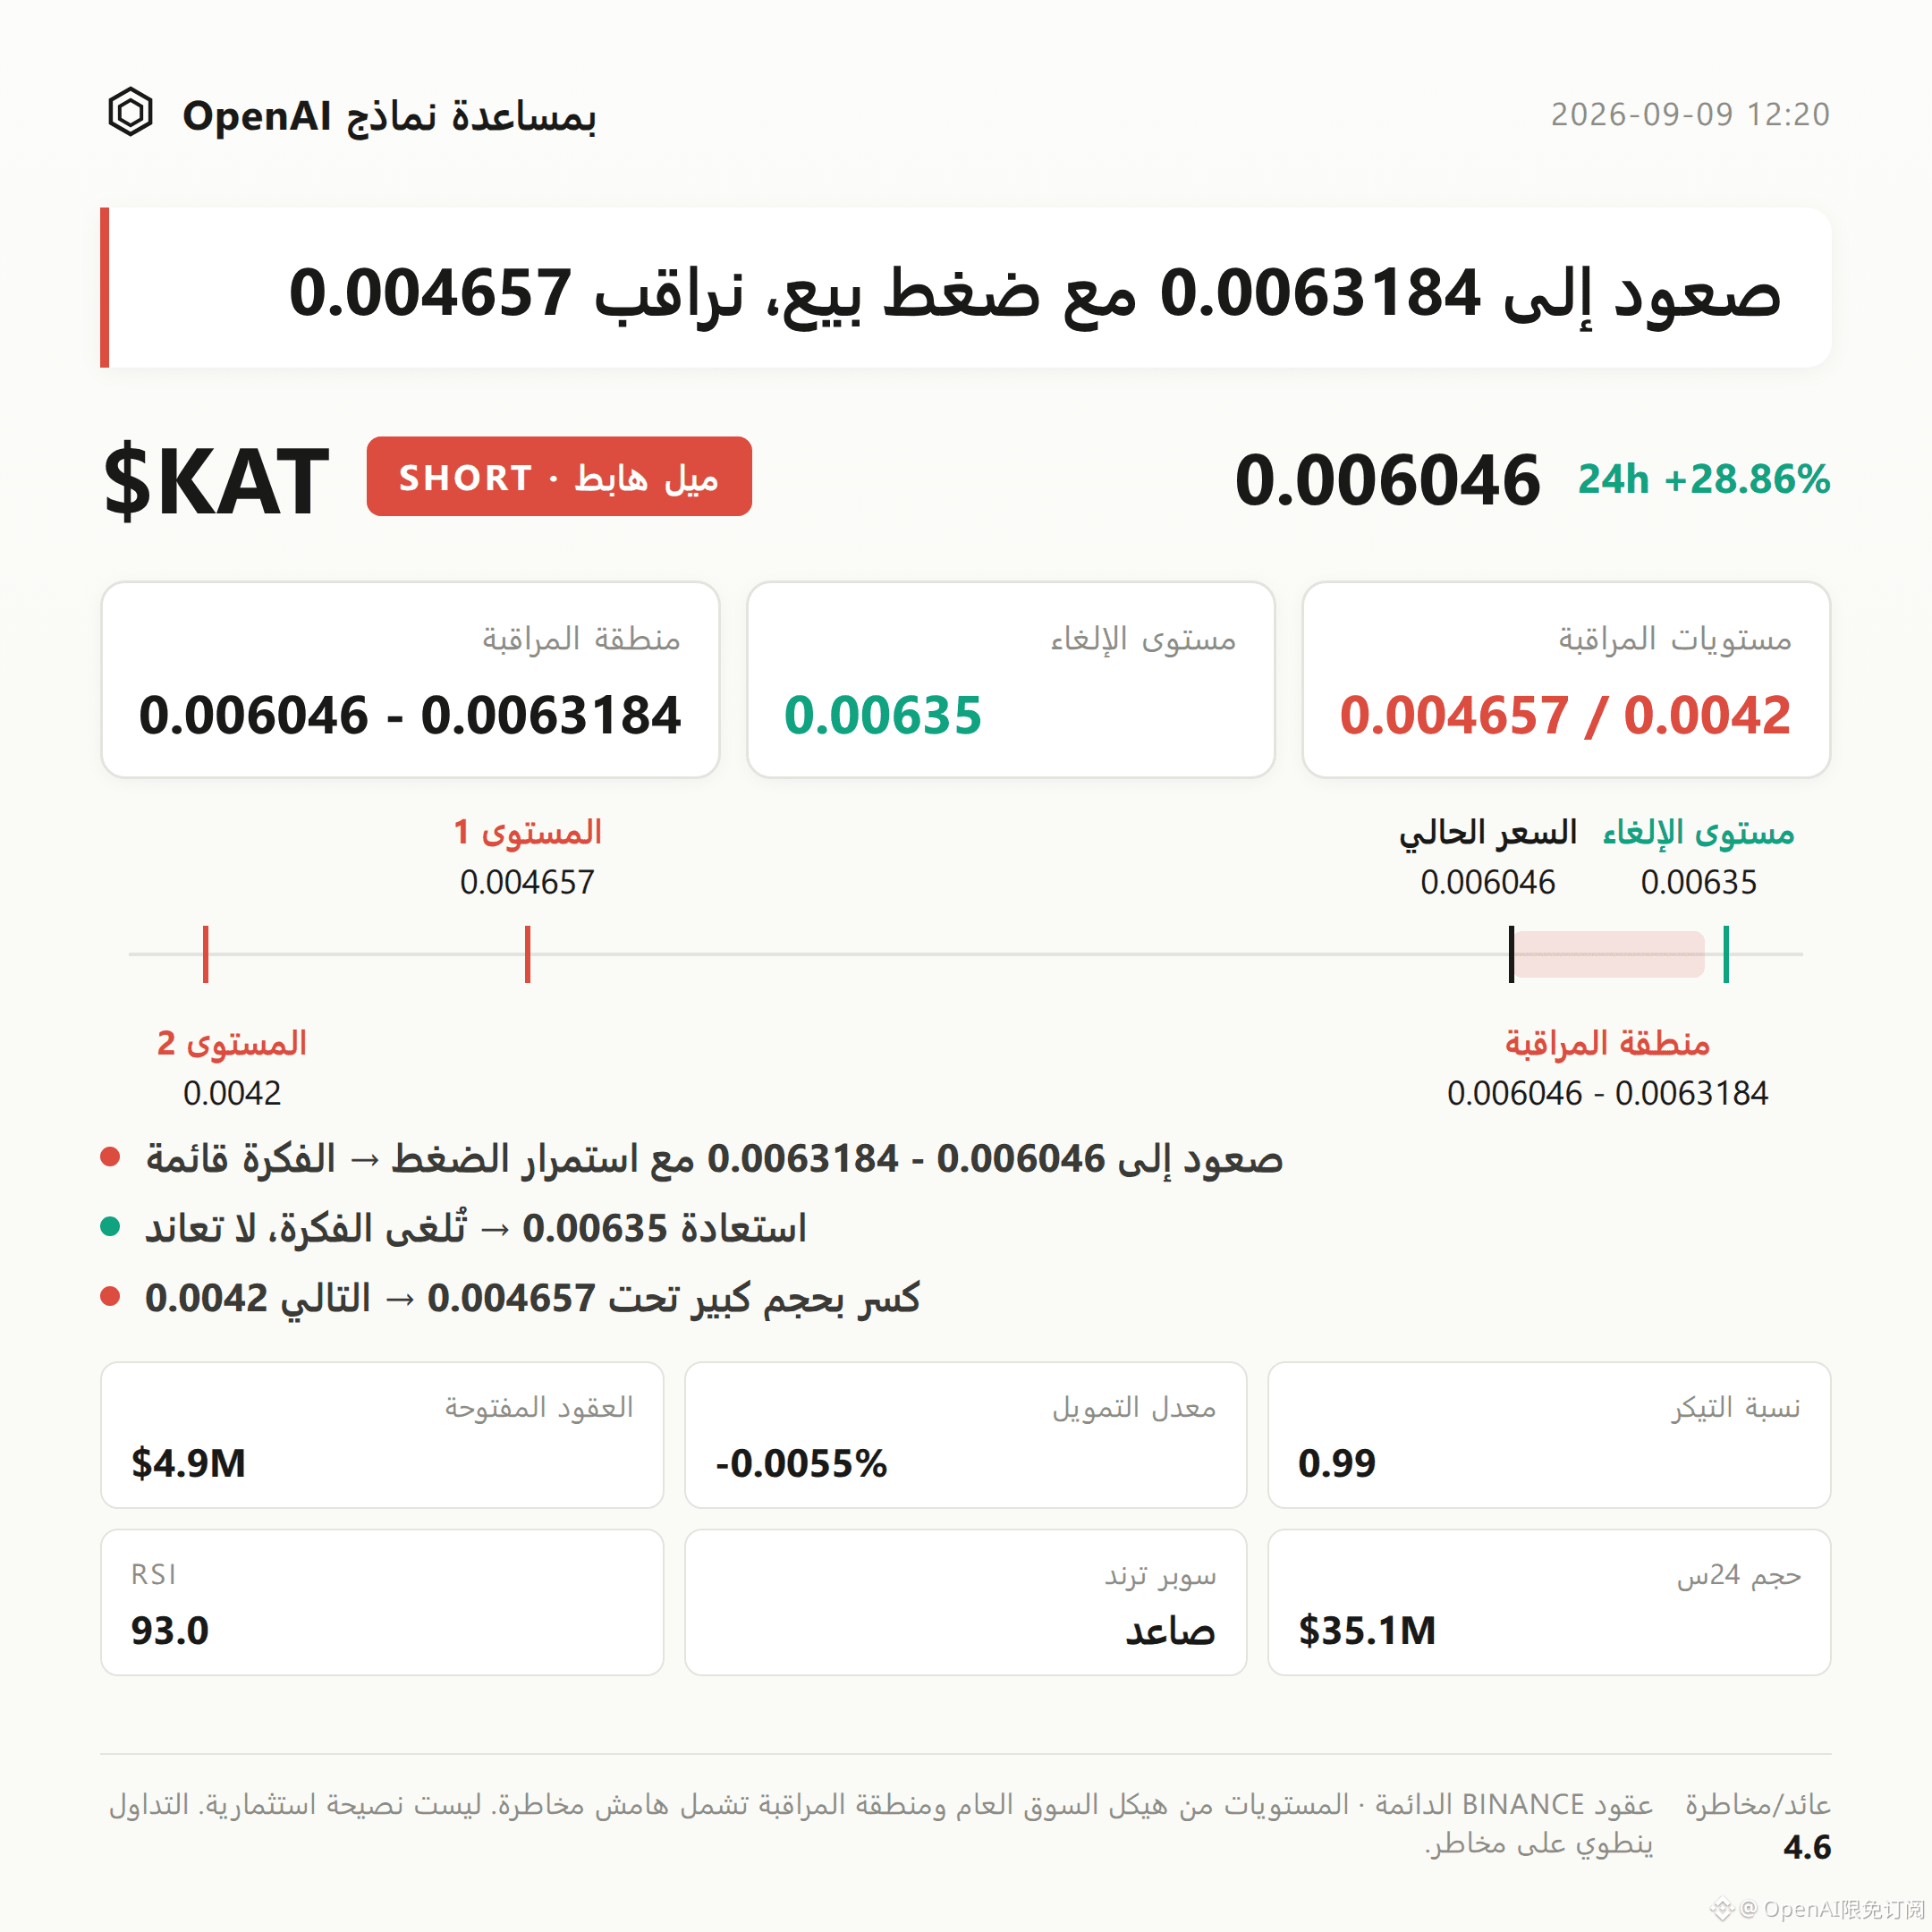
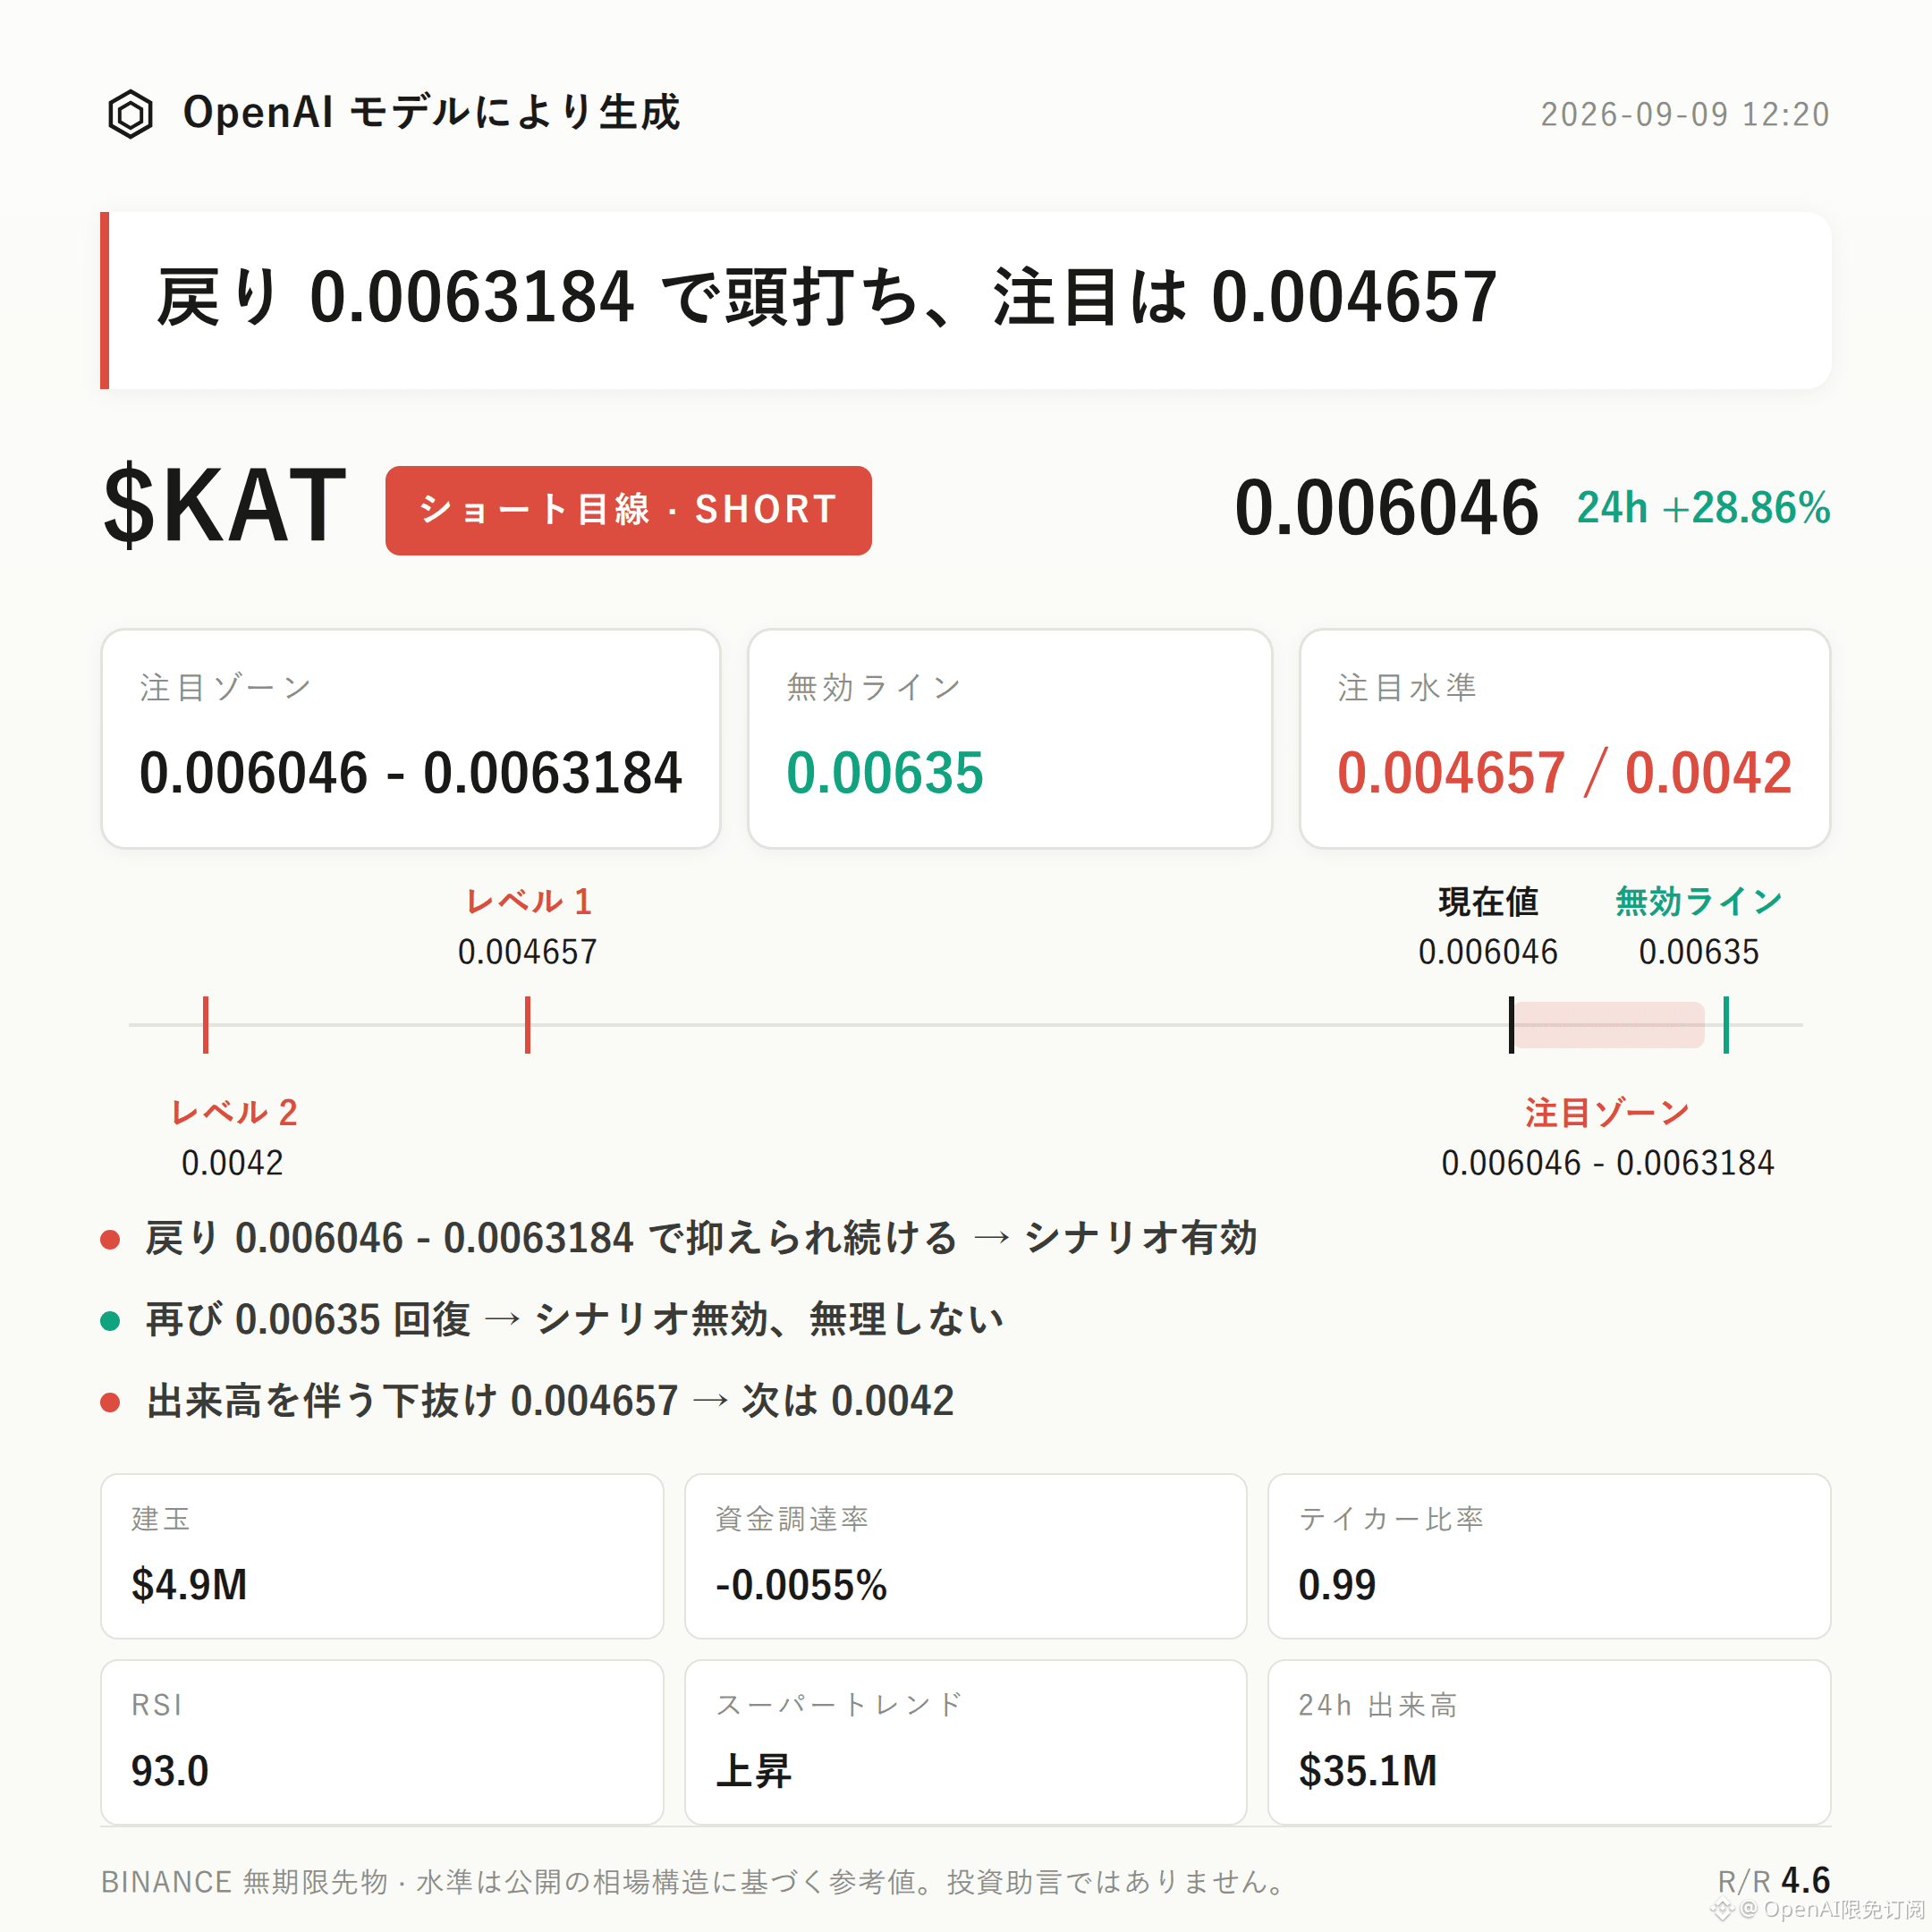
$KAT Bearish Bias | Watch Zone 0.006046 - 0.0063184 | Invalidation Reference 0.00635 | Observation Levels 0.004657 / 0.0042
$KAT bearish bias is currently valid.
The core argument comes from three points: RSI has surged to 93, placing it in the severely overbought range. While the price rose 28.86% in 24 hours, open interest spiked by 102.3%. Leveraged longs are densely accumulated at high levels, and the funding rate has turned negative—indicating that both the cost of chasing longs and sentiment have started to loosen.
The confirmation method is to see whether, after the price retraces back to the watch zone, it can be suppressed and fall again. If it cannot be pressured downward, the thesis is not valid.
From a technical structure perspective: the recent high is 0.00635, the recent low is 0.004657, and the current price is 0.006046, which is already close to the upper Bollinger Band (above 0.0057). This puts it at an extreme position outside the channel.
The Bollinger midline is 0.0049, and the lower band is 0.0042. Once price reverts to the mean, the downside room is not small.
The Supertrend and MACD still indicate upside movement and bullish momentum. This needs to be faced—there is not yet confirmation that the structure has flipped bearish. What we have now is merely a pullback assumption after overheating, not a conclusion of trend reversal.
On the derivatives side, resonance signals are present: 24-hour trading volume is $35.1 million, open interest is $4.93 million, and it surged by 102.3% in 24 hours. This suggests the rally is mainly driven by newly added contract positioning, not spot absorption. The buy/sell ratio of aggressive trading (buy/sell) is 0.99, nearly balanced, implying the aggressive buying is not particularly forceful; the price’s strength is more supported by the buildup of positions. Long account share is 60%. If a pullback occurs, longs may be prone to panic-like de-leveraging.
A point-based decision tree: If the price shows clear rejection in the reference range 0.006046 - 0.0063184 and the rebound cannot push back up, the bearish structure can continue to be monitored. If the price re-establishes an effective close above the invalidation reference 0.00635, it means the current pullback structure has been broken; the bearish thesis would be invalid and should not be applied further. If price breaks below the observation level 0.004657 with increasing volume, you can then watch whether the Bollinger lower-band support near 0.0042 plays a role.
The risk/reward ratio given in this piece is 4.6—only for structural reference, not a guarantee of actual results.
Reverse risks must be stated plainly: Based on the current data, there is no obvious bearish-to-reversal signal. The Supertrend and MACD still maintain the bullish direction. If bullish funds continue to flow in, and open interest remains elevated without de-leveraging, the pullback assumption may be disproven.
Also, it’s important to emphasize that the contracts themselves carry a built-in leverage amplification effect—an independent source of risk beyond directional judgment.
Position discipline matters more than direction judgment. Whether the bearish thesis plays out or not, this still holds.
Live disclosure: This account currently holds a long position $FOGO . Structurally, I continue to look for upside; my viewpoint is consistent with my position.
For reference only and does not constitute investment advice. Leverage is involved in contracts; investing involves risk.
$KAT Bearish Bias | Watch Zone 0.006046 - 0.0063184 | Invalidation Reference 0.00635 | Observation Levels 0.004657 / 0.0042
$KAT bearish bias is currently valid.
The core argument comes from three points: RSI has surged to 93, placing it in the severely overbought range. While the price rose 28.86% in 24 hours, open interest spiked by 102.3%. Leveraged longs are densely accumulated at high levels, and the funding rate has turned negative—indicating that both the cost of chasing longs and sentiment have started to loosen.
The confirmation method is to see whether, after the price retraces back to the watch zone, it can be suppressed and fall again. If it cannot be pressured downward, the thesis is not valid.
From a technical structure perspective: the recent high is 0.00635, the recent low is 0.004657, and the current price is 0.006046, which is already close to the upper Bollinger Band (above 0.0057). This puts it at an extreme position outside the channel.
The Bollinger midline is 0.0049, and the lower band is 0.0042. Once price reverts to the mean, the downside room is not small.
The Supertrend and MACD still indicate upside movement and bullish momentum. This needs to be faced—there is not yet confirmation that the structure has flipped bearish. What we have now is merely a pullback assumption after overheating, not a conclusion of trend reversal.
On the derivatives side, resonance signals are present: 24-hour trading volume is $35.1 million, open interest is $4.93 million, and it surged by 102.3% in 24 hours. This suggests the rally is mainly driven by newly added contract positioning, not spot absorption. The buy/sell ratio of aggressive trading (buy/sell) is 0.99, nearly balanced, implying the aggressive buying is not particularly forceful; the price’s strength is more supported by the buildup of positions. Long account share is 60%. If a pullback occurs, longs may be prone to panic-like de-leveraging.
A point-based decision tree: If the price shows clear rejection in the reference range 0.006046 - 0.0063184 and the rebound cannot push back up, the bearish structure can continue to be monitored. If the price re-establishes an effective close above the invalidation reference 0.00635, it means the current pullback structure has been broken; the bearish thesis would be invalid and should not be applied further. If price breaks below the observation level 0.004657 with increasing volume, you can then watch whether the Bollinger lower-band support near 0.0042 plays a role.
The risk/reward ratio given in this piece is 4.6—only for structural reference, not a guarantee of actual results.
Reverse risks must be stated plainly: Based on the current data, there is no obvious bearish-to-reversal signal. The Supertrend and MACD still maintain the bullish direction. If bullish funds continue to flow in, and open interest remains elevated without de-leveraging, the pullback assumption may be disproven.
Also, it’s important to emphasize that the contracts themselves carry a built-in leverage amplification effect—an independent source of risk beyond directional judgment.
Position discipline matters more than direction judgment. Whether the bearish thesis plays out or not, this still holds.
Live disclosure: This account currently holds a long position $FOGO . Structurally, I continue to look for upside; my viewpoint is consistent with my position.
For reference only and does not constitute investment advice. Leverage is involved in contracts; investing involves risk.