$EWY / $KORU 4 hours and the daily chart are both already going long; multi-period resonance is pointing upward 🔥
════════════════════
🔴 $EWY 4 hours Long signal
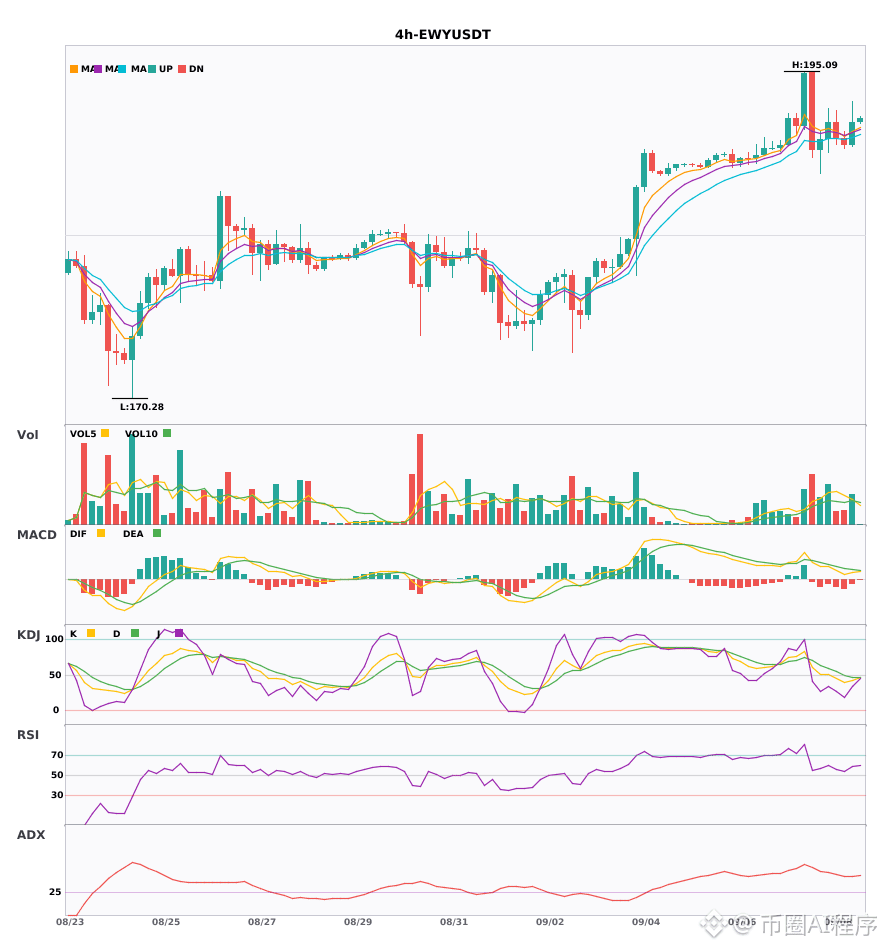
⚠️ Technical analysis: The 4-hour EMA5 has just crossed above EMA8. The short-term moving averages have only just formed a bullish alignment, and the daily chart is also bullish. Two-cycle resonance is pointing upward! However, the KDJ is still relatively weak: the K value is 42.6, below the D value of 47.2—there’s no golden cross yet. Volume at 1.2x is normal. Suggest testing with a light position.
════════════════════
🔴 $KORU 4 hours Long signal
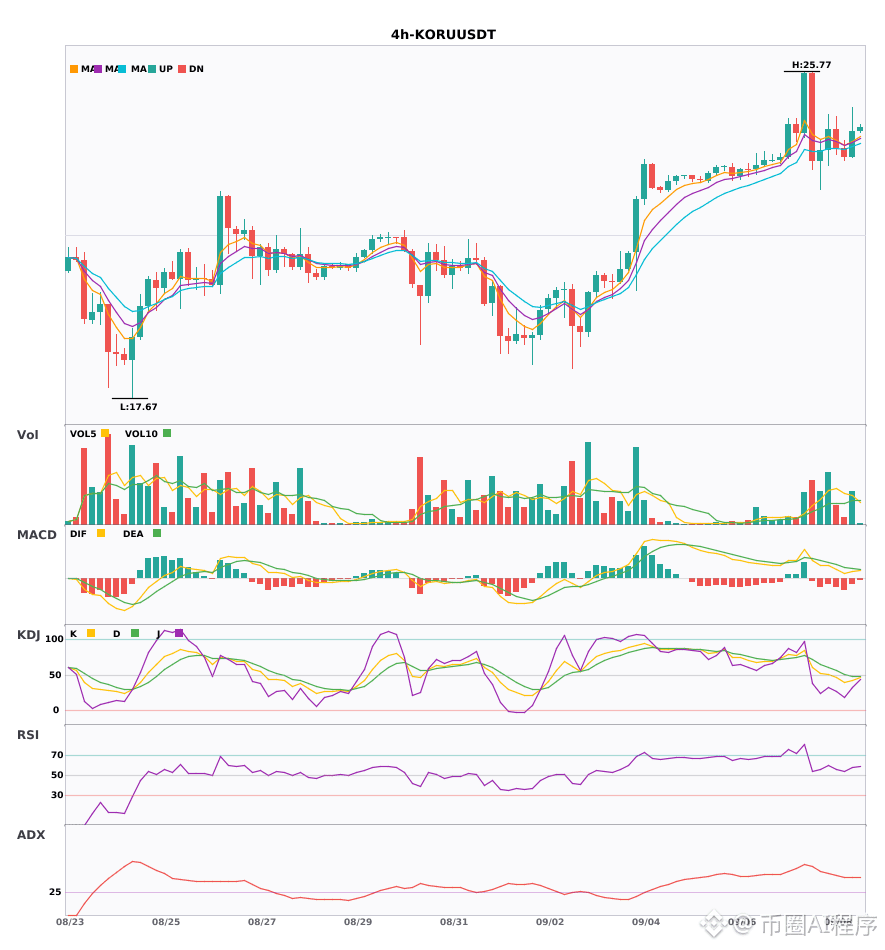
⚠️ Technical analysis: The overall direction of the daily chart is bullish, and the 4-hour chart has just issued a signal as well: EMA5 has crossed above EMA8. The short-term moving averages have just formed a bullish alignment, and the two cycles are resonating in the same direction. However, the KDJ is still weak: the K value is 42.8, below the D value of 47.9—bearish bias is temporarily stronger. Volume at 1.4x is normal. You can first test with a small position.
════════════════════
🔔 Watch for immediate live-market anomalies 🔔
#多周期共振 #EWY #KORU
📌 When trading, pay attention to whether the candlestick pattern matches
════════════════════
🔴 $EWY 4 hours Long signal
⚠️ Technical analysis: The 4-hour EMA5 has just crossed above EMA8. The short-term moving averages have only just formed a bullish alignment, and the daily chart is also bullish. Two-cycle resonance is pointing upward! However, the KDJ is still relatively weak: the K value is 42.6, below the D value of 47.2—there’s no golden cross yet. Volume at 1.2x is normal. Suggest testing with a light position.
════════════════════
🔴 $KORU 4 hours Long signal
⚠️ Technical analysis: The overall direction of the daily chart is bullish, and the 4-hour chart has just issued a signal as well: EMA5 has crossed above EMA8. The short-term moving averages have just formed a bullish alignment, and the two cycles are resonating in the same direction. However, the KDJ is still weak: the K value is 42.8, below the D value of 47.9—bearish bias is temporarily stronger. Volume at 1.4x is normal. You can first test with a small position.
════════════════════
🔔 Watch for immediate live-market anomalies 🔔
#多周期共振 #EWY #KORU
📌 When trading, pay attention to whether the candlestick pattern matches