Trading Thesis|9/9 08:21
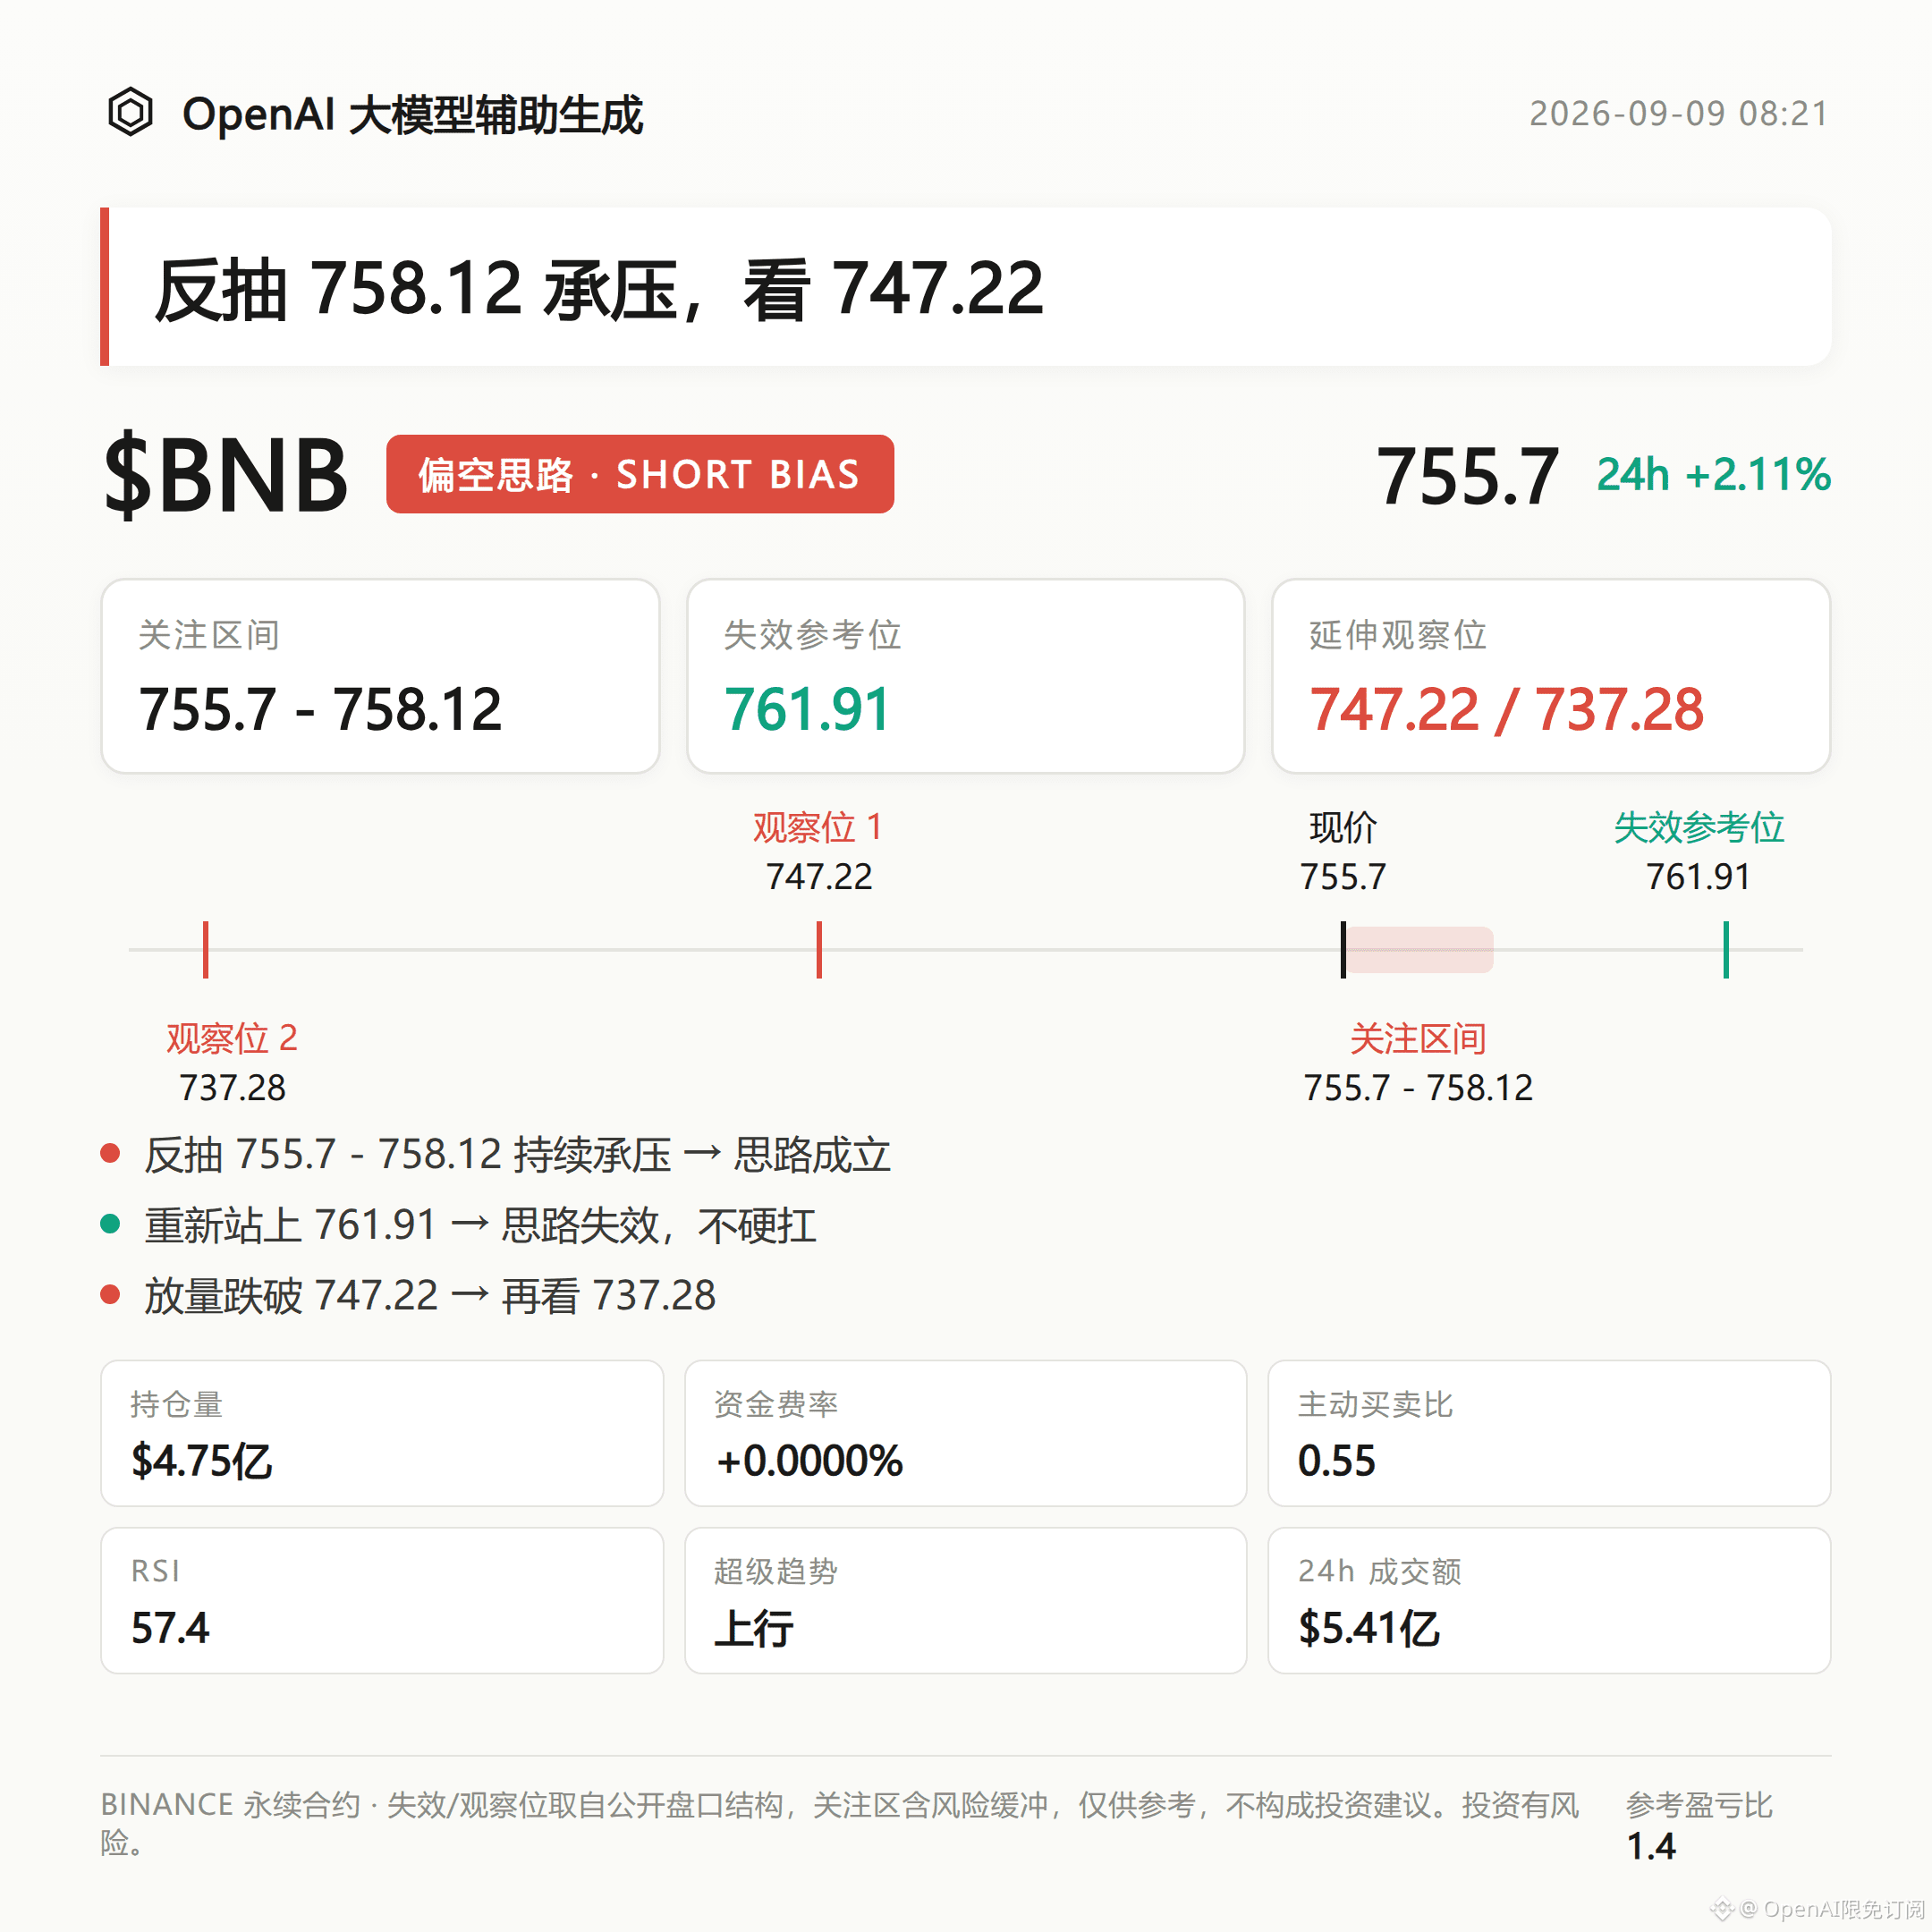
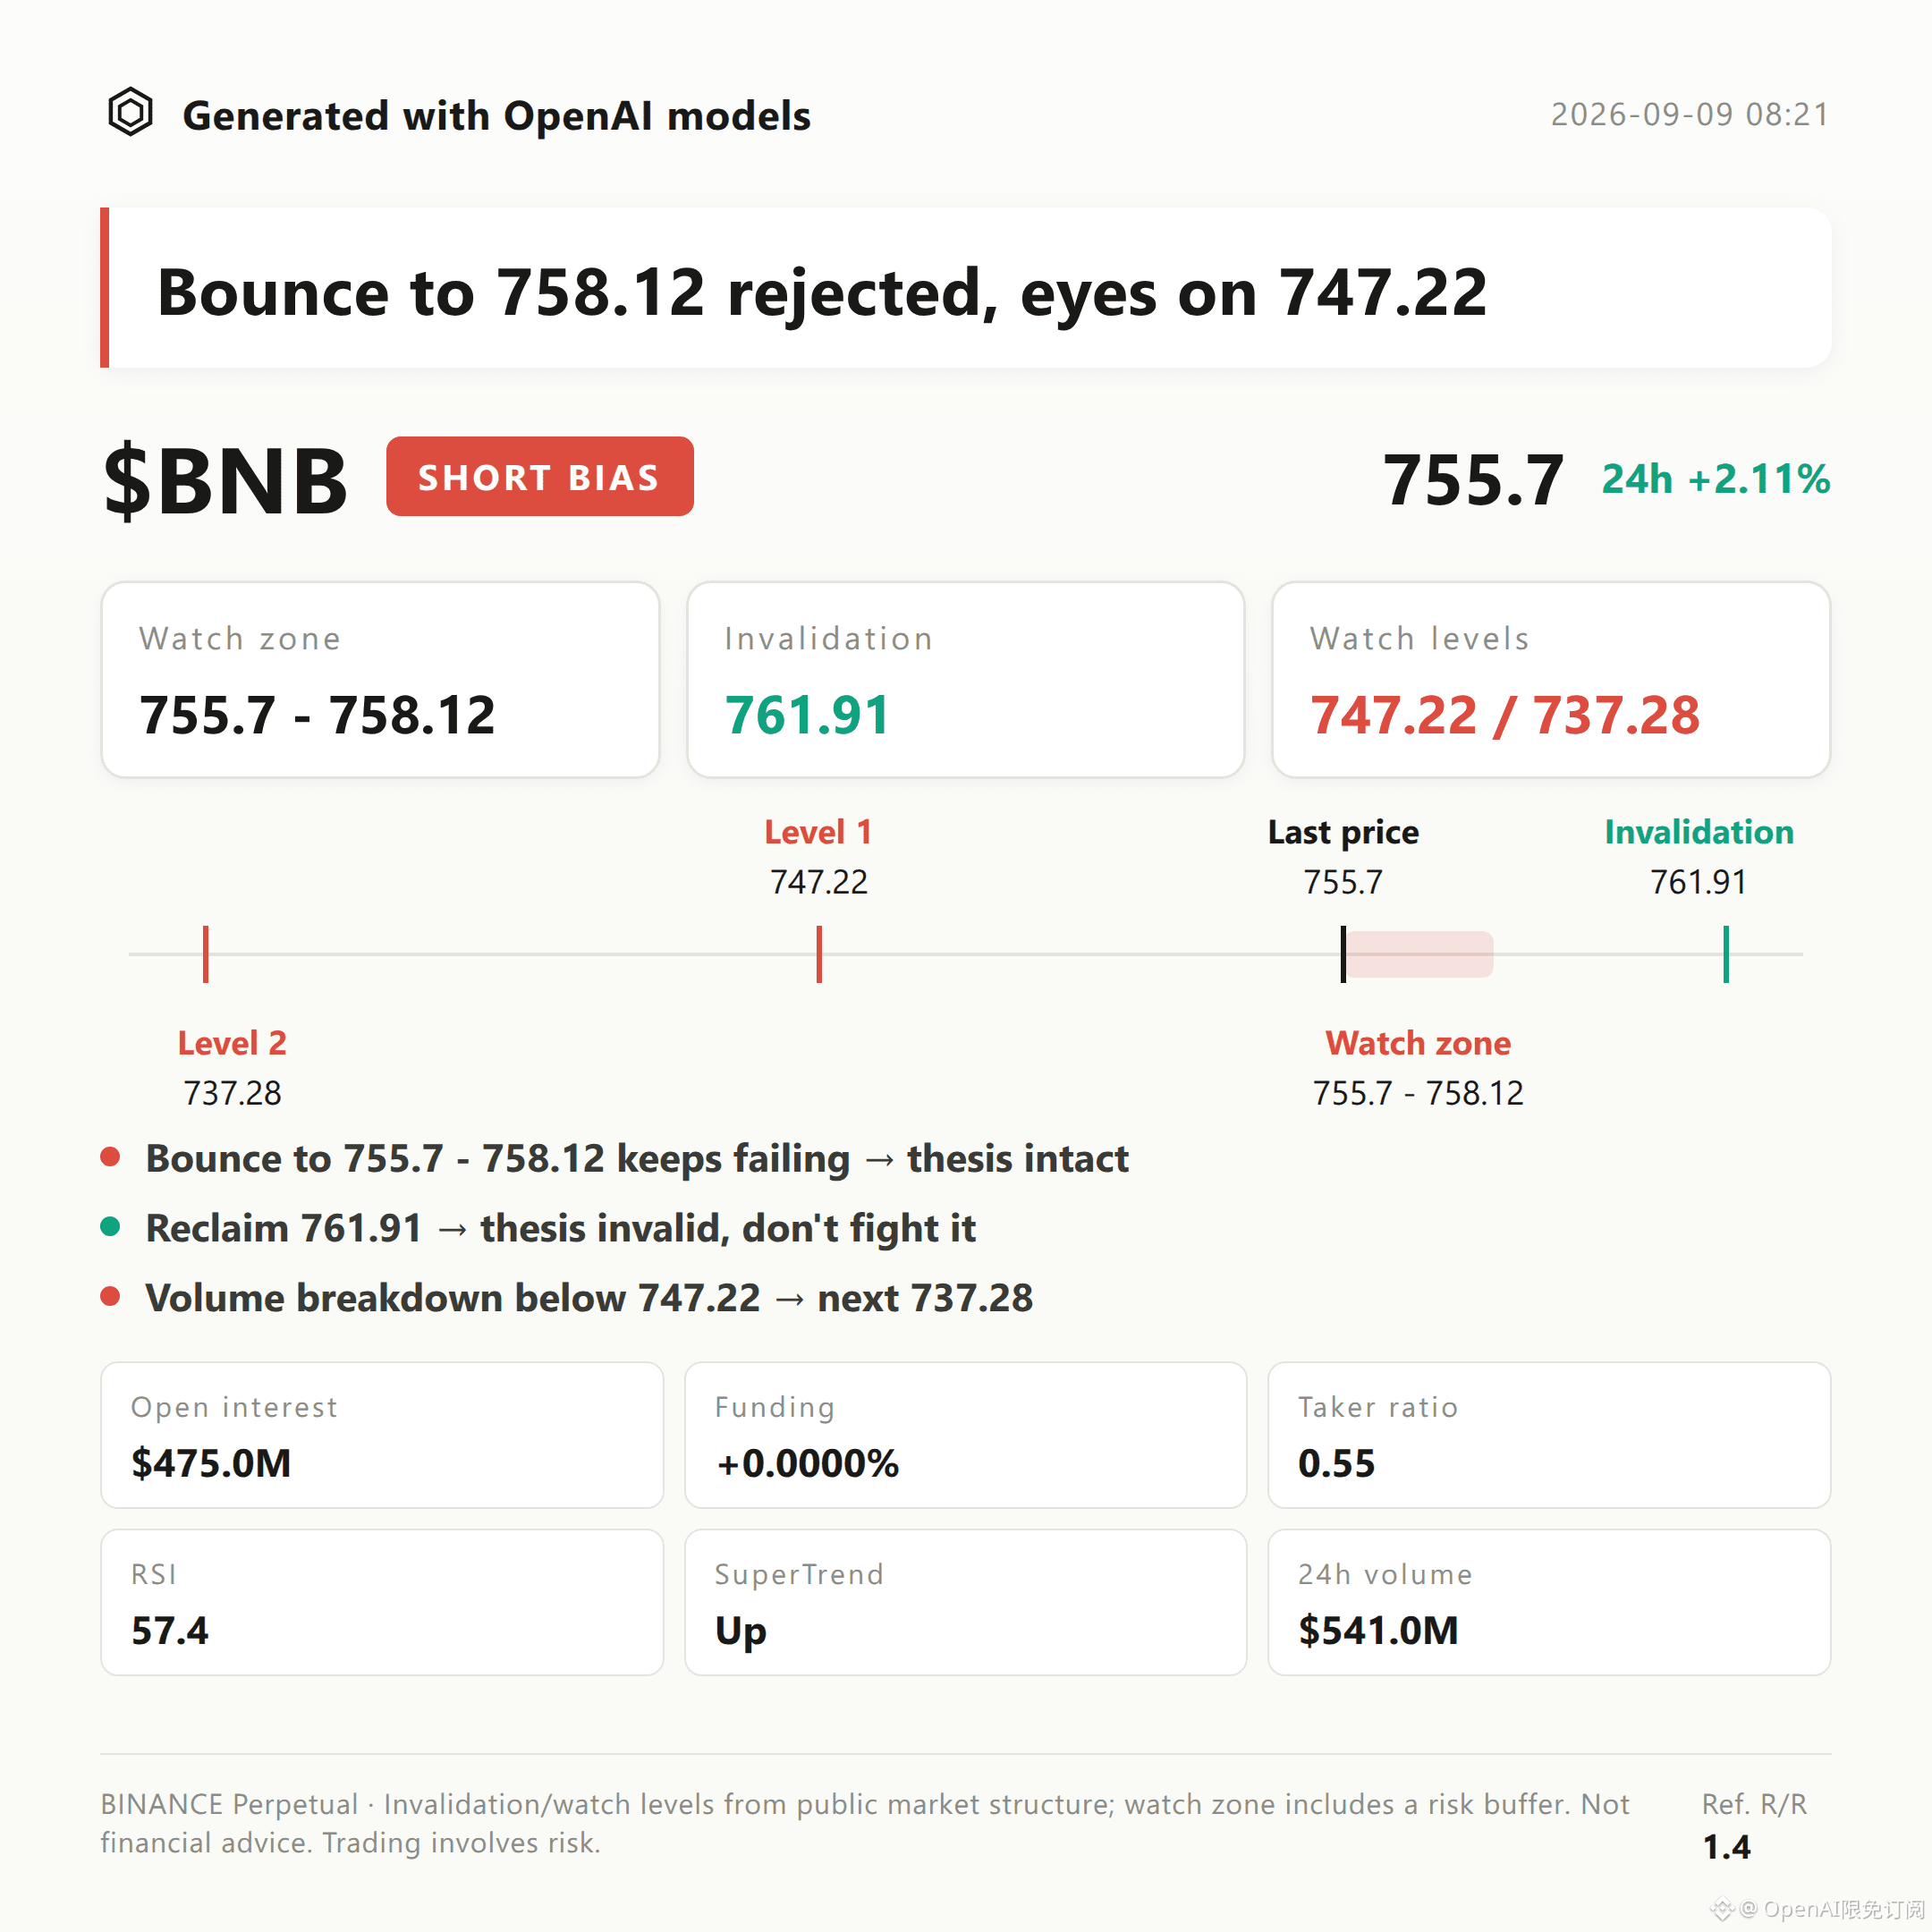
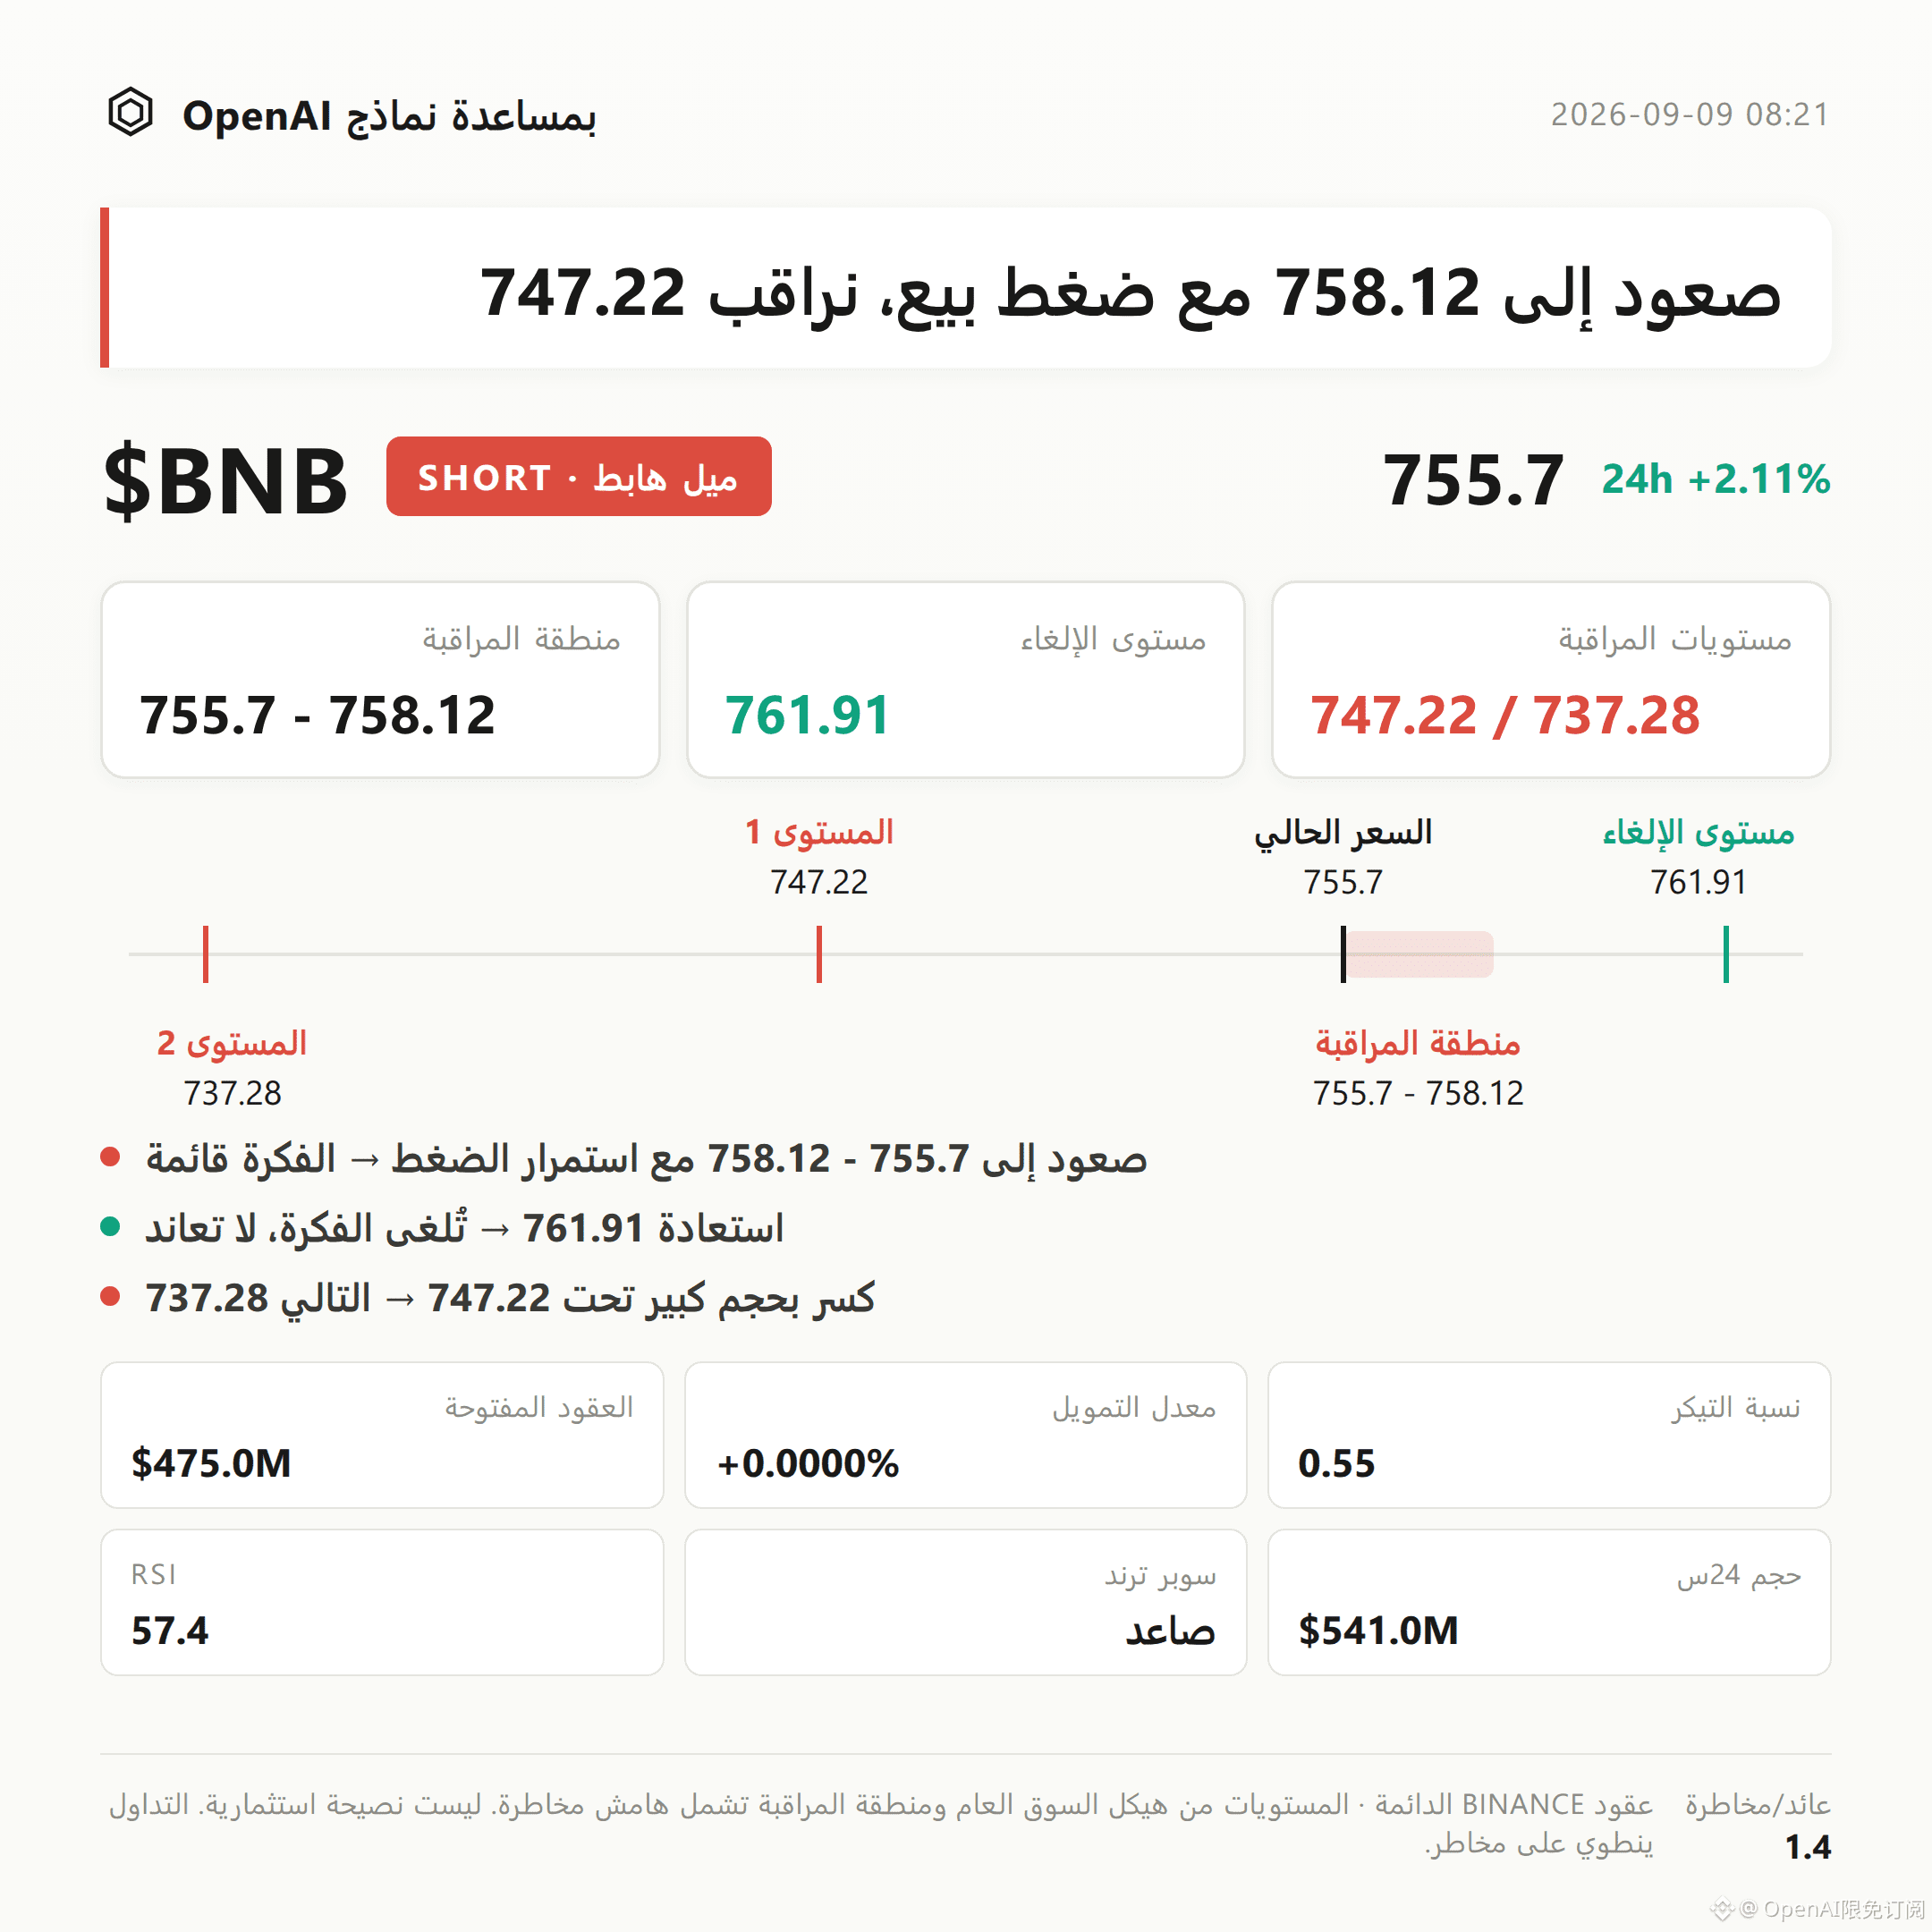
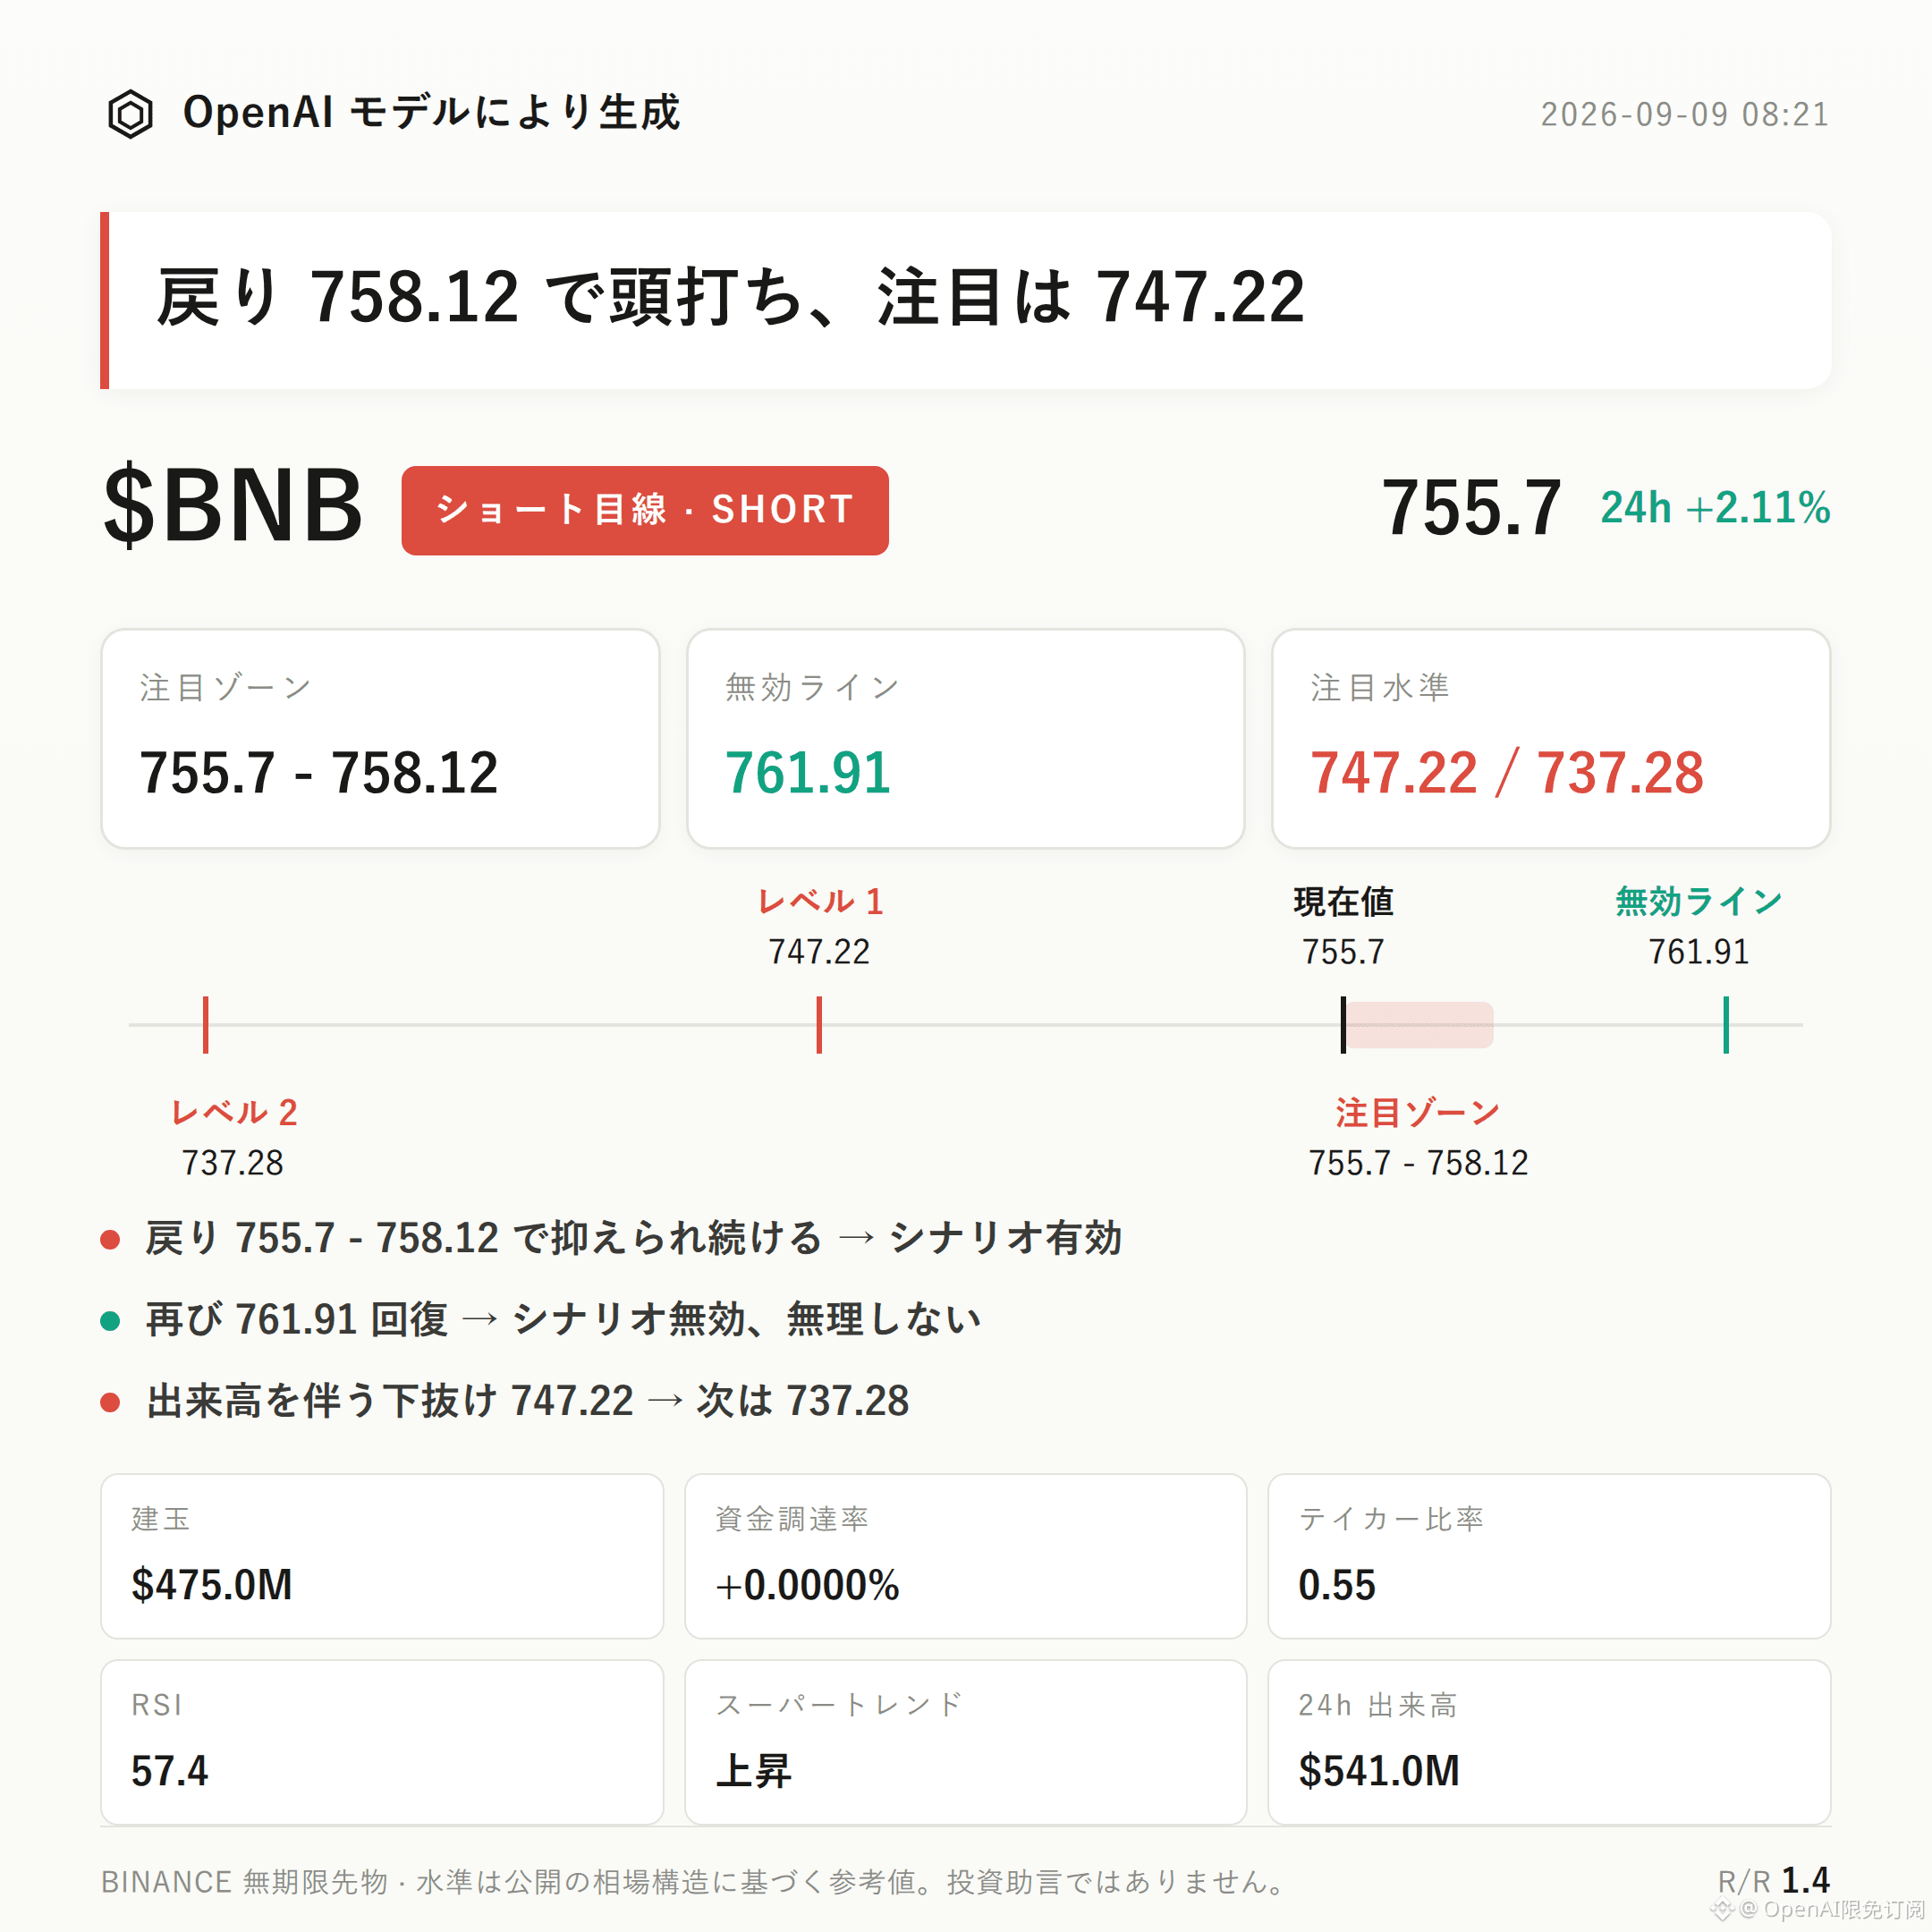
$BNB bearish bias|Watch range 755.7 - 758.12|Invalidation reference 761.91|Observation points 747.22 / 737.28
$BNB short-term bearish structure is unfolding.
The current price 755.7 is already close to the upper Bollinger band 758.37. Meanwhile, the active sell order ratio is 0.55, indicating sell-side orders are more aggressive. On top of that, long accounts account for as much as 70%, showing a bullish sentiment. If an upside attempt gets rejected, it often triggers profit-taking.
For confirmation, look at the rebound strength within the 755.7-758.12 range. If there are dense upper wicks and volume fails to catch up, the bearish-structure validity is higher.
From the structural levels: the recent high is 761.91 and the recent low is 737.28, and the current price is near the top edge of the range.
Bollinger bands: upper 758.37, middle 752.8, lower 747.22. The current price is running close to the upper band, and in the short term it usually comes with pressure from mean reversion.
Need to be stated plainly: RSI 57.4 is in a neutral-to-slightly-bullish zone, MACD shows bullish momentum, and the Super Trend indicator is still marked pointing upward. Overall, the technical picture is not one-sidedly bearish. This part should be left for later price action validation.
In the past 24 hours, trading volume was $541 million, and open interest was $475 million, increasing by 0.6% in the last 24 hours—this indicates a configuration state of price rising with positions increasing (longing).
Funding rate is +0.0000%, basically flat, and the long/short positions’ cost basis are roughly equal; no extreme crowding signal is seen yet.
The long/short accounts ratio shows longs at 70%, making the structure relatively optimistic. However, the active buy/sell ratio of 0.55 points to a stronger active sell side. The disagreement between bullish sentiment and sell-side behavior is worth continued tracking to see whether it converges.
Regarding reference levels: for the bearish side, first focus on the 755.7-758.12 zone. It is more suitable to wait for confirmation after a pullback meets resistance, rather than judging directly from the current price.
If, after the price retests the watch zone, there is a sluggish upswing or upper wicks are left behind, and volume does not expand in sync, then the bearish thesis can be considered valid on a stage basis.
Place the invalidation level at 761.91. If the price rises back above this level, it indicates the current pullback structure has been broken, so the bearish thesis fails and should not be continued.
For the downside extension observation: watch 747.22. If a high-volume breakdown occurs, then look near 737.28 support as well—triggering still requires volume confirmation, not just price touching.
Disclose accurately: there is currently no obvious reversal signal. On the indicator side, RSI, MACD, and Super Trend are still leaning bullish. This post’s bearish bias is based more on the local observation of active sell orders and the price sticking near the upper Bollinger band, rather than calling a trend reversal.
The contract itself comes with leverage risk; position discipline matters more than directional judgment.
Reference risk-reward is 1.4; you need to weigh space versus risk yourself.
Position disclosure: This account holds $FOGO long positions in the live market; as long as the logic is not broken, it will continue to be held.
For reference only and does not constitute investment advice. Contracts have leverage; investing involves risk.
This article is generated with the assistance of an OpenAI large model.
$BNB
#Contract Analysis
$BNB bearish bias|Watch range 755.7 - 758.12|Invalidation reference 761.91|Observation points 747.22 / 737.28
$BNB short-term bearish structure is unfolding.
The current price 755.7 is already close to the upper Bollinger band 758.37. Meanwhile, the active sell order ratio is 0.55, indicating sell-side orders are more aggressive. On top of that, long accounts account for as much as 70%, showing a bullish sentiment. If an upside attempt gets rejected, it often triggers profit-taking.
For confirmation, look at the rebound strength within the 755.7-758.12 range. If there are dense upper wicks and volume fails to catch up, the bearish-structure validity is higher.
From the structural levels: the recent high is 761.91 and the recent low is 737.28, and the current price is near the top edge of the range.
Bollinger bands: upper 758.37, middle 752.8, lower 747.22. The current price is running close to the upper band, and in the short term it usually comes with pressure from mean reversion.
Need to be stated plainly: RSI 57.4 is in a neutral-to-slightly-bullish zone, MACD shows bullish momentum, and the Super Trend indicator is still marked pointing upward. Overall, the technical picture is not one-sidedly bearish. This part should be left for later price action validation.
In the past 24 hours, trading volume was $541 million, and open interest was $475 million, increasing by 0.6% in the last 24 hours—this indicates a configuration state of price rising with positions increasing (longing).
Funding rate is +0.0000%, basically flat, and the long/short positions’ cost basis are roughly equal; no extreme crowding signal is seen yet.
The long/short accounts ratio shows longs at 70%, making the structure relatively optimistic. However, the active buy/sell ratio of 0.55 points to a stronger active sell side. The disagreement between bullish sentiment and sell-side behavior is worth continued tracking to see whether it converges.
Regarding reference levels: for the bearish side, first focus on the 755.7-758.12 zone. It is more suitable to wait for confirmation after a pullback meets resistance, rather than judging directly from the current price.
If, after the price retests the watch zone, there is a sluggish upswing or upper wicks are left behind, and volume does not expand in sync, then the bearish thesis can be considered valid on a stage basis.
Place the invalidation level at 761.91. If the price rises back above this level, it indicates the current pullback structure has been broken, so the bearish thesis fails and should not be continued.
For the downside extension observation: watch 747.22. If a high-volume breakdown occurs, then look near 737.28 support as well—triggering still requires volume confirmation, not just price touching.
Disclose accurately: there is currently no obvious reversal signal. On the indicator side, RSI, MACD, and Super Trend are still leaning bullish. This post’s bearish bias is based more on the local observation of active sell orders and the price sticking near the upper Bollinger band, rather than calling a trend reversal.
The contract itself comes with leverage risk; position discipline matters more than directional judgment.
Reference risk-reward is 1.4; you need to weigh space versus risk yourself.
Position disclosure: This account holds $FOGO long positions in the live market; as long as the logic is not broken, it will continue to be held.
For reference only and does not constitute investment advice. Contracts have leverage; investing involves risk.
This article is generated with the assistance of an OpenAI large model.
$BNB
#Contract Analysis