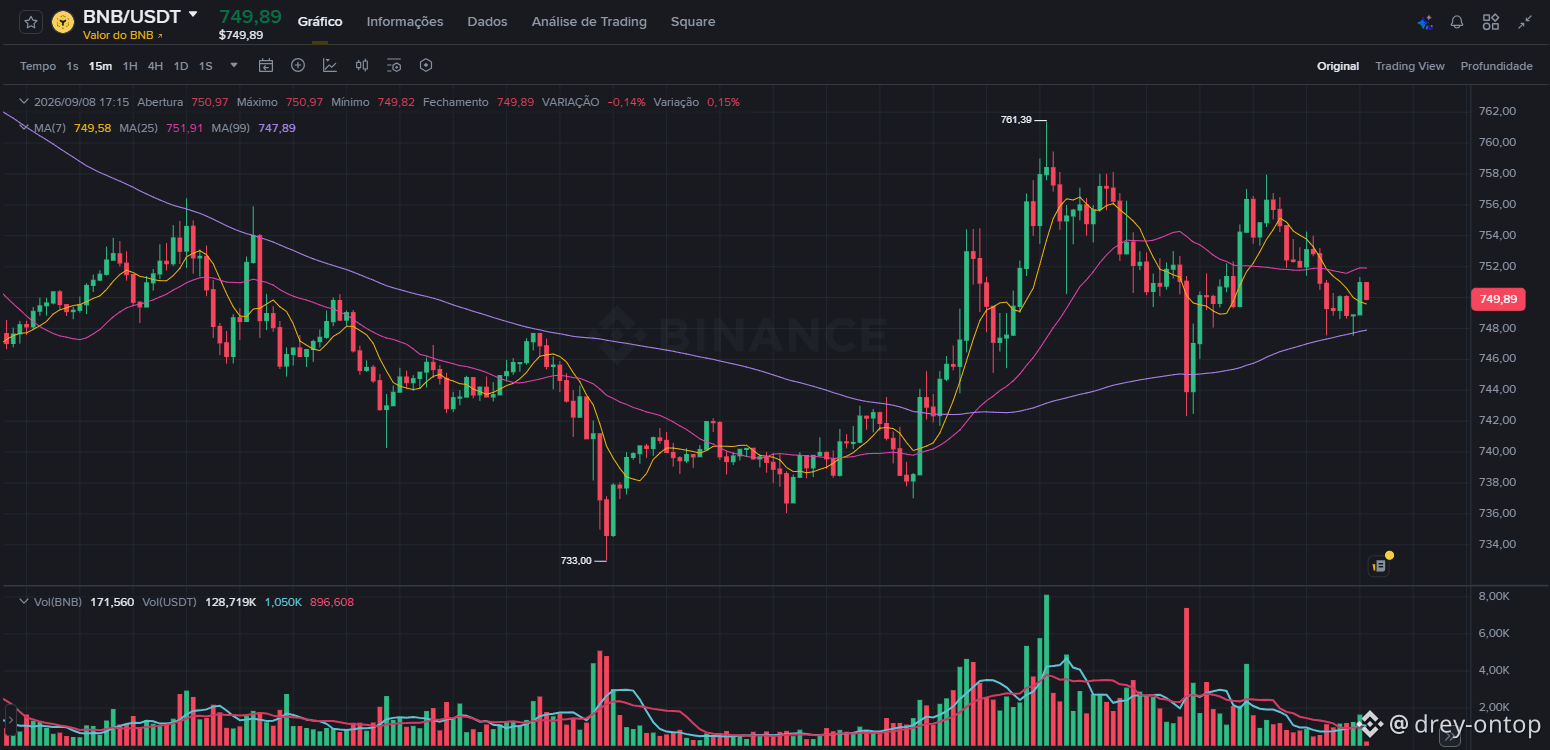
📌 TECHNICAL ANALYSIS: BNB/USDT (SPOT MARKET)
After testing and being rejected in the macro resistance zone of $780, BNB entered a lateral consolidation/pullback quadrant in the short term on the daily chart.
METRICS COLLECTED:
• Current Price: Around $750.
• Weekly Performance: Accumulates volatility with a balance of +8.5% over the last 7 days.
• Immediate Support: Zone between $740 and $745 (critical defense point for buyers).
• Main Resistance: Region of $780 - $781.
TRADING TRIGGERS:
• Breakout to the Upside: A daily candle close above $781 validates the continuation of the buying flow, opening room to test targets at $800 and $825.
• Breakout to the Downside: A consolidated loss of the $740 support invalidates the short-term bullish structure, paving the way for pullbacks to the secondary supports at $725 and $710.
Monitor trading volume at the extremes. Trade with risk management.
After testing and being rejected in the macro resistance zone of $780, BNB entered a lateral consolidation/pullback quadrant in the short term on the daily chart.
METRICS COLLECTED:
• Current Price: Around $750.
• Weekly Performance: Accumulates volatility with a balance of +8.5% over the last 7 days.
• Immediate Support: Zone between $740 and $745 (critical defense point for buyers).
• Main Resistance: Region of $780 - $781.
TRADING TRIGGERS:
• Breakout to the Upside: A daily candle close above $781 validates the continuation of the buying flow, opening room to test targets at $800 and $825.
• Breakout to the Downside: A consolidated loss of the $740 support invalidates the short-term bullish structure, paving the way for pullbacks to the secondary supports at $725 and $710.
Monitor trading volume at the extremes. Trade with risk management.