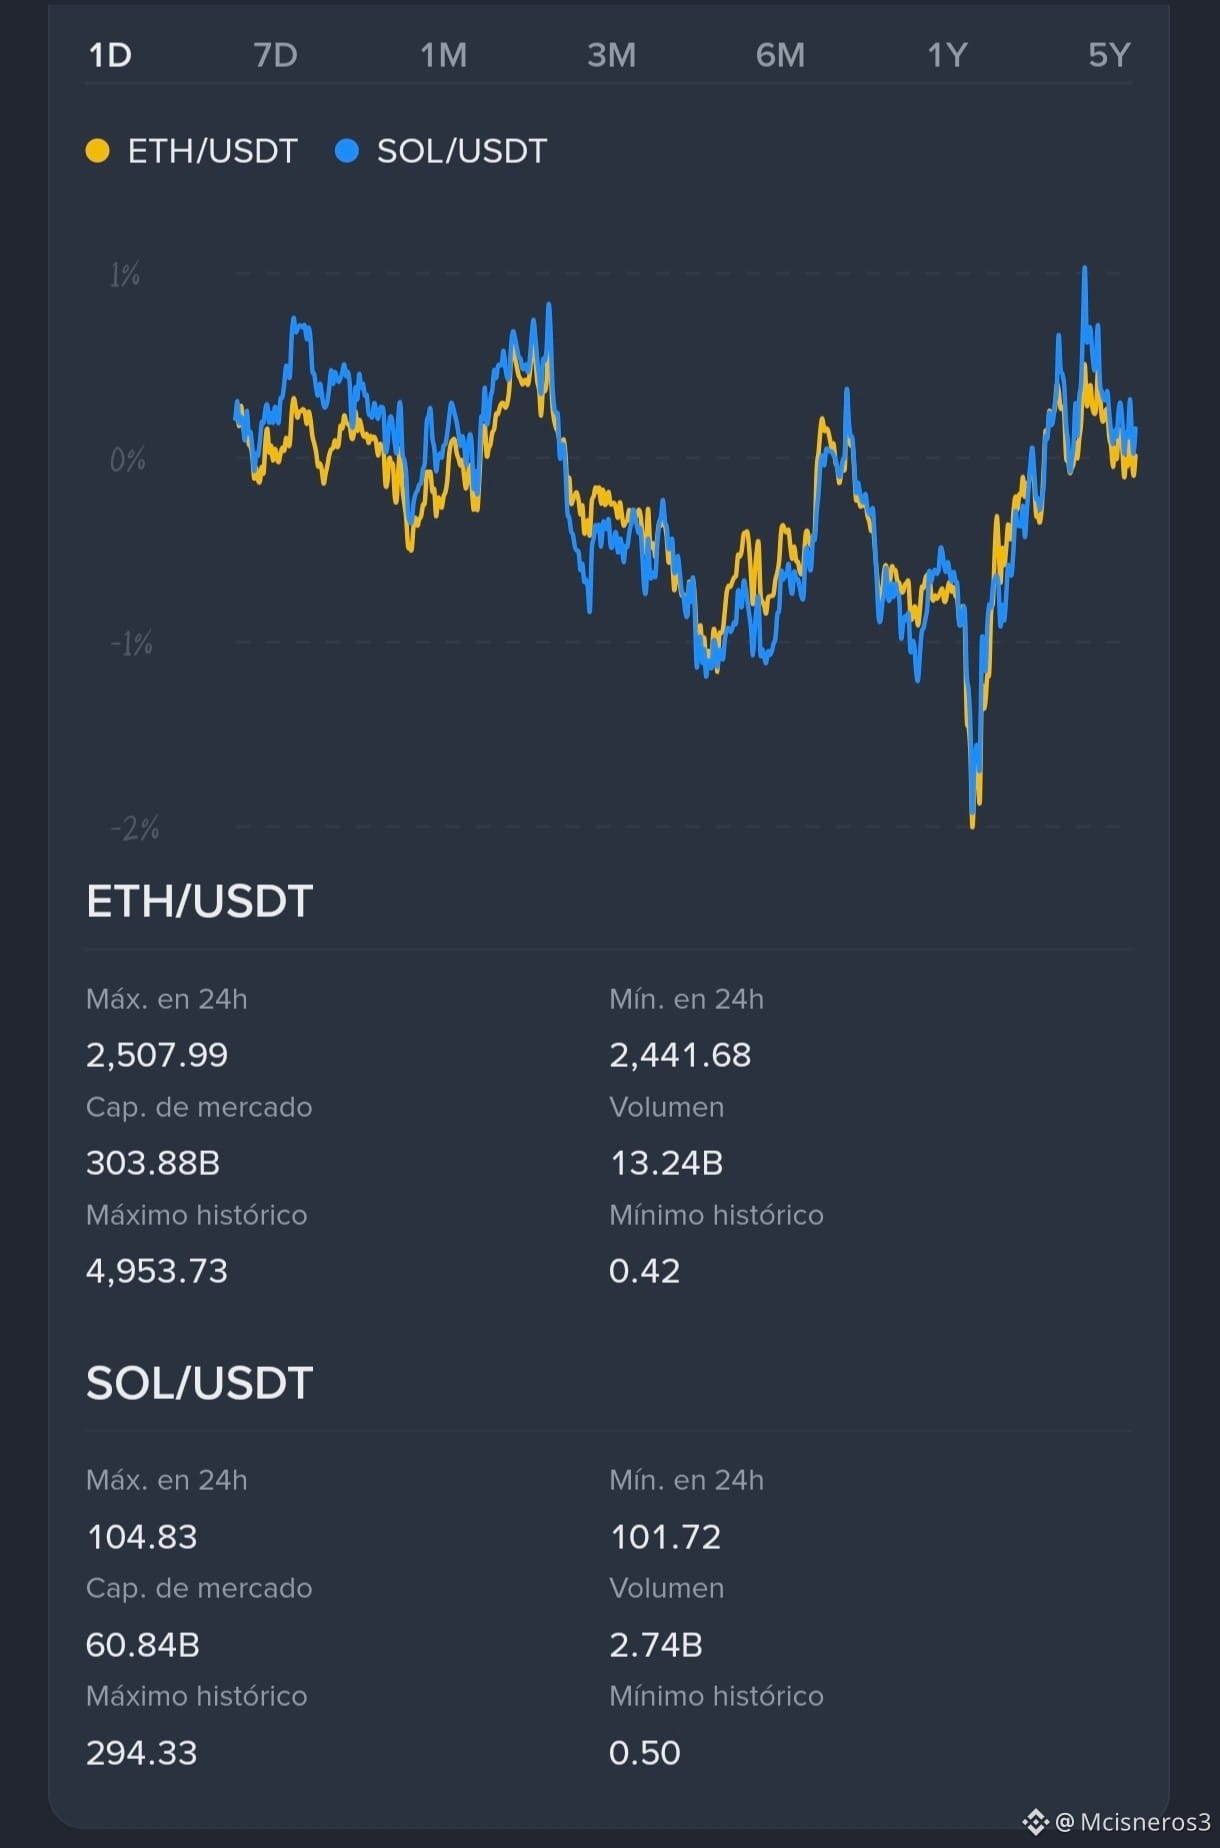
ETH vs. SOL
ETH has been marginally stronger this week: +0.85% over 7 days versus SOL’s +0.64%, based on Binance data as of 2026-09-08. However, the difference is small: both assets are consolidating after a much larger move over the past 30 days.
1. This week’s momentum
ETH slightly outperforms SOL over the 7-day window. By contrast, over 30 days SOL has gained more: +36.42% versus ETH’s +29.82%. This suggests SOL had a stronger monthly run, while ETH has held up momentum better in the last few days.
2. Technical signals
Both maintain a constructive underlying trend structure: price is above its 7-, 25-, and 99-day moving averages, and the daily SuperTrend remains bullish.
Still, the short-term picture isn’t fully favorable: both show a bearish MACD and a recent bearish crossover. SOL’s crossover occurred 4 candles ago, which is more recent than ETH’s 7-candle-ago crossover. Their RSIs are in the neutral zone, with no clear overbought or oversold reading.
3. Volume and flows
Daily volume is below its 7-day average in both cases: 0.76 for ETH and 0.75
for SOL. In addition, net outflows appear in large orders over the last day for both. This points to caution and consolidation, not a confirmed acceleration of momentum.
Overall read: ETH shows only slightly stronger weekly strength and somewhat weaker flow signals. SOL retains the advantage in 30-day performance, but its immediate momentum has also cooled. More than a clear winner, these reflect different exposures: ETH typically has a relatively more moderate beta within major networks; SOL has shown greater monthly expansion and may imply more pronounced swings.
Data comes from the spot market and Binance’s daily indicators, as of 2026-09-08.
ETH has been marginally stronger this week: +0.85% over 7 days versus SOL’s +0.64%, based on Binance data as of 2026-09-08. However, the difference is small: both assets are consolidating after a much larger move over the past 30 days.
1. This week’s momentum
ETH slightly outperforms SOL over the 7-day window. By contrast, over 30 days SOL has gained more: +36.42% versus ETH’s +29.82%. This suggests SOL had a stronger monthly run, while ETH has held up momentum better in the last few days.
2. Technical signals
Both maintain a constructive underlying trend structure: price is above its 7-, 25-, and 99-day moving averages, and the daily SuperTrend remains bullish.
Still, the short-term picture isn’t fully favorable: both show a bearish MACD and a recent bearish crossover. SOL’s crossover occurred 4 candles ago, which is more recent than ETH’s 7-candle-ago crossover. Their RSIs are in the neutral zone, with no clear overbought or oversold reading.
3. Volume and flows
Daily volume is below its 7-day average in both cases: 0.76 for ETH and 0.75
for SOL. In addition, net outflows appear in large orders over the last day for both. This points to caution and consolidation, not a confirmed acceleration of momentum.
Overall read: ETH shows only slightly stronger weekly strength and somewhat weaker flow signals. SOL retains the advantage in 30-day performance, but its immediate momentum has also cooled. More than a clear winner, these reflect different exposures: ETH typically has a relatively more moderate beta within major networks; SOL has shown greater monthly expansion and may imply more pronounced swings.
Data comes from the spot market and Binance’s daily indicators, as of 2026-09-08.