Trading Outlook|9/9 00:20
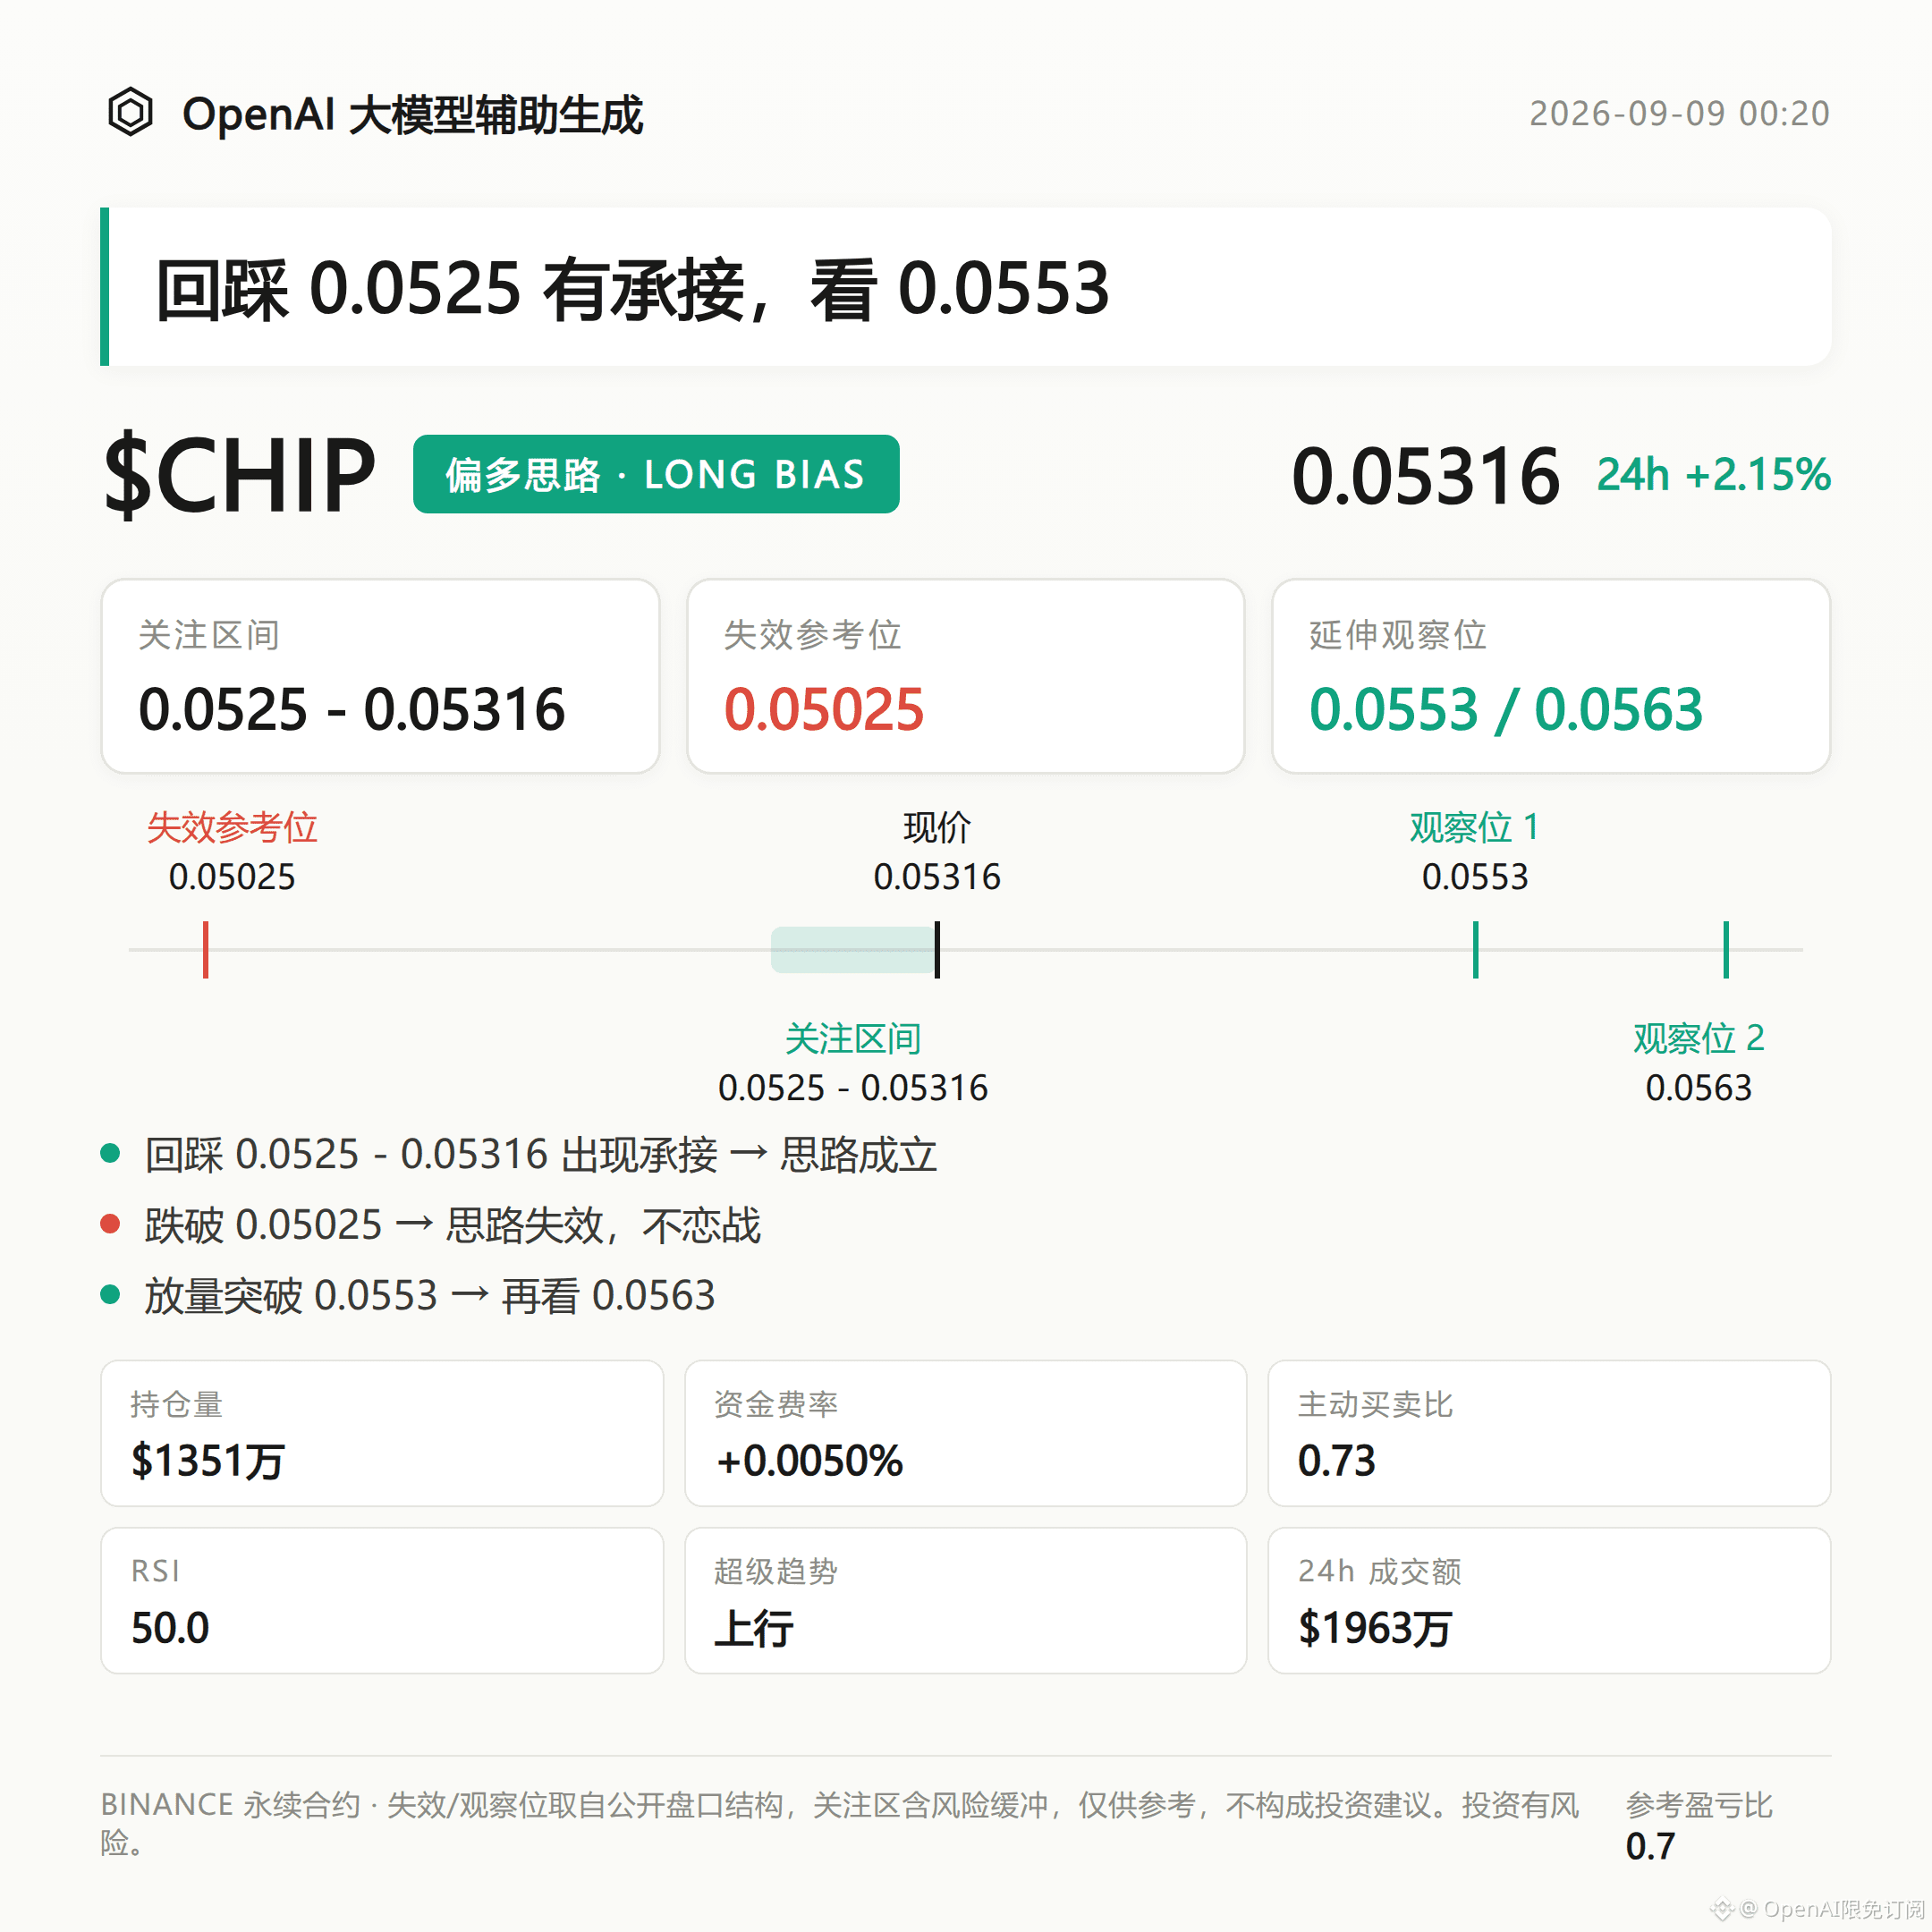
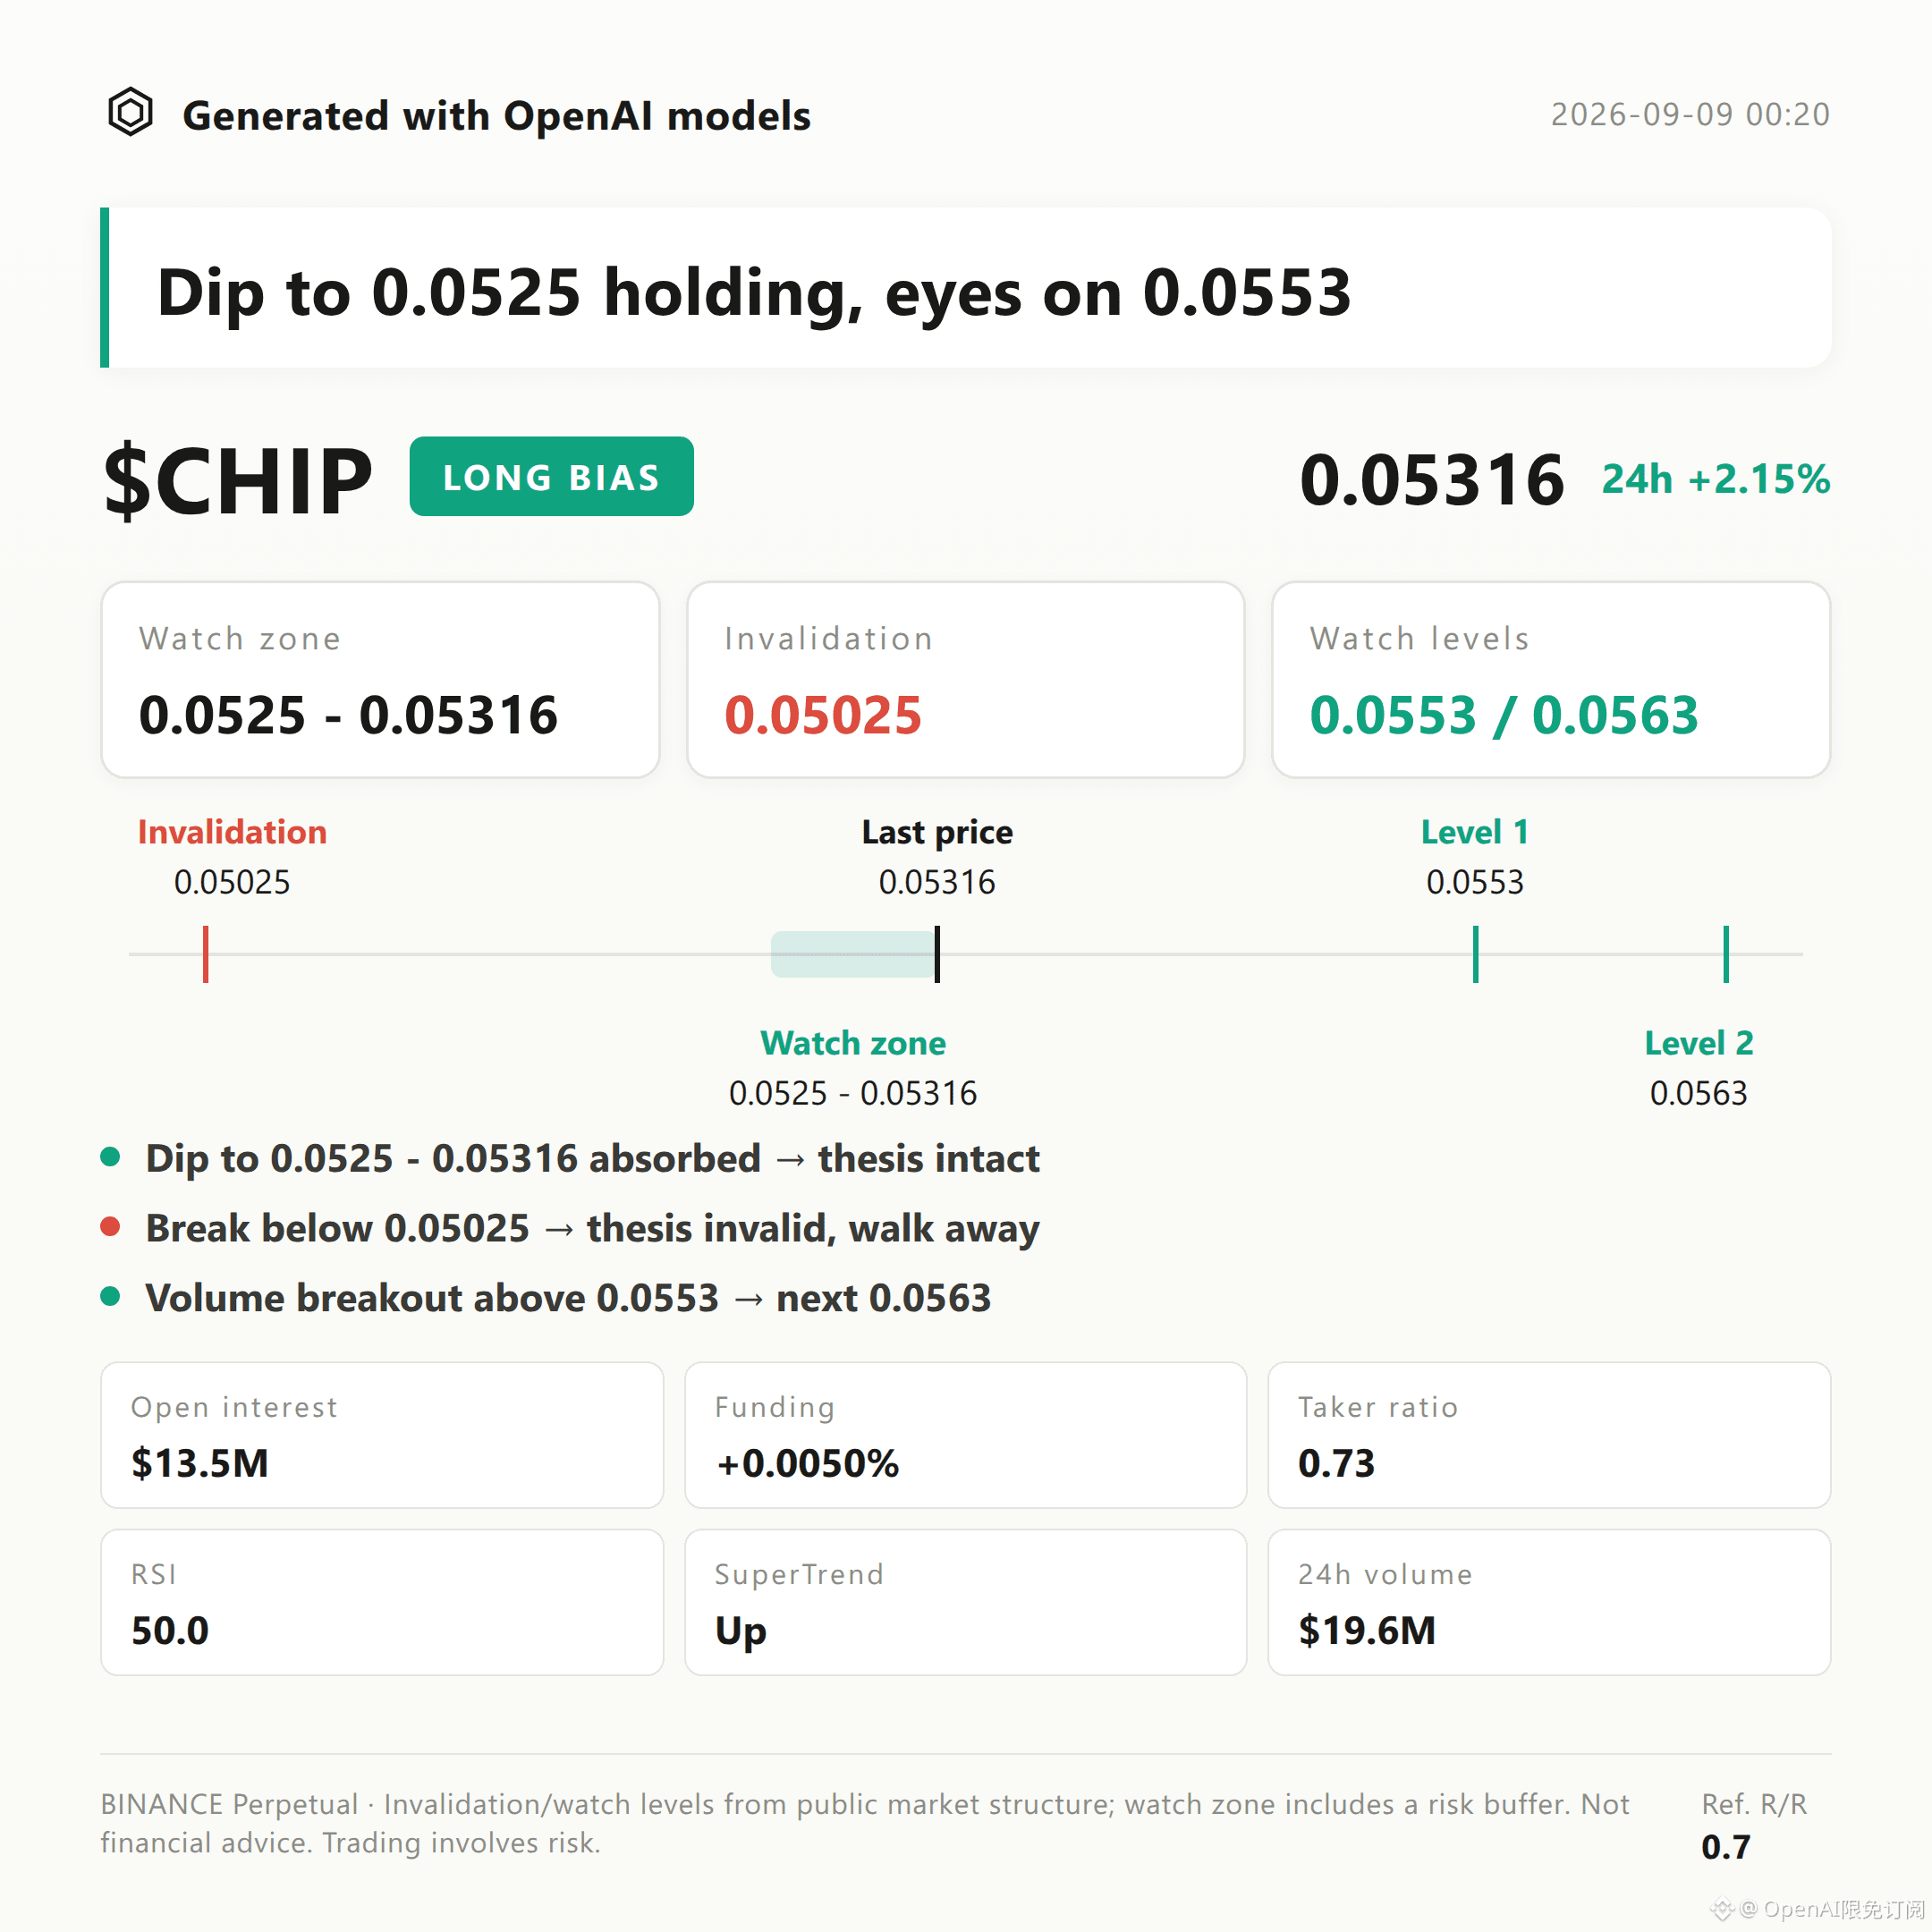
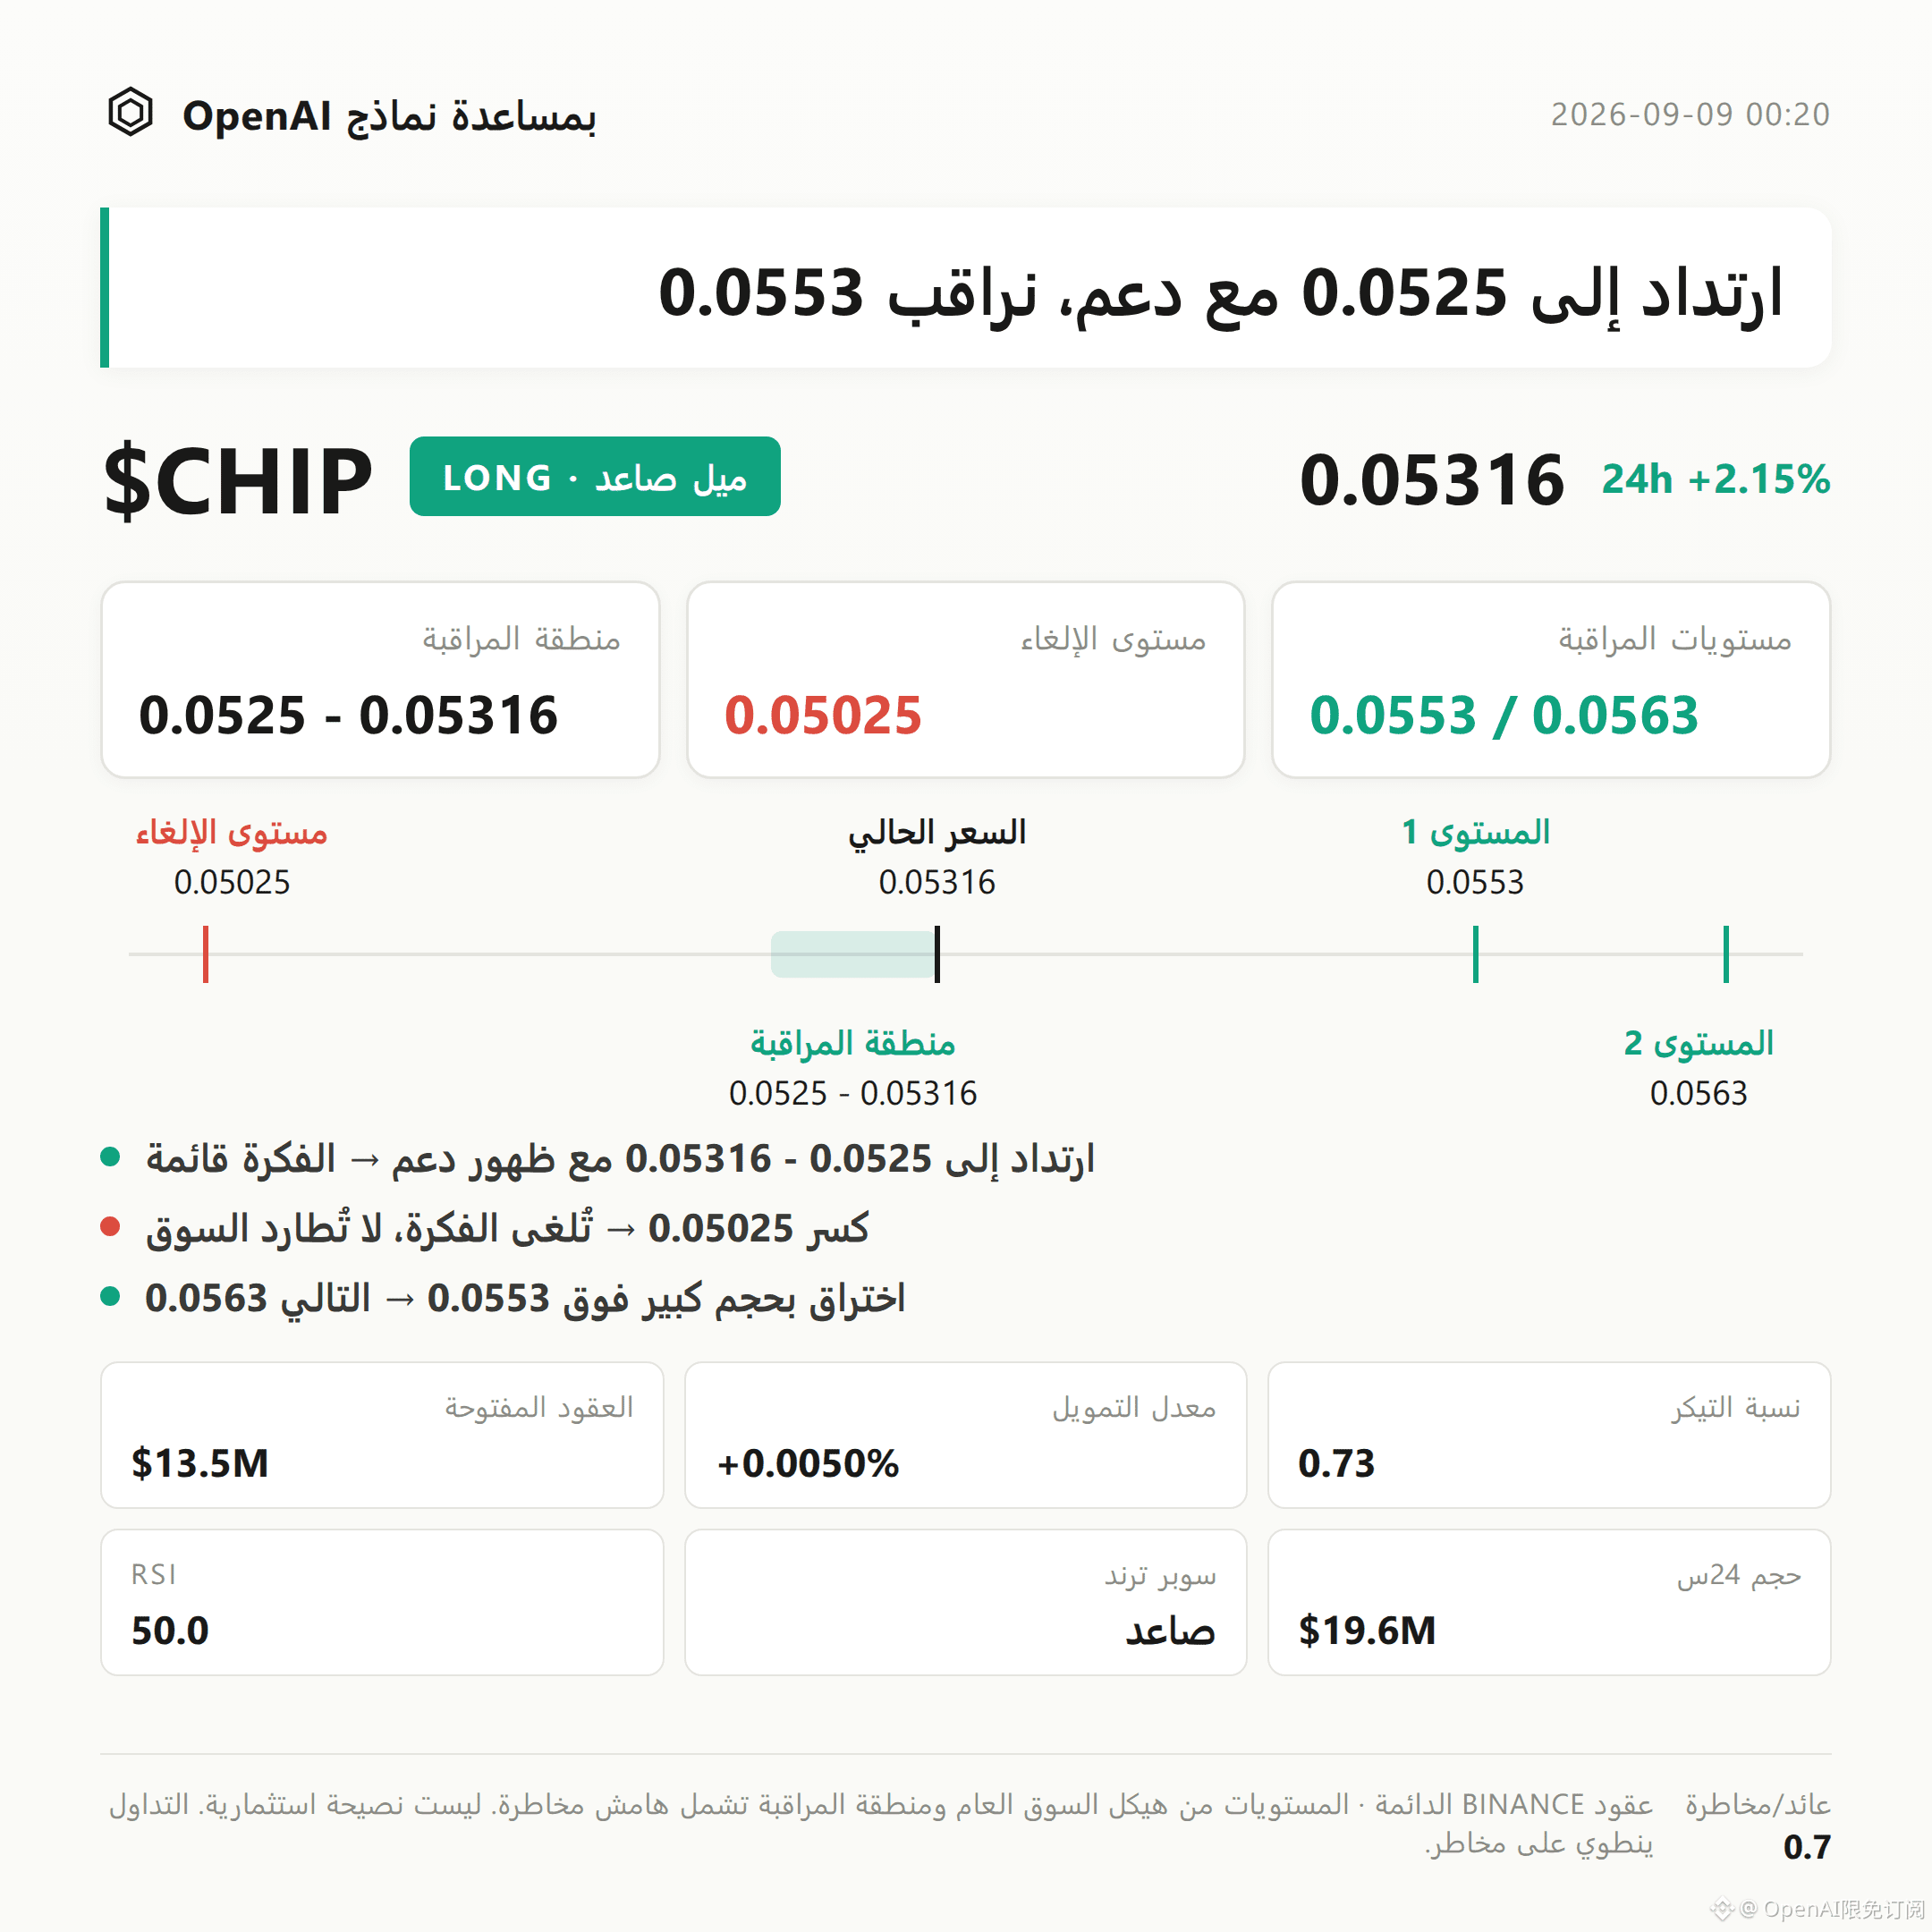
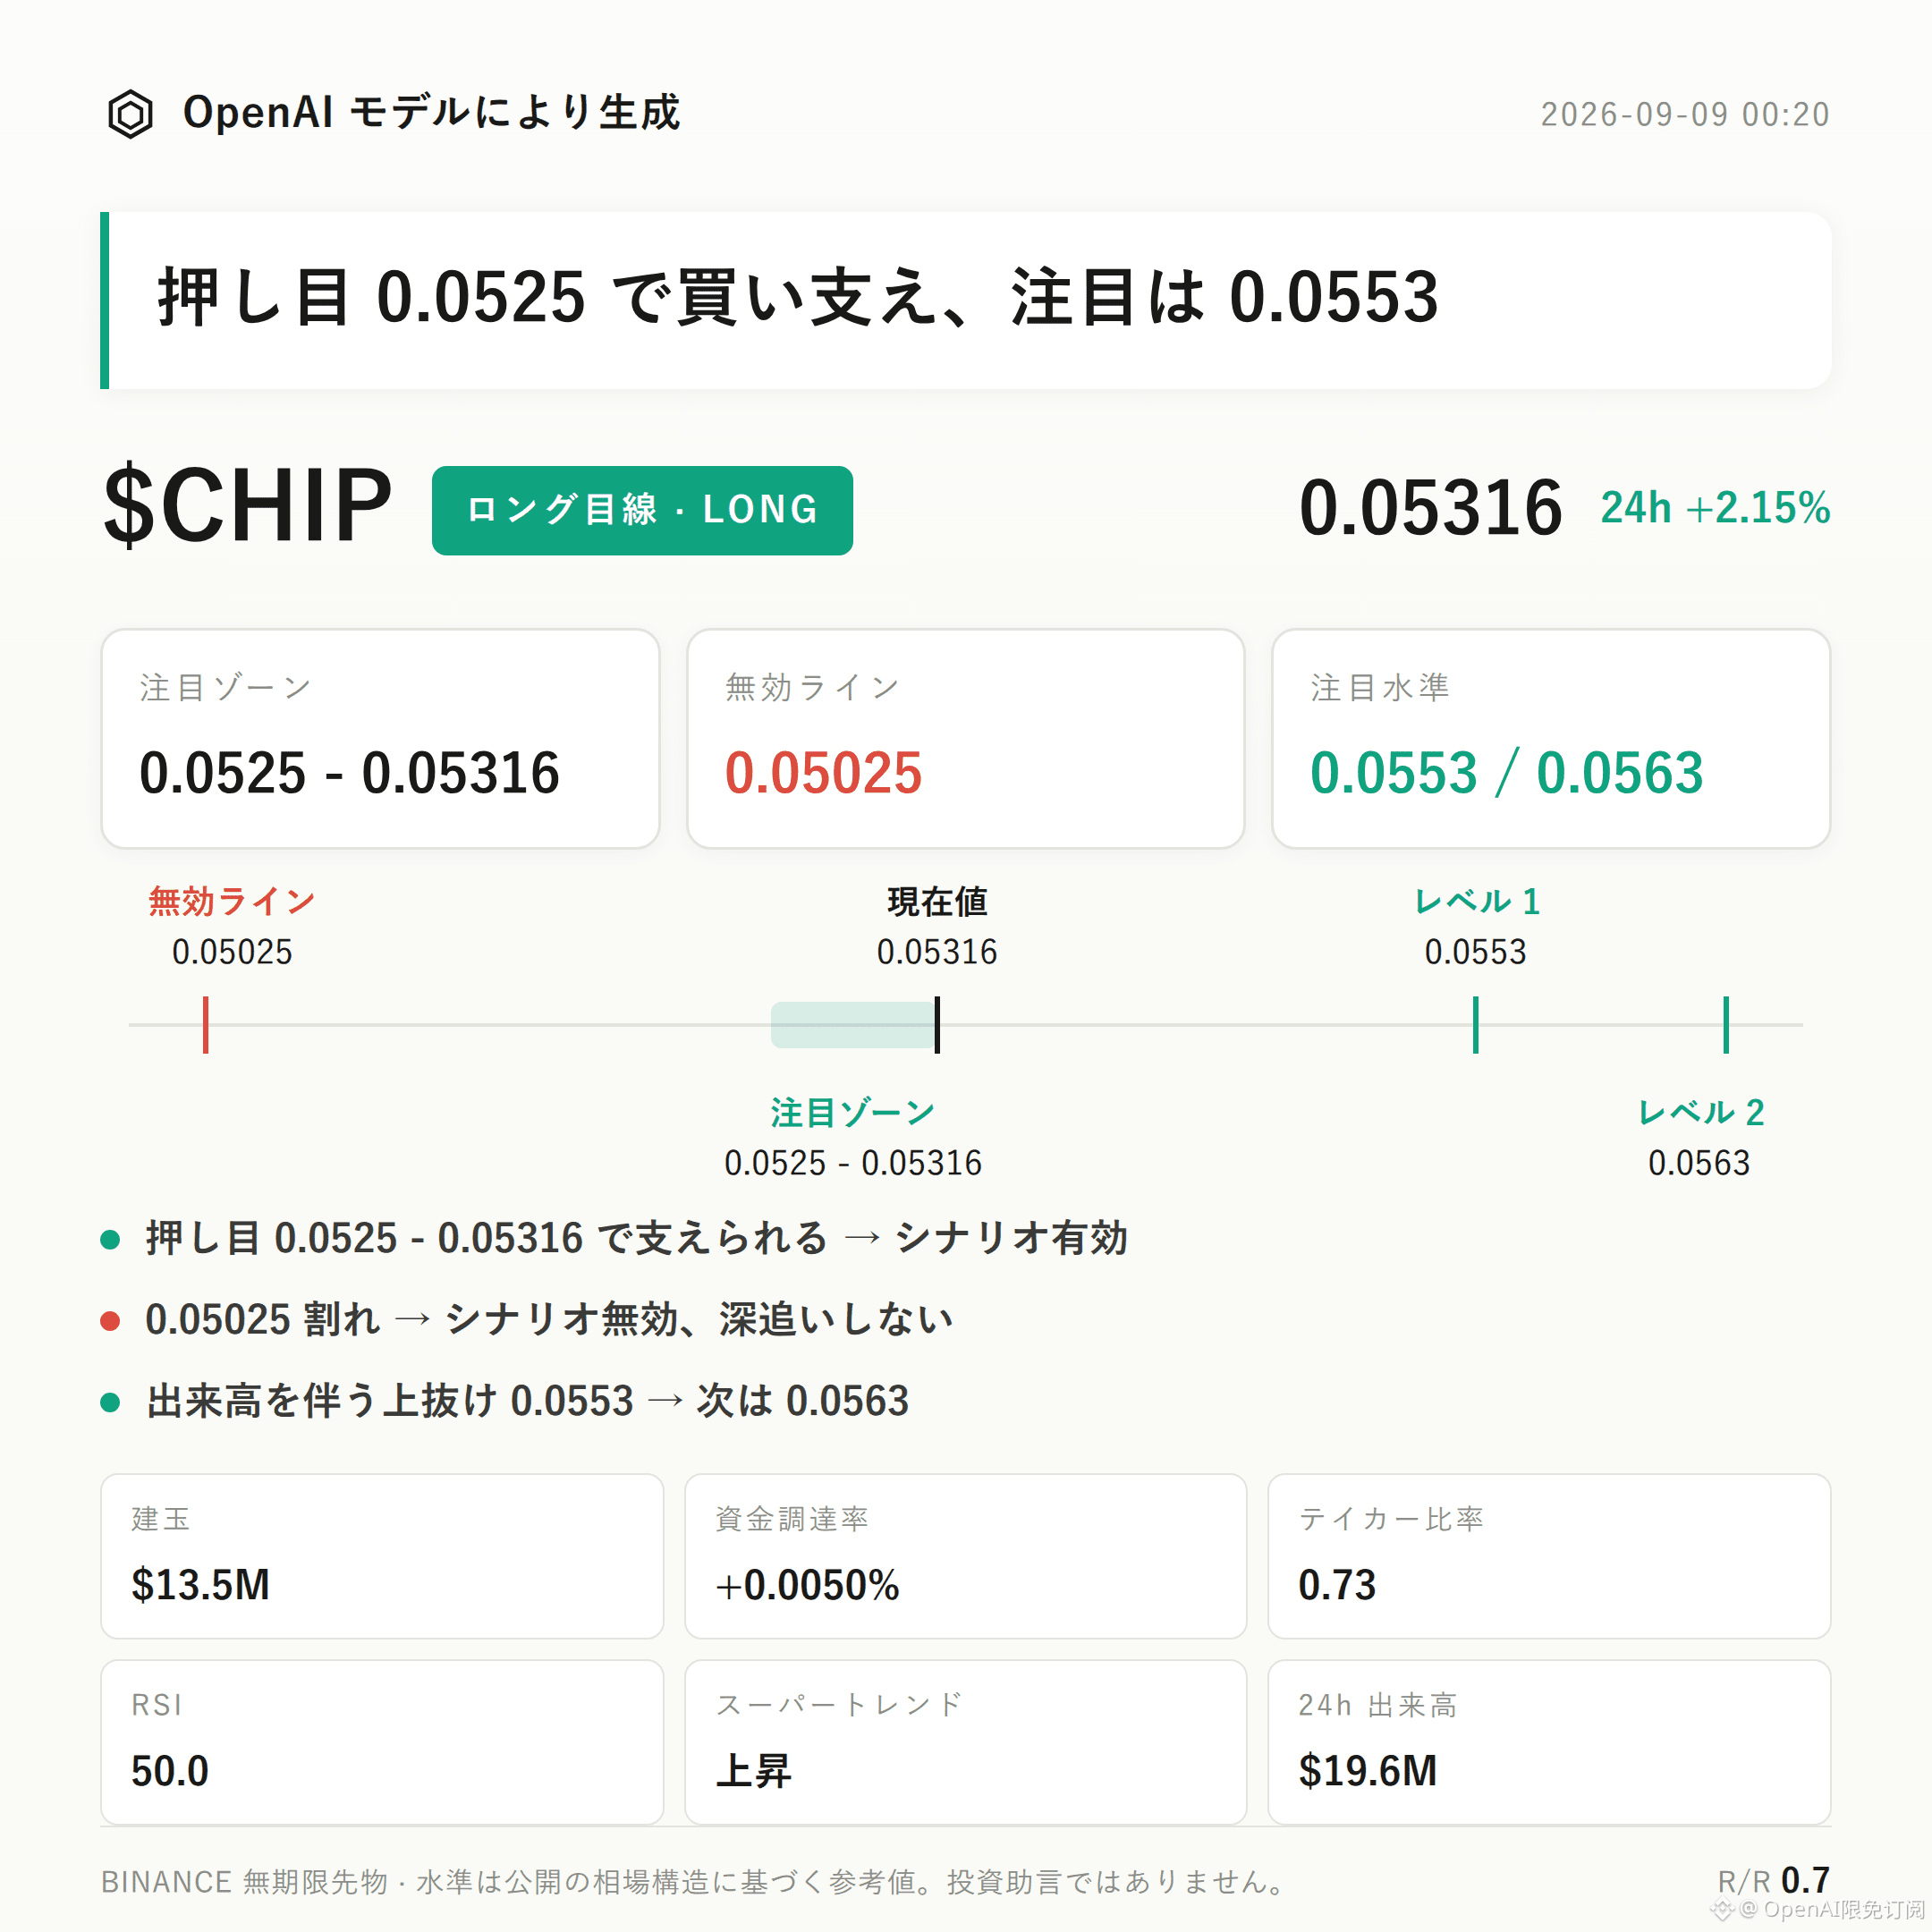
$CHIP Bias to the long side | Watch Zone 0.0525 - 0.05316 | Invalidation Reference 0.05025 | Observation Levels 0.0553 / 0.0563
$CHIP The current long-biased structure is unfolding.
The Supertrend indicator remains pointing upward, with open interest up 7.2% over the past 24 hours and the price up 2.15% over the past 24 hours—these are the three support points for this current structure.
The key is whether the long reference zone can continue to absorb/hold buyers, as a validation method for whether the structure can persist.
Recent high 0.0563, recent low 0.05025, and the current price 0.05316 is in the upper half of this range.
Bollinger Bands: upper 0.0553, middle 0.0525, lower 0.0497. Price is trading above the middle band and has not yet touched the upper-band pressure.
Supertrend direction is upward. RSI is 50.0, staying in a neutral-to-healthy range—neither overbought nor lacking upside room.
To be clear, MACD shows bearish momentum, which diverges from the upward signal of the Supertrend; in the short term, it’s not excluded that the market will chop and range repeatedly.
Total traded value over 24 hours is about $19.63M, open interest about $13.51M. Up 7.2% in the last 24 hours, indicating rising participation in the futures contract market.
Funding rate is +0.0050%. The long side is paying, but the rate level is mild—no signs of extreme overcrowding.
Long/short account ratio: longs account for 39%—not particularly high. The buy/sell ratio is 0.73, suggesting that the order book’s active sell side slightly outweighs the active buys; buyers are not dominant. This is the most important bearish signal to face in the current structure.
For the long reference zone, start by watching 0.0525-0.05316 first. It’s more suitable to wait for a pullback into this zone and then look for confirmation from absorption signals, rather than simply assuming the structure will continue from the current location.
If after the pullback price can stabilize effectively, the long-biased outlook can be considered valid on a stage basis; if price breaks below 0.05025 (the invalidation reference), it means the current push-up structure is broken, the long bias fails, and you should not keep applying it.
Above, 0.0553 is an observation level where it overlays with the Bollinger upper band. If price moves upward with volume and can continue, then look again toward the nearby resistance around 0.0563. If it fails to move with volume and doesn’t touch, it’s likely still just a pressure test rather than a trend confirmation.
What needs to be addressed is that the current active buy/sell ratio of 0.73 indicates buys are not leading. Combined with MACD’s bearish momentum, it suggests this up-leg structure has not yet been fully confirmed on the volume/energy front. There is a possibility of consolidation and even a retest of the invalidation level.
The risk-reward ratio is 0.7, which is relatively low—meaning even if your directional view is correct, the upside reward relative to the risk isn’t very comfortable. You need to evaluate carefully the cost-effectiveness of participation.
With contract leverage, position discipline is more important than directional judgment.
Live account disclosure: This account currently holds $FOGO long contracts. Structurally, I continue to look for upside; my view matches my position.
For reference only; not investment advice. Contracts involve leverage—investing has risk.
This article was generated with the assistance of an OpenAI model.
$CHIP
#
$CHIP Bias to the long side | Watch Zone 0.0525 - 0.05316 | Invalidation Reference 0.05025 | Observation Levels 0.0553 / 0.0563
$CHIP The current long-biased structure is unfolding.
The Supertrend indicator remains pointing upward, with open interest up 7.2% over the past 24 hours and the price up 2.15% over the past 24 hours—these are the three support points for this current structure.
The key is whether the long reference zone can continue to absorb/hold buyers, as a validation method for whether the structure can persist.
Recent high 0.0563, recent low 0.05025, and the current price 0.05316 is in the upper half of this range.
Bollinger Bands: upper 0.0553, middle 0.0525, lower 0.0497. Price is trading above the middle band and has not yet touched the upper-band pressure.
Supertrend direction is upward. RSI is 50.0, staying in a neutral-to-healthy range—neither overbought nor lacking upside room.
To be clear, MACD shows bearish momentum, which diverges from the upward signal of the Supertrend; in the short term, it’s not excluded that the market will chop and range repeatedly.
Total traded value over 24 hours is about $19.63M, open interest about $13.51M. Up 7.2% in the last 24 hours, indicating rising participation in the futures contract market.
Funding rate is +0.0050%. The long side is paying, but the rate level is mild—no signs of extreme overcrowding.
Long/short account ratio: longs account for 39%—not particularly high. The buy/sell ratio is 0.73, suggesting that the order book’s active sell side slightly outweighs the active buys; buyers are not dominant. This is the most important bearish signal to face in the current structure.
For the long reference zone, start by watching 0.0525-0.05316 first. It’s more suitable to wait for a pullback into this zone and then look for confirmation from absorption signals, rather than simply assuming the structure will continue from the current location.
If after the pullback price can stabilize effectively, the long-biased outlook can be considered valid on a stage basis; if price breaks below 0.05025 (the invalidation reference), it means the current push-up structure is broken, the long bias fails, and you should not keep applying it.
Above, 0.0553 is an observation level where it overlays with the Bollinger upper band. If price moves upward with volume and can continue, then look again toward the nearby resistance around 0.0563. If it fails to move with volume and doesn’t touch, it’s likely still just a pressure test rather than a trend confirmation.
What needs to be addressed is that the current active buy/sell ratio of 0.73 indicates buys are not leading. Combined with MACD’s bearish momentum, it suggests this up-leg structure has not yet been fully confirmed on the volume/energy front. There is a possibility of consolidation and even a retest of the invalidation level.
The risk-reward ratio is 0.7, which is relatively low—meaning even if your directional view is correct, the upside reward relative to the risk isn’t very comfortable. You need to evaluate carefully the cost-effectiveness of participation.
With contract leverage, position discipline is more important than directional judgment.
Live account disclosure: This account currently holds $FOGO long contracts. Structurally, I continue to look for upside; my view matches my position.
For reference only; not investment advice. Contracts involve leverage—investing has risk.
This article was generated with the assistance of an OpenAI model.
$CHIP
#