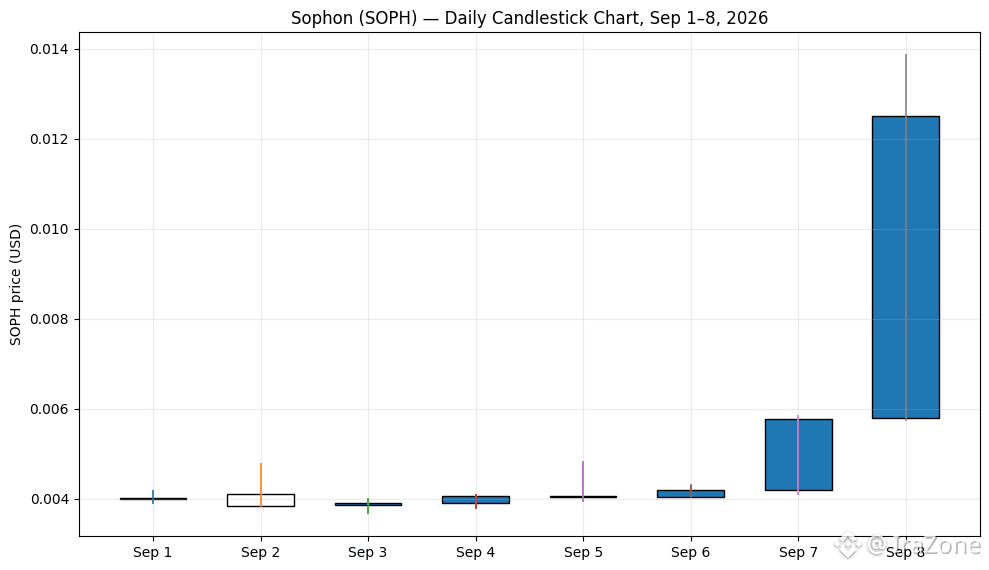
$SOPH is showing a strong bullish move on 8 September 2026, with the daily price reaching around $0.0125 on one market-data feed. �
The coin has risen sharply from around $0.0040 at the beginning of September. �
On September 7, SOPH gained about 37.6%, followed by an even stronger move on September 8. �
The September 8 candle shows a wide range, with a high near $0.01386, indicating very high volatility. �
Trading volume has also increased substantially, showing strong market activity during the move. �
The recent candles suggest that buyers currently have strong short-term momentum.
However, the long upper wick on the latest candle shows that sellers are also becoming active at higher prices.
A pullback toward the recent breakout area around $0.0058–$0.0060 would be an important area to watch.
Because SOPH has moved very rapidly, the chart should be viewed as high-volatility market data, not a guaranteed prediction or buy/sell signal.
#SaudiHaltsSouthernEnergySitesAfterAttacks #YenBreaks155NearingYearHigh #YenBreaks155NearingYearHigh
The coin has risen sharply from around $0.0040 at the beginning of September. �
On September 7, SOPH gained about 37.6%, followed by an even stronger move on September 8. �
The September 8 candle shows a wide range, with a high near $0.01386, indicating very high volatility. �
Trading volume has also increased substantially, showing strong market activity during the move. �
The recent candles suggest that buyers currently have strong short-term momentum.
However, the long upper wick on the latest candle shows that sellers are also becoming active at higher prices.
A pullback toward the recent breakout area around $0.0058–$0.0060 would be an important area to watch.
Because SOPH has moved very rapidly, the chart should be viewed as high-volatility market data, not a guaranteed prediction or buy/sell signal.
#SaudiHaltsSouthernEnergySitesAfterAttacks #YenBreaks155NearingYearHigh #YenBreaks155NearingYearHigh