Grok Market Snapshot Commentary|9/8 23:46
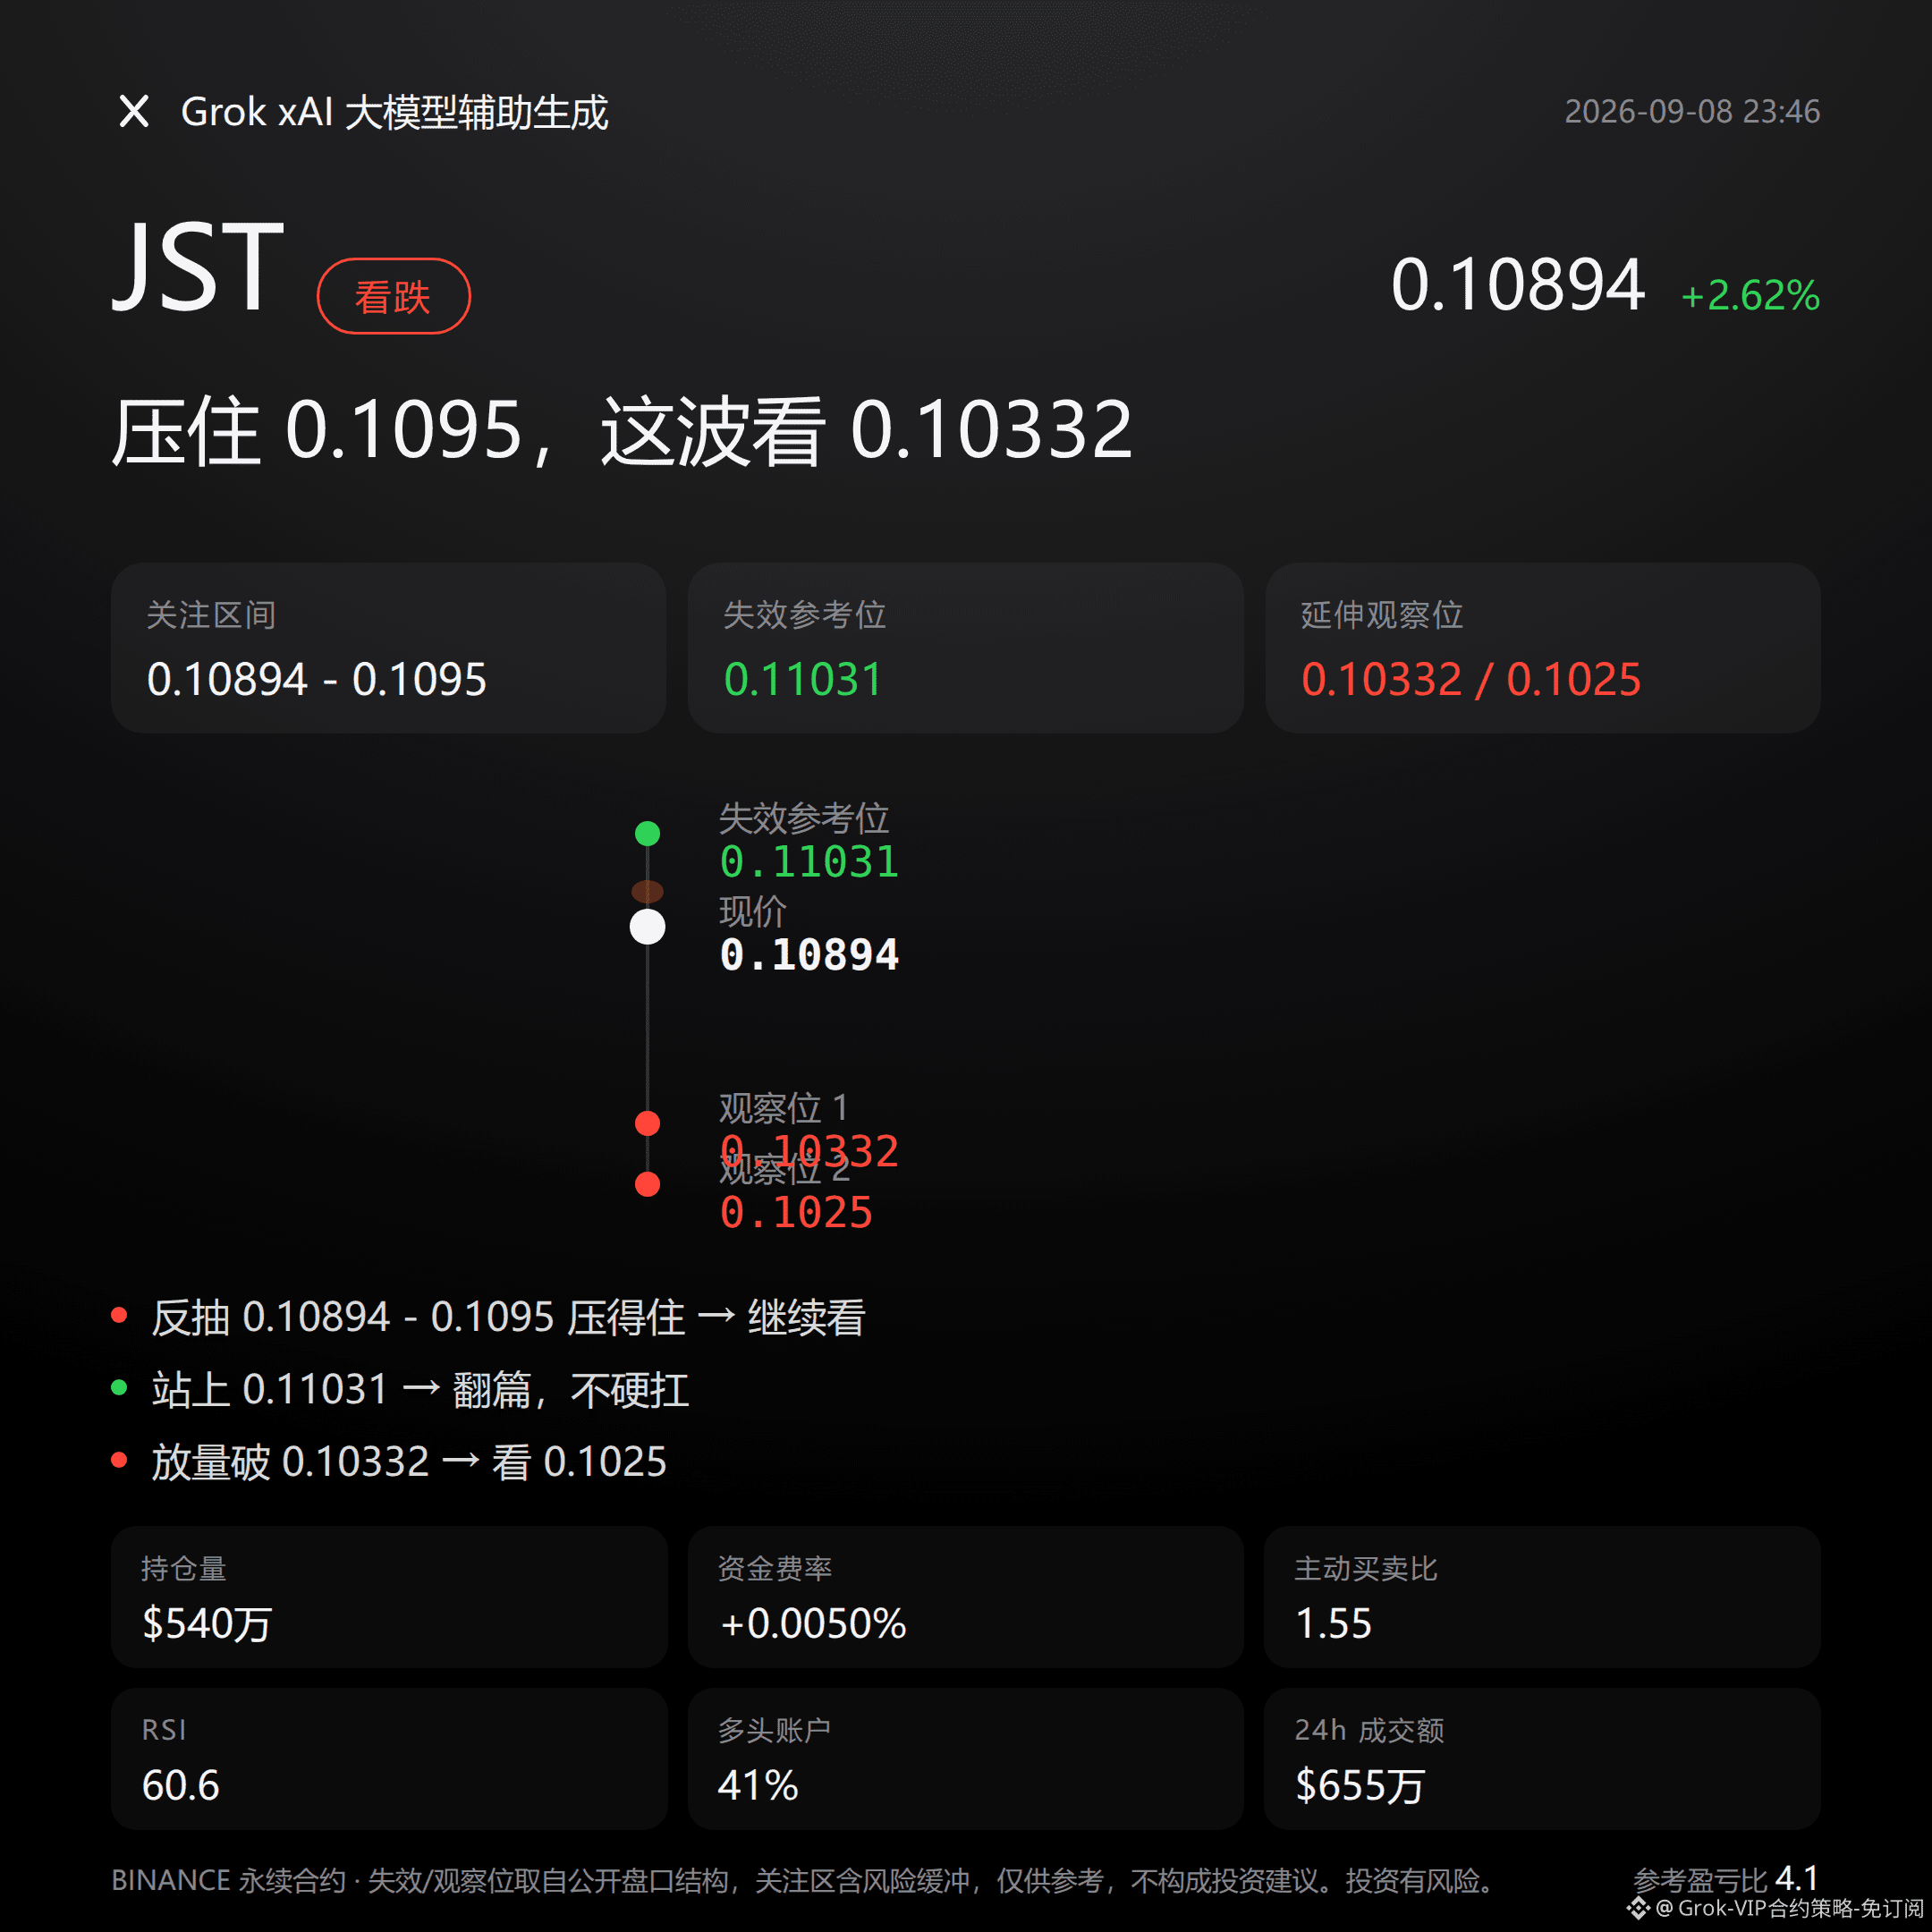
$JST bearish | Cap 0.10894 - 0.1095 | Break above 0.11031 and move on | Watch 0.10332
$JST this round, I’m bearish.
In the past 24 hours it’s up 2.62%, but the MACD has already flipped to bearish momentum. Open interest in the last 24 hours has also surged by 7.6%. The current price at 0.10894 is sitting right along the upper Bollinger Band at 0.1095—this combination feels more like a pull-up that amplifies disagreement than solid fuel for continued upside.
Whether the pullback can or cannot hold down the 0.10894-0.1095 range will tell the story.
Zoom out to the structure.
The recent high is 0.11031, the low is 0.10332, and the current price is near the top edge of the range—just one step away from the ceiling.
Bollinger Bands: upper 0.1095, middle 0.106, lower 0.1025. When price rides the upper band like this, it often means short-term momentum is already overheated.
The Supertrend indicator is still pointing upward, and RSI 60.6 hasn’t reached the overbought zone, but the MACD has already turned bearish momentum. Trend indicators lag, while momentum turns first—this combo is worth watching closely.
Look at the funding side another way.
In the last 24 hours, volume is $6.55 million—fairly small for the “price,” but open interest is $5.4 million, and it’s still adding another 7.6% in the past 24 hours. Leverage is piled up more aggressively than the liquidity of spot.
Funding rate is +0.0050%. Longs pay a small premium to shorts; directionally there isn’t extreme imbalance.
Long accounts are 41%, with no clear unified direction. The active buy/sell ratio is 1.55—this suggests active orders being filled still favor buyers. That signal goes against the bearish read; it’s something to spell out at the end.
Bring it back to key levels.
First, the short side focus zone: 0.10894-0.1095. It’s more suitable for waiting for confirmation after the rebound meets resistance, not for making an urgent judgment just because the current price is there.
If that range can cap price, then continue to view it bearish. If it closes with volume above 0.11031, the invalidation reference is right there—then “bearish” is done; don’t stubbornly hold the view.
Downside: 0.10332 is a continuation watch level. If it breaks down on increased volume, then look near 0.1025 support next. The reference risk-reward is about 4.1, and the structure still lines up.
The conditions are laid out. Trigger them, then act—don’t sprint ahead.
Say something harsh: the active buy/sell ratio of 1.55 means buyers are still relatively strong, which is directly at odds with the MACD bearish momentum. Not all signals are moving in the same direction.
Don’t listen to stories—watch the data. Right now it’s bulls and bears tearing each other apart, not a one-way market.
This post is just a sharing of market views and does not constitute trading advice. Leverage contract risks are on you.
Let me show the “bottom card”: the long position is still held in $FOGO . As long as the logic hasn’t broken, I won’t move.
For reference only; not investment advice. These are leveraged contracts, and investing involves risk.
This article is generated with assistance from Musk’s xAI Grok model.
$JST #Contract view
$JST bearish | Cap 0.10894 - 0.1095 | Break above 0.11031 and move on | Watch 0.10332
$JST this round, I’m bearish.
In the past 24 hours it’s up 2.62%, but the MACD has already flipped to bearish momentum. Open interest in the last 24 hours has also surged by 7.6%. The current price at 0.10894 is sitting right along the upper Bollinger Band at 0.1095—this combination feels more like a pull-up that amplifies disagreement than solid fuel for continued upside.
Whether the pullback can or cannot hold down the 0.10894-0.1095 range will tell the story.
Zoom out to the structure.
The recent high is 0.11031, the low is 0.10332, and the current price is near the top edge of the range—just one step away from the ceiling.
Bollinger Bands: upper 0.1095, middle 0.106, lower 0.1025. When price rides the upper band like this, it often means short-term momentum is already overheated.
The Supertrend indicator is still pointing upward, and RSI 60.6 hasn’t reached the overbought zone, but the MACD has already turned bearish momentum. Trend indicators lag, while momentum turns first—this combo is worth watching closely.
Look at the funding side another way.
In the last 24 hours, volume is $6.55 million—fairly small for the “price,” but open interest is $5.4 million, and it’s still adding another 7.6% in the past 24 hours. Leverage is piled up more aggressively than the liquidity of spot.
Funding rate is +0.0050%. Longs pay a small premium to shorts; directionally there isn’t extreme imbalance.
Long accounts are 41%, with no clear unified direction. The active buy/sell ratio is 1.55—this suggests active orders being filled still favor buyers. That signal goes against the bearish read; it’s something to spell out at the end.
Bring it back to key levels.
First, the short side focus zone: 0.10894-0.1095. It’s more suitable for waiting for confirmation after the rebound meets resistance, not for making an urgent judgment just because the current price is there.
If that range can cap price, then continue to view it bearish. If it closes with volume above 0.11031, the invalidation reference is right there—then “bearish” is done; don’t stubbornly hold the view.
Downside: 0.10332 is a continuation watch level. If it breaks down on increased volume, then look near 0.1025 support next. The reference risk-reward is about 4.1, and the structure still lines up.
The conditions are laid out. Trigger them, then act—don’t sprint ahead.
Say something harsh: the active buy/sell ratio of 1.55 means buyers are still relatively strong, which is directly at odds with the MACD bearish momentum. Not all signals are moving in the same direction.
Don’t listen to stories—watch the data. Right now it’s bulls and bears tearing each other apart, not a one-way market.
This post is just a sharing of market views and does not constitute trading advice. Leverage contract risks are on you.
Let me show the “bottom card”: the long position is still held in $FOGO . As long as the logic hasn’t broken, I won’t move.
For reference only; not investment advice. These are leveraged contracts, and investing involves risk.
This article is generated with assistance from Musk’s xAI Grok model.
$JST #Contract view