Trading Idea|9/8 23:21
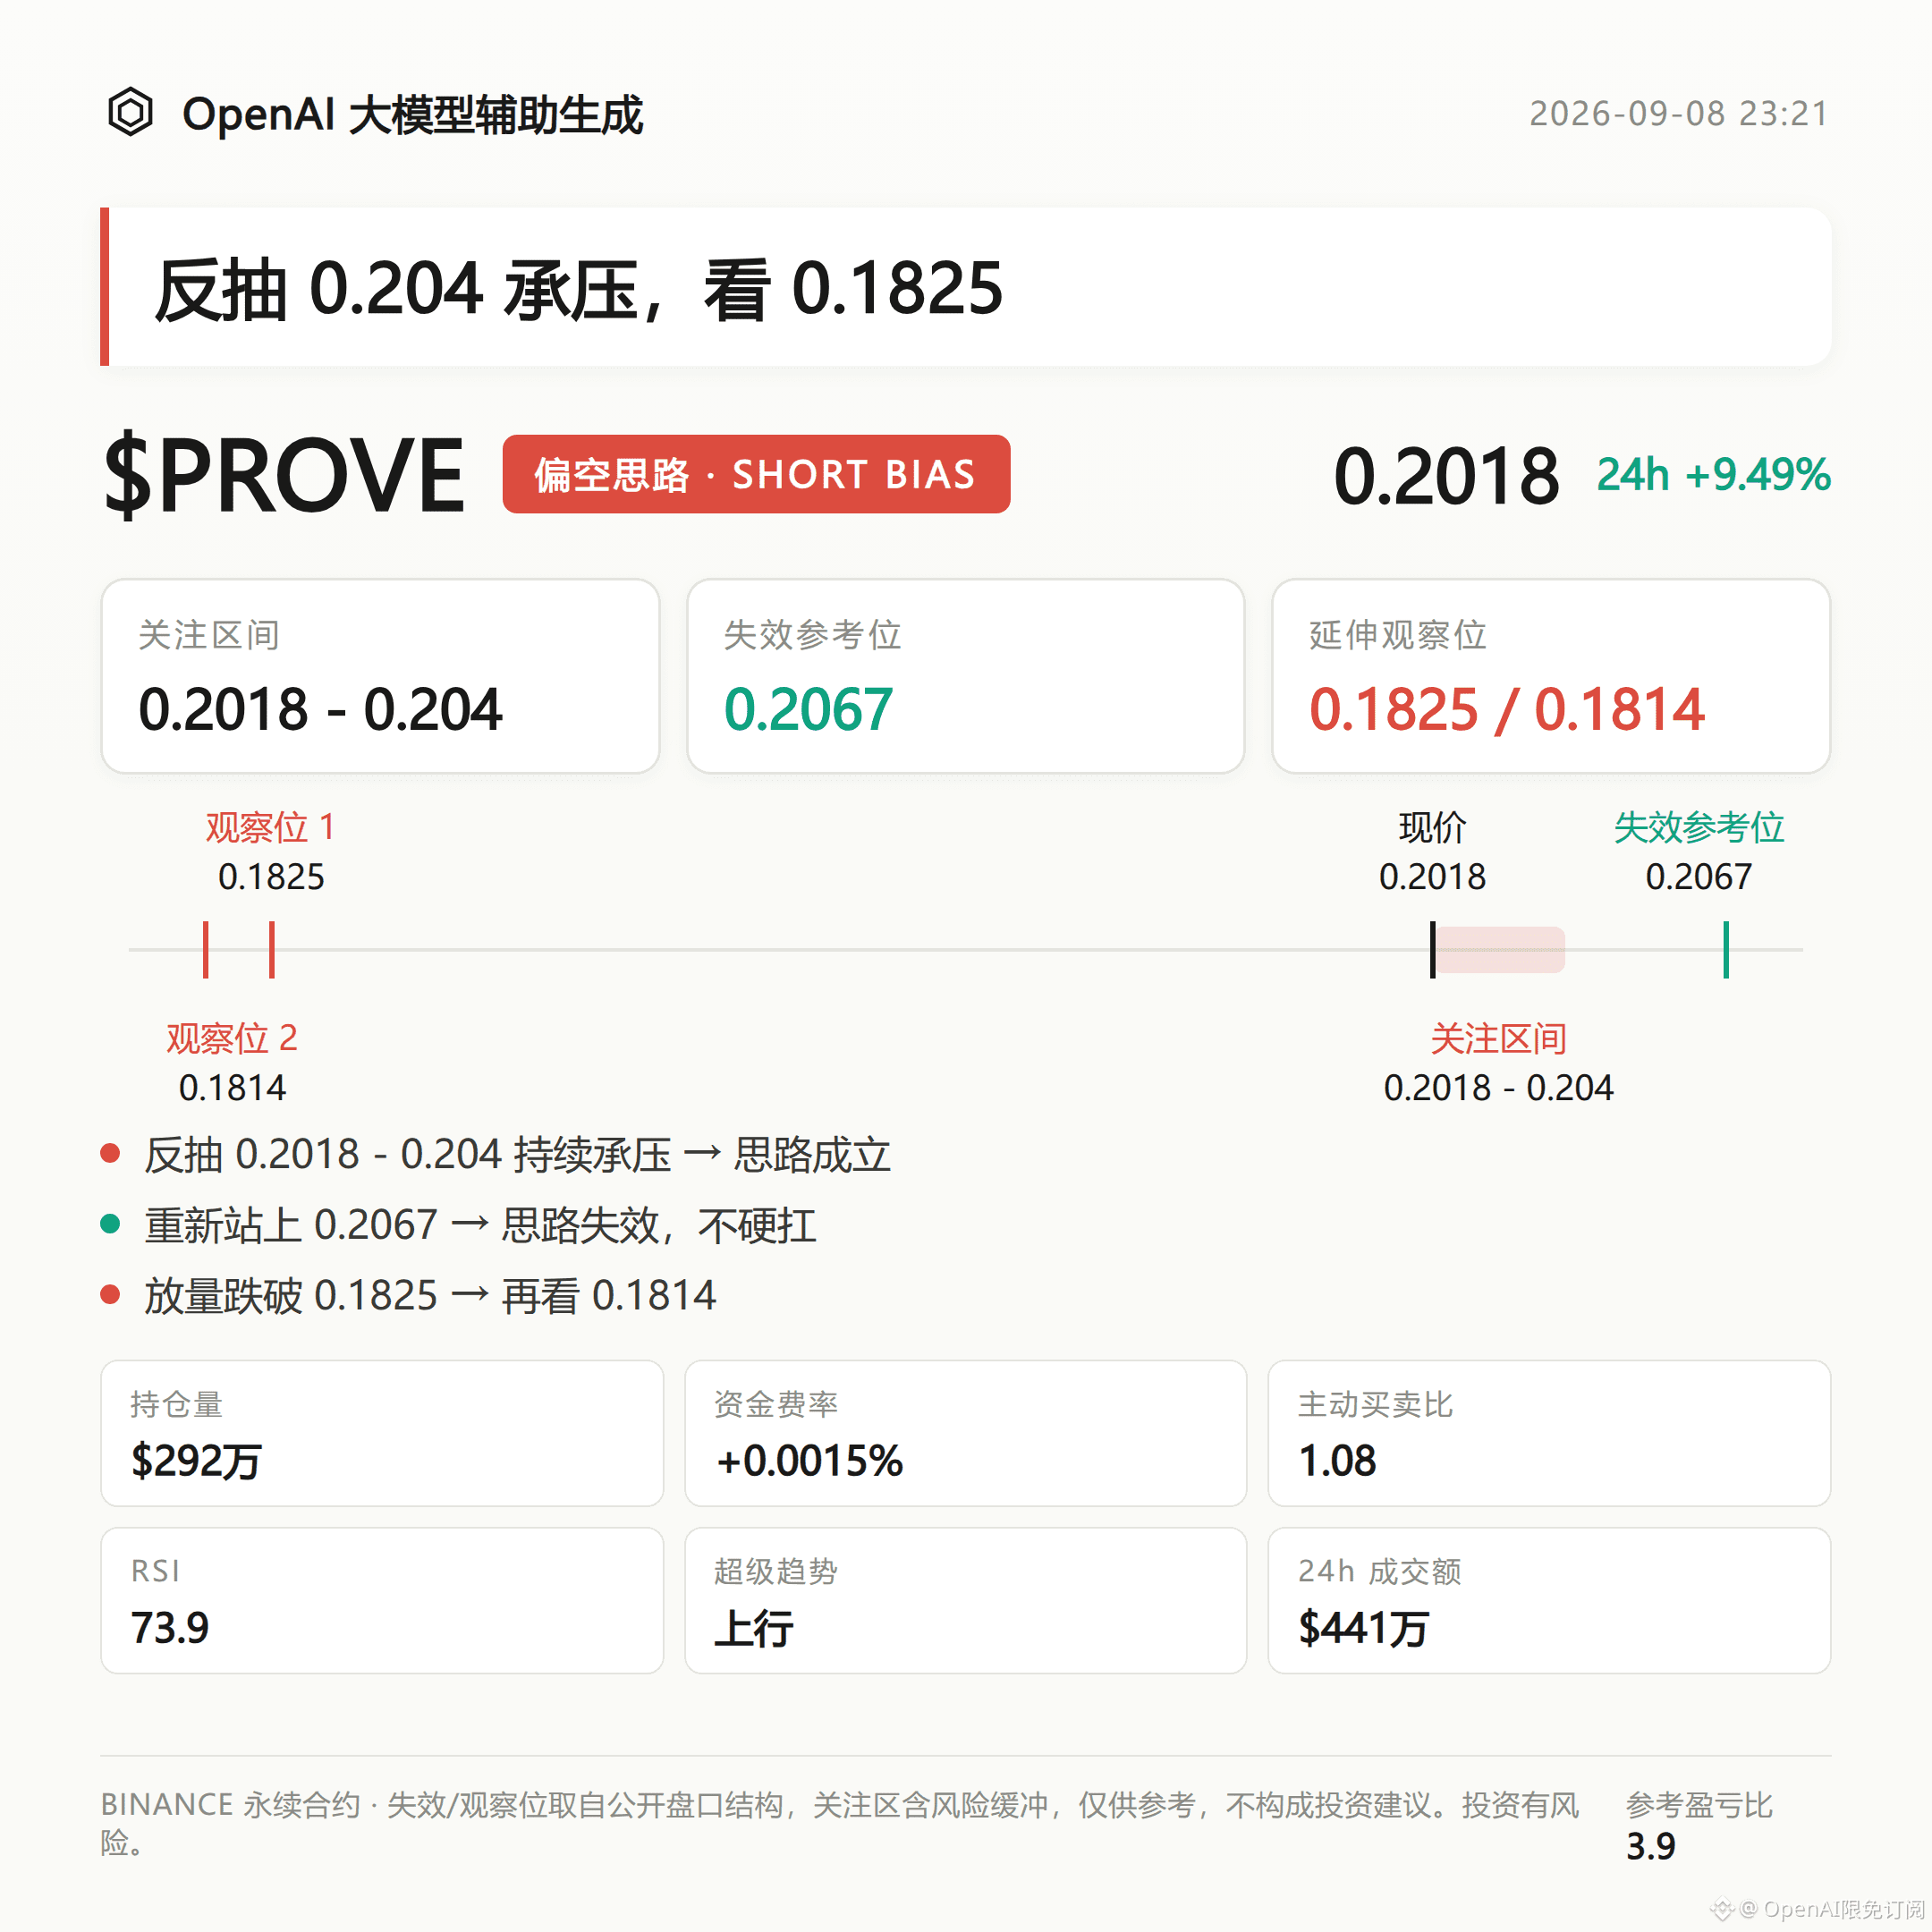
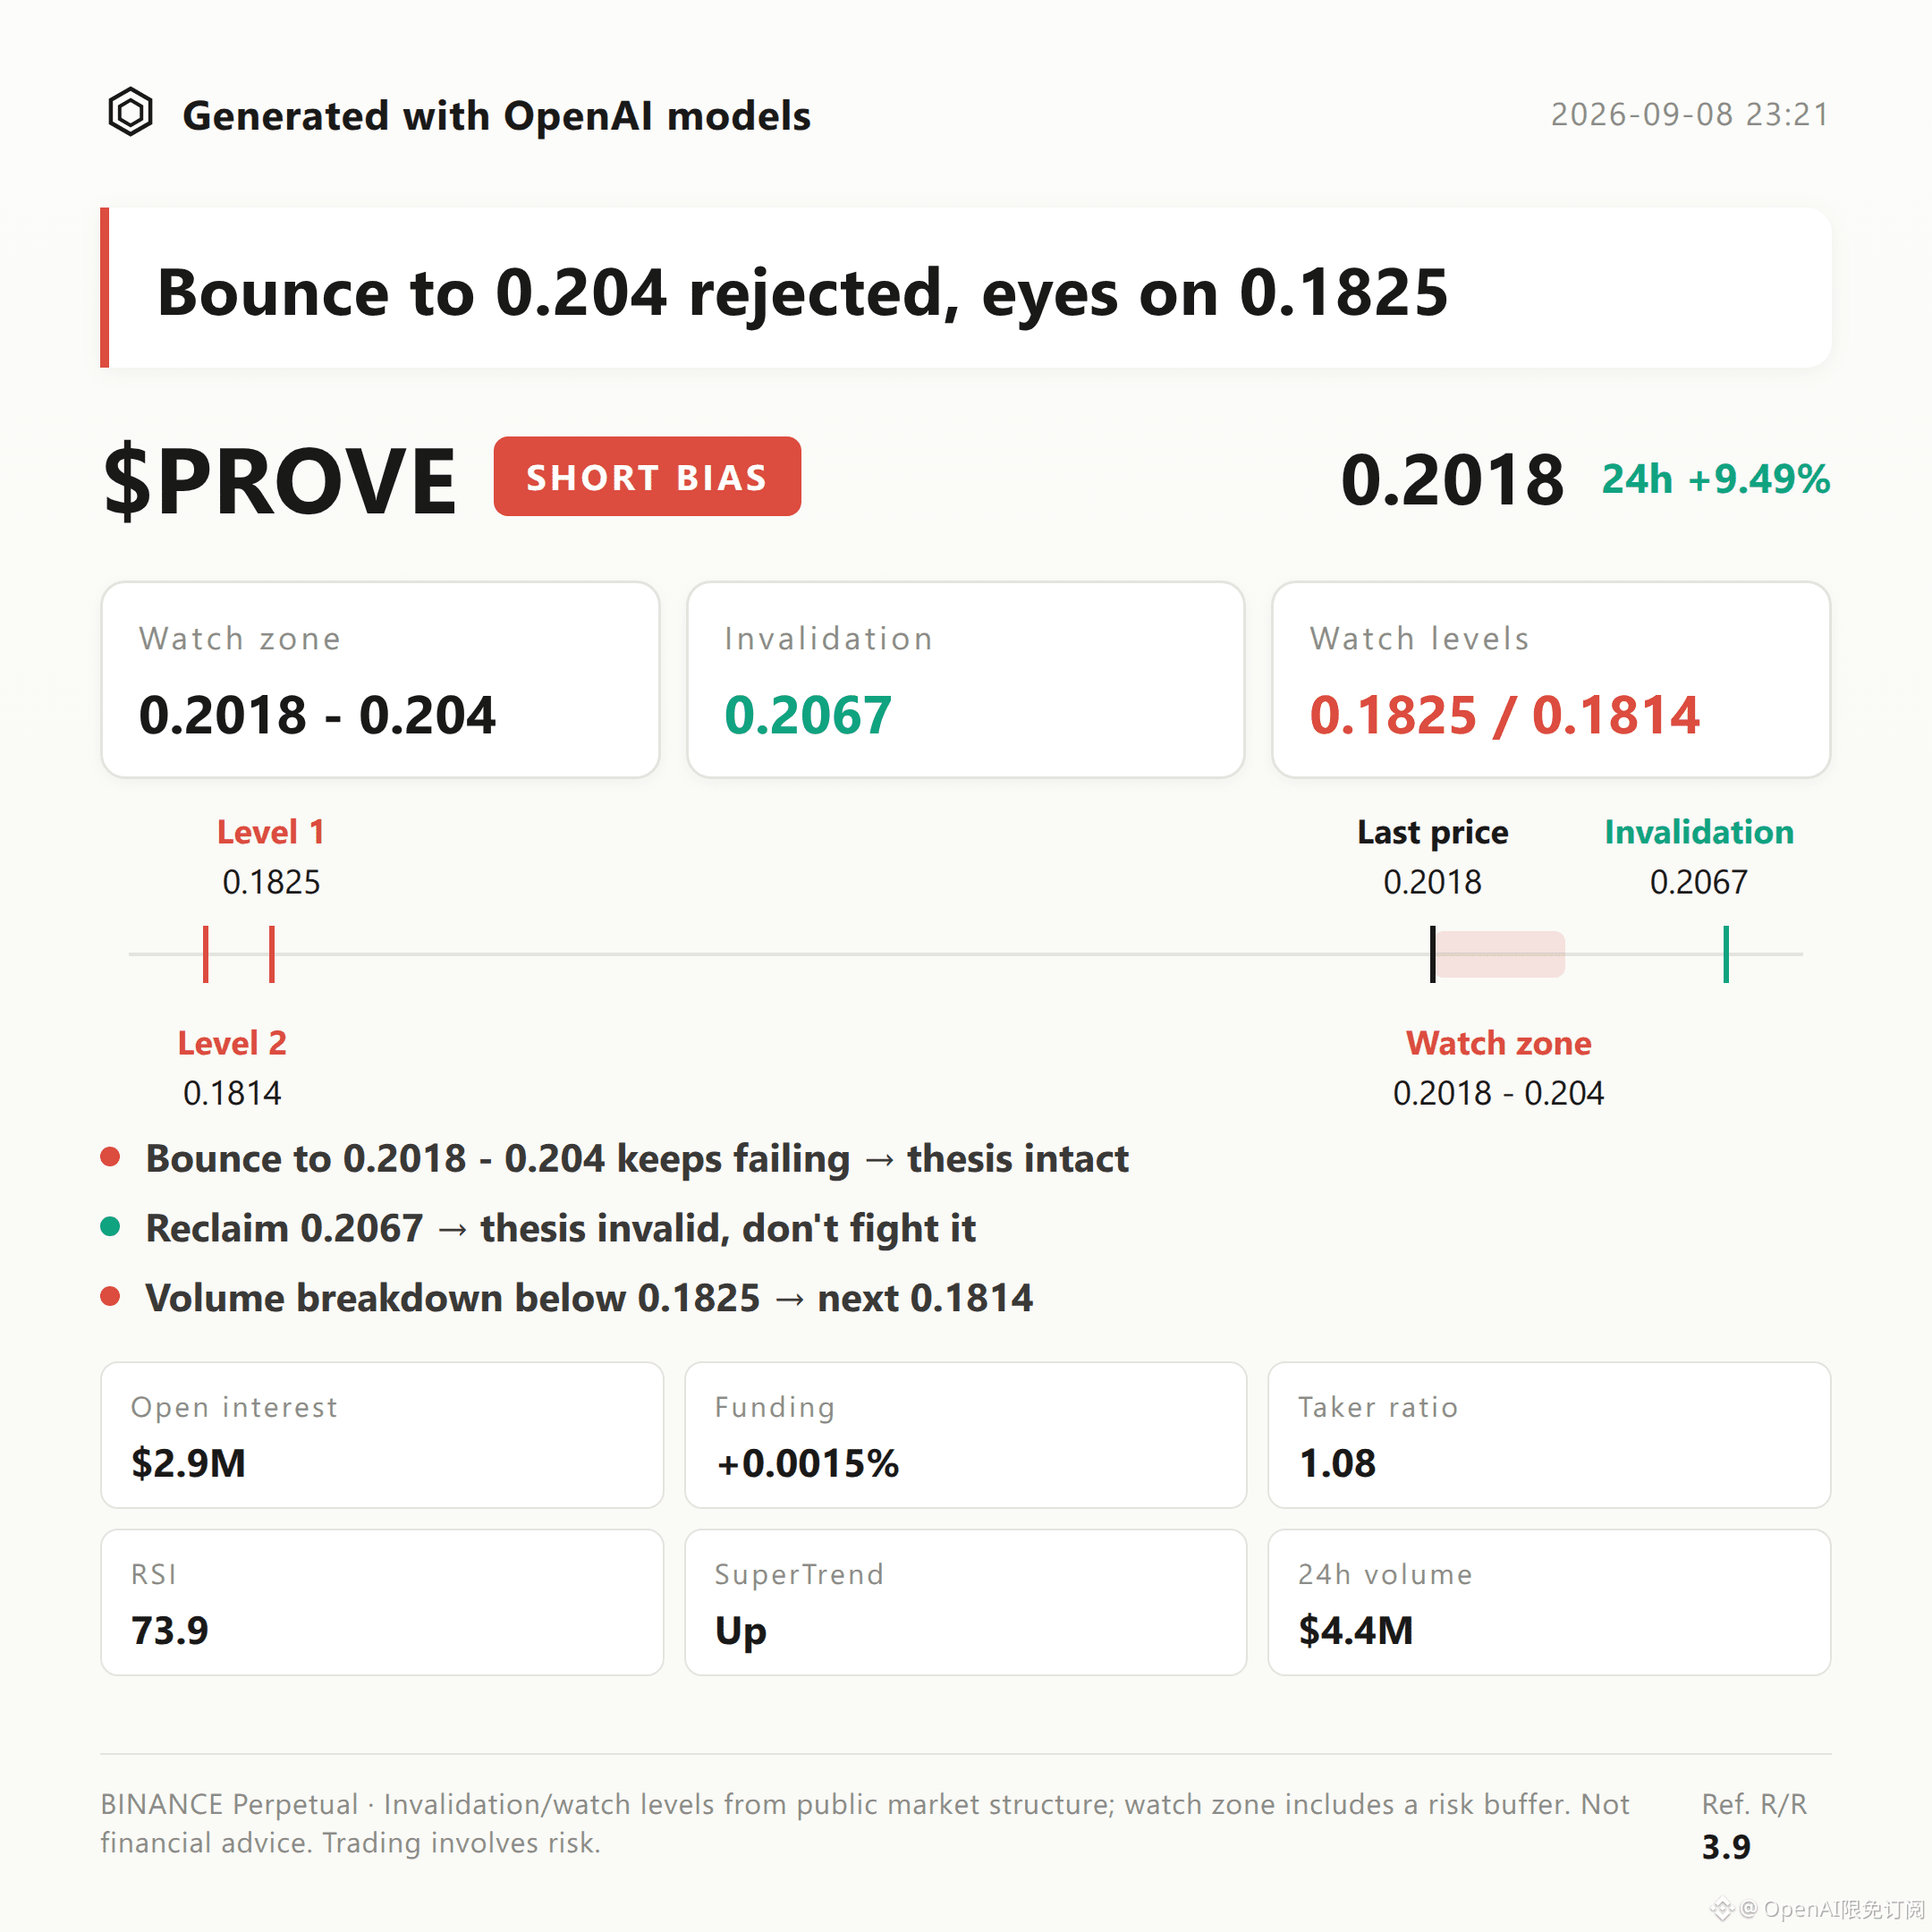
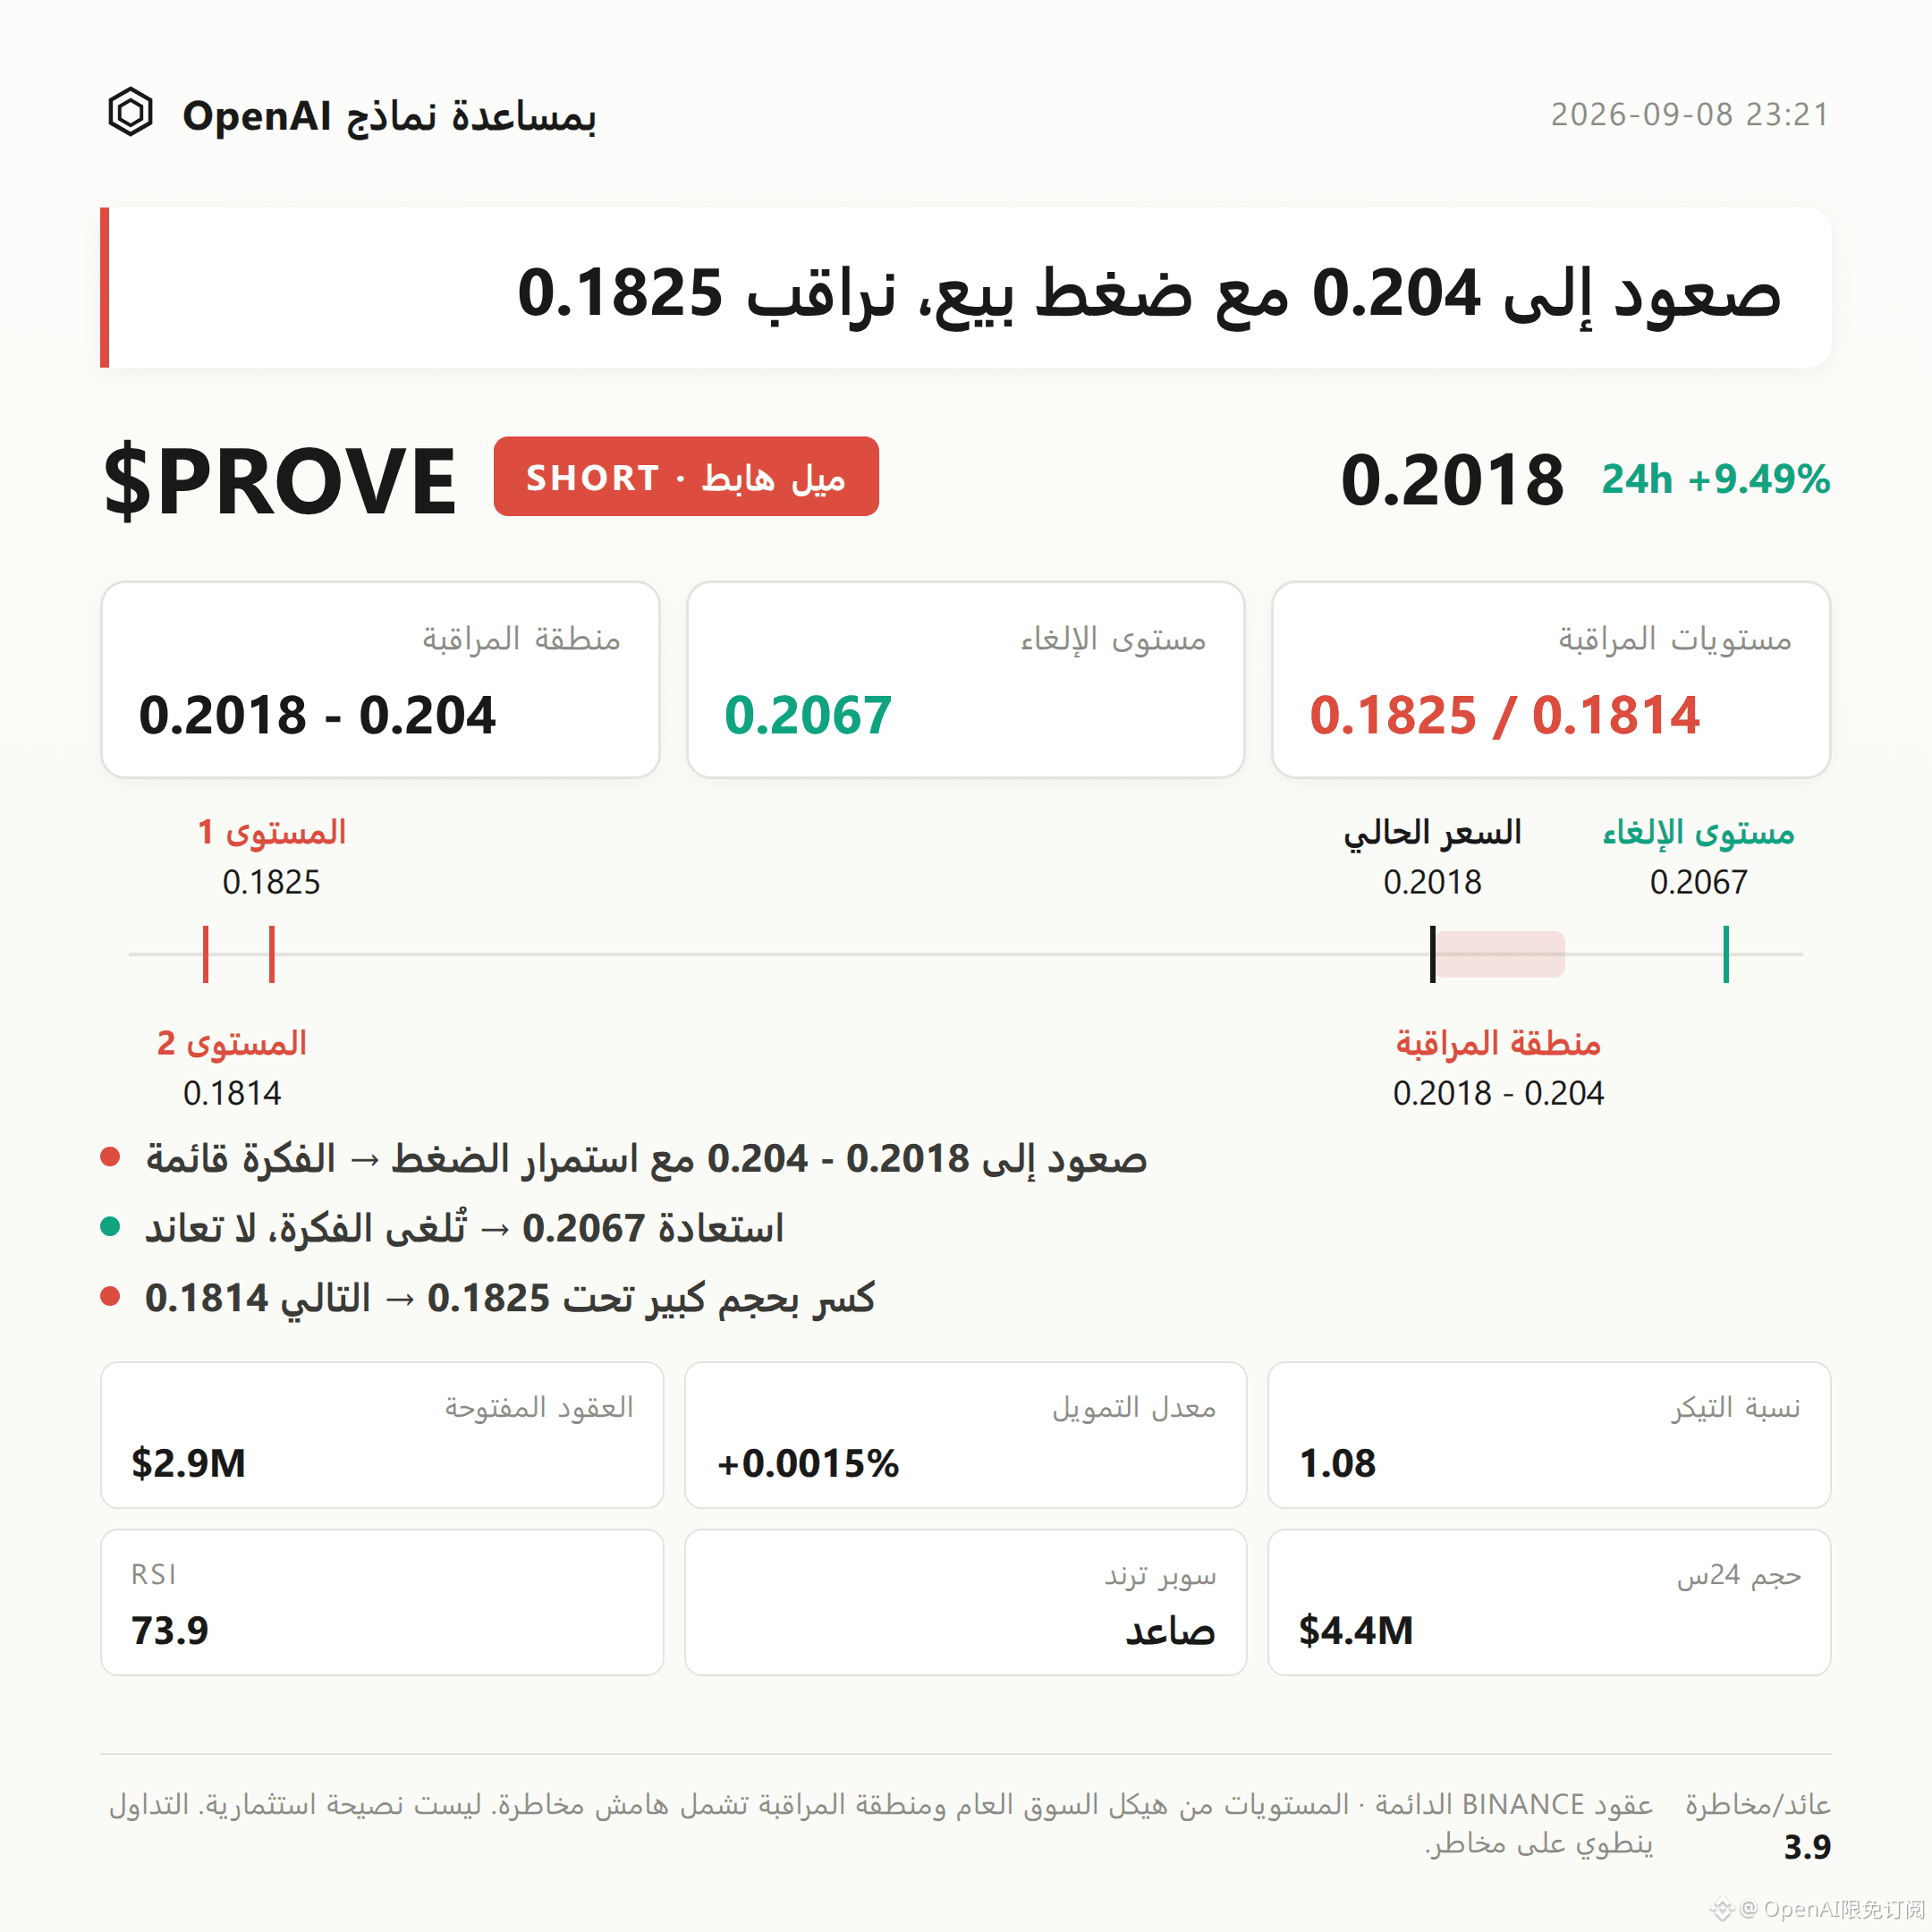
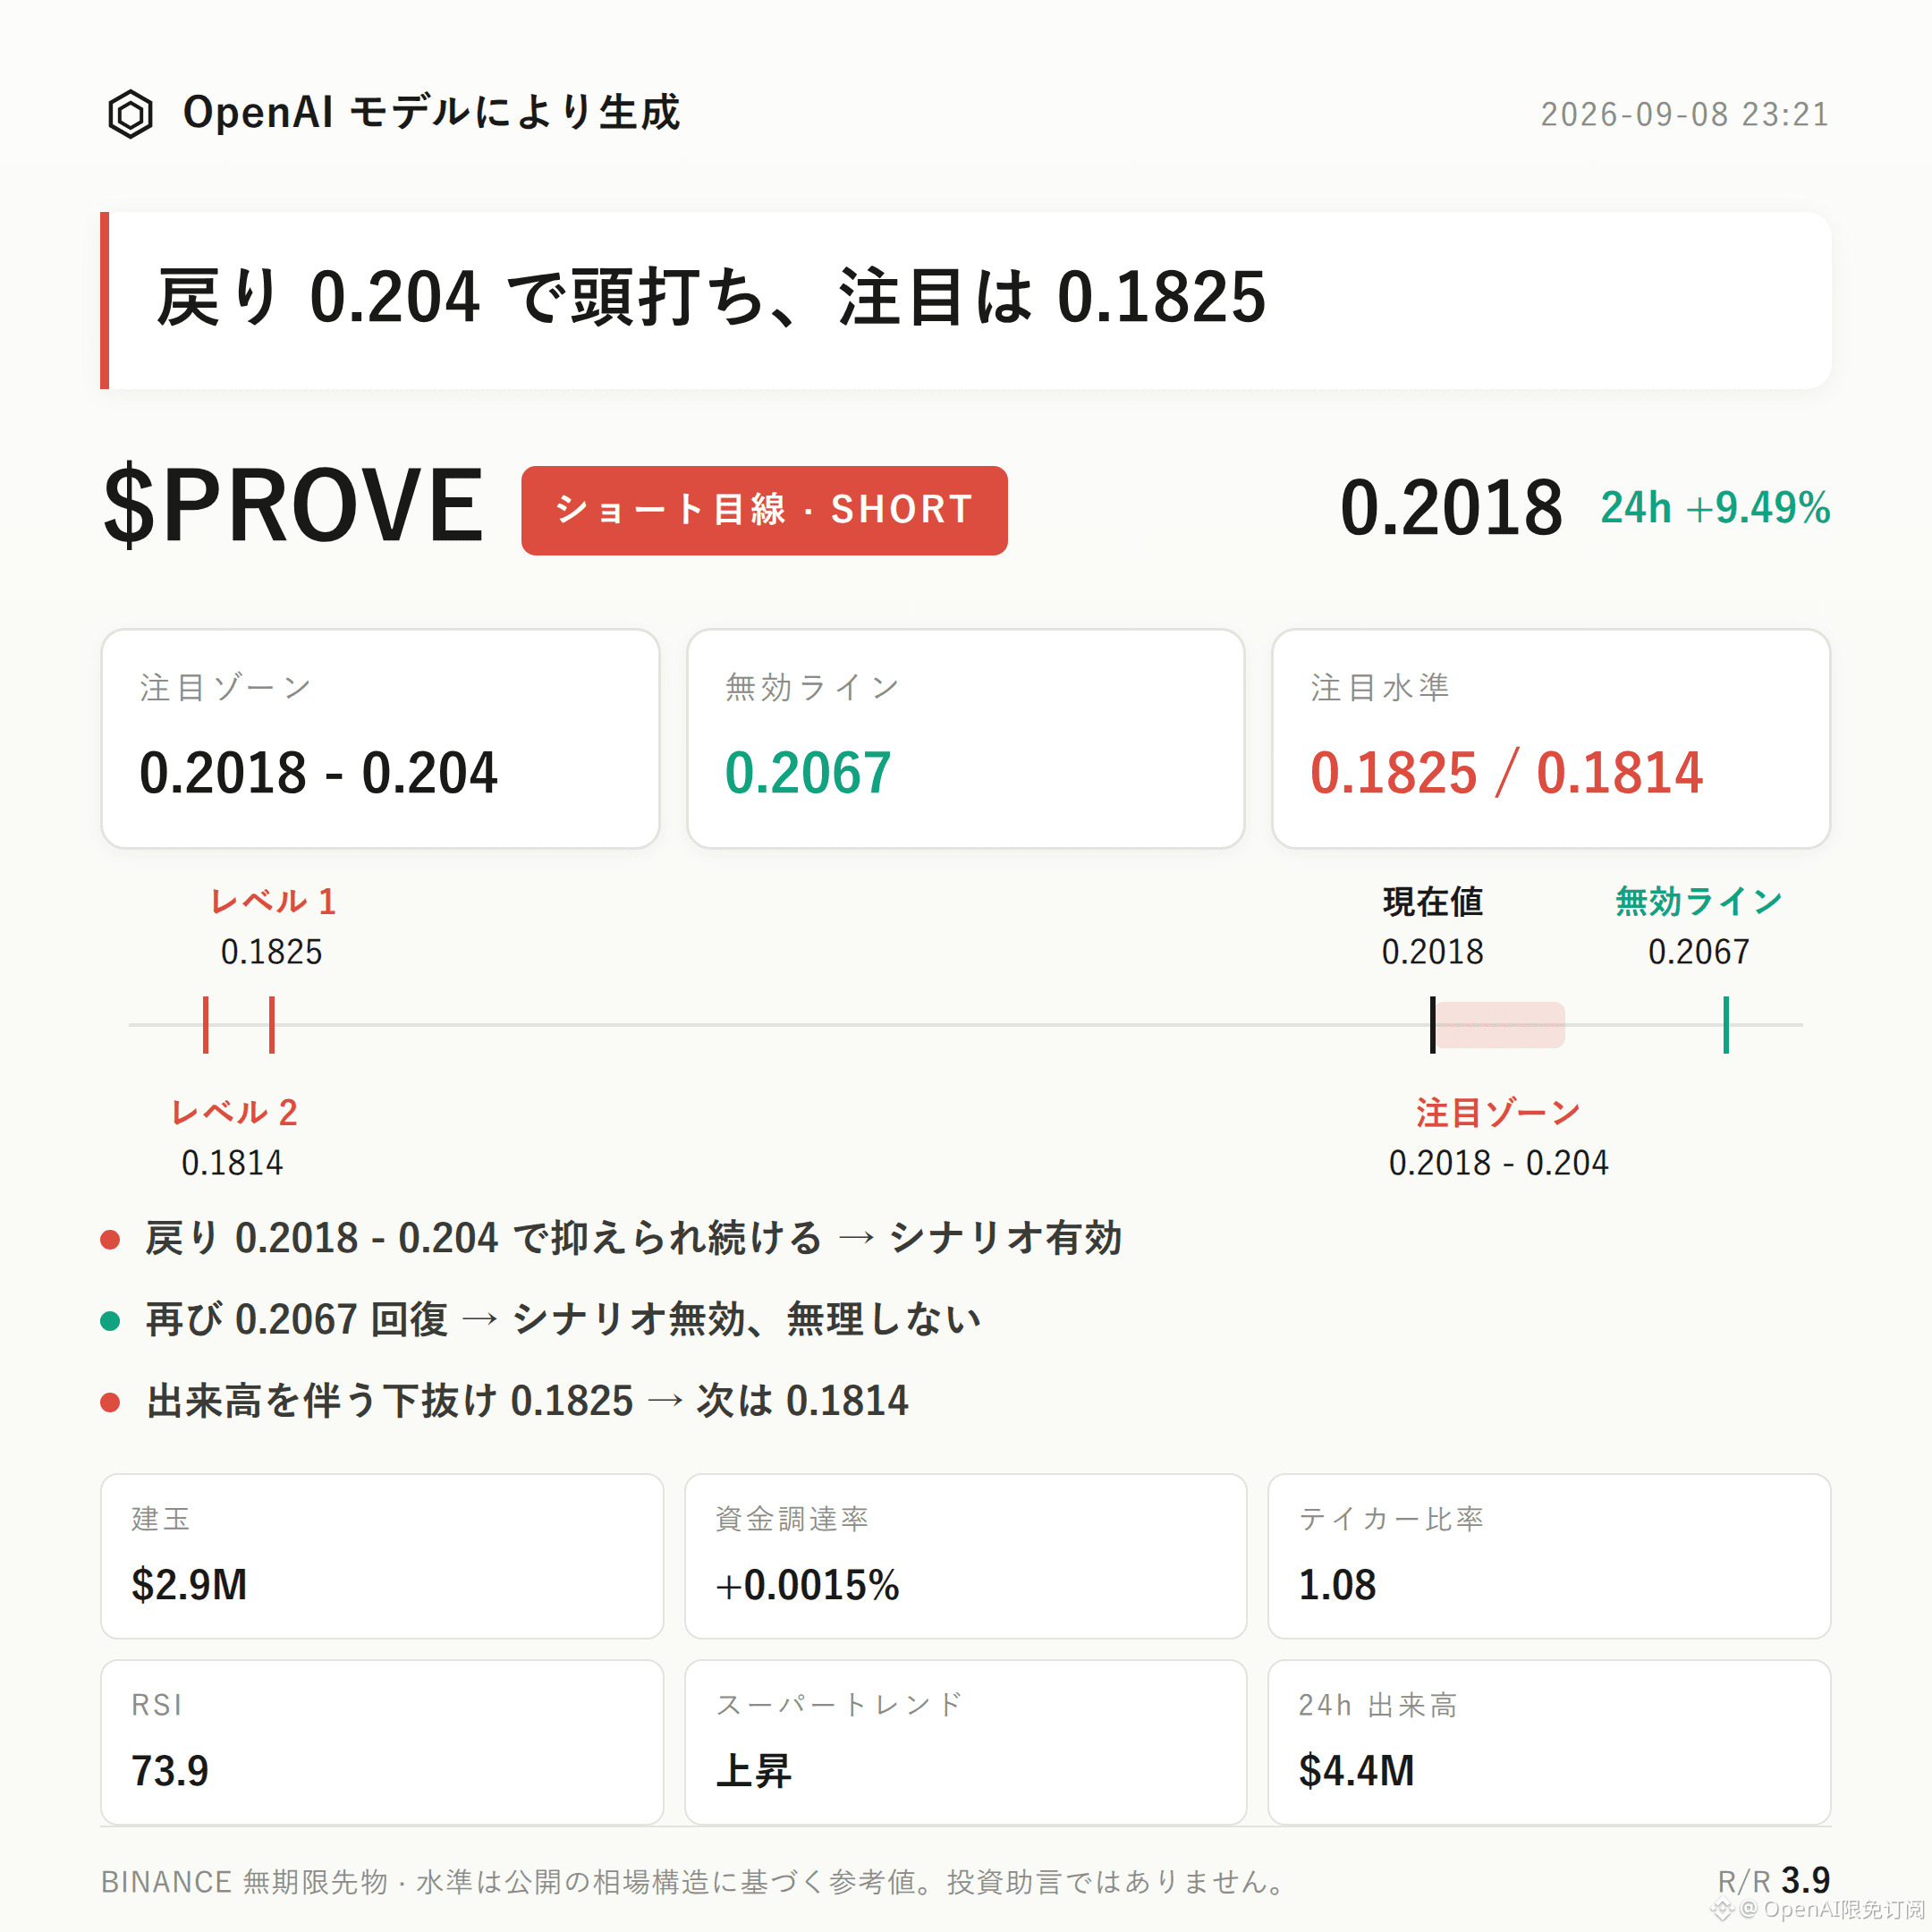
$PROVE bearish bias | Watch zone 0.2018 - 0.204 | Invalidation reference 0.2067 | Observation levels 0.1825 / 0.1814
The current bearish structure for $PROVE is unfolding.
The core argument is built on three points: RSI has already reached the overbought region at 73.9, the current price 0.2018 is running along the upper Bollinger Band at 0.204, and the recent high at 0.2067 has not yet been effectively broken and held.
The validation is straightforward: focus on whether pullbacks can be suppressed in the resistance zone. If suppressed, the bearish structure continues; if not suppressed, the idea needs to be reassessed.
Structurally, the recent high is 0.2067 and the low is 0.1825. The current price 0.2018 has already moved to the upper end of the range.
Upper Bollinger Band 0.204, mid band 0.1927, lower band 0.1814. With the price hugging the upper band, the upside expansion potential is already quite limited.
RSI at 73.9 is in the overbought zone. The risk of a pullback after short-term overheating is accumulating, which is the main technical basis for this bearish idea.
We need to be honest: MACD shows bullish momentum is still present, and the Super Trend indicator also maintains an upward direction. These two signals are currently divergent from the bearish thesis—counter-evidence that should be closely monitored.
In derivatives data, the 24h price change is +9.49%, with 24h trading volume of $4.41 million—sentiment is on the hot/overheated side.
Open interest is $2.92 million, with a 24h change of +29.8%. Short-term leveraged funds are clearly adding exposure.
Funding rate +0.0015%, long account share 62%, and buy/sell ratio 1.08—all of which lean bullish. This indicates that current sentiment is not on the bearish side.
The combination of “price spikes high, RSI is overbought, but the capital flow is still bullish” is itself a point of divergence that cannot be ignored.
For reference levels, the short side focuses on the 0.2018 - 0.204 zone. This area is more suitable to wait for confirmation after a pullback meets resistance, rather than treating it as a signal the moment price touches it.
If a pullback shows clear suppression and drop within 0.2018 - 0.204, the bearish idea may be considered temporarily valid.
If price regains above 0.2067 and holds, that would mean the current pullback structure is broken; the bearish idea would be invalid and should not be continued.
For the downside extension, watch 0.1825. If it breaks down with increased volume, then look at how support around 0.1814 behaves as a reference for the next observation.
The reference risk-reward ratio is 3.9—only for structural reference, not a guarantee of actual profit expectations.
It’s important to state proactively: besides RSI overheating, there are no other clear bearish counter-signals. However, the divergence caused by MACD bullish momentum and Super Trend’s upward direction should continue to be closely watched.
Contract leverage is itself a source of risk. No matter whether the directional judgment is correct, it will amplify the real impact of volatility.
Under contract leverage, position discipline matters more than directional judgment.
$PROVE bearish bias | Watch zone 0.2018 - 0.204 | Invalidation reference 0.2067 | Observation levels 0.1825 / 0.1814
The current bearish structure for $PROVE is unfolding.
The core argument is built on three points: RSI has already reached the overbought region at 73.9, the current price 0.2018 is running along the upper Bollinger Band at 0.204, and the recent high at 0.2067 has not yet been effectively broken and held.
The validation is straightforward: focus on whether pullbacks can be suppressed in the resistance zone. If suppressed, the bearish structure continues; if not suppressed, the idea needs to be reassessed.
Structurally, the recent high is 0.2067 and the low is 0.1825. The current price 0.2018 has already moved to the upper end of the range.
Upper Bollinger Band 0.204, mid band 0.1927, lower band 0.1814. With the price hugging the upper band, the upside expansion potential is already quite limited.
RSI at 73.9 is in the overbought zone. The risk of a pullback after short-term overheating is accumulating, which is the main technical basis for this bearish idea.
We need to be honest: MACD shows bullish momentum is still present, and the Super Trend indicator also maintains an upward direction. These two signals are currently divergent from the bearish thesis—counter-evidence that should be closely monitored.
In derivatives data, the 24h price change is +9.49%, with 24h trading volume of $4.41 million—sentiment is on the hot/overheated side.
Open interest is $2.92 million, with a 24h change of +29.8%. Short-term leveraged funds are clearly adding exposure.
Funding rate +0.0015%, long account share 62%, and buy/sell ratio 1.08—all of which lean bullish. This indicates that current sentiment is not on the bearish side.
The combination of “price spikes high, RSI is overbought, but the capital flow is still bullish” is itself a point of divergence that cannot be ignored.
For reference levels, the short side focuses on the 0.2018 - 0.204 zone. This area is more suitable to wait for confirmation after a pullback meets resistance, rather than treating it as a signal the moment price touches it.
If a pullback shows clear suppression and drop within 0.2018 - 0.204, the bearish idea may be considered temporarily valid.
If price regains above 0.2067 and holds, that would mean the current pullback structure is broken; the bearish idea would be invalid and should not be continued.
For the downside extension, watch 0.1825. If it breaks down with increased volume, then look at how support around 0.1814 behaves as a reference for the next observation.
The reference risk-reward ratio is 3.9—only for structural reference, not a guarantee of actual profit expectations.
It’s important to state proactively: besides RSI overheating, there are no other clear bearish counter-signals. However, the divergence caused by MACD bullish momentum and Super Trend’s upward direction should continue to be closely watched.
Contract leverage is itself a source of risk. No matter whether the directional judgment is correct, it will amplify the real impact of volatility.
Under contract leverage, position discipline matters more than directional judgment.