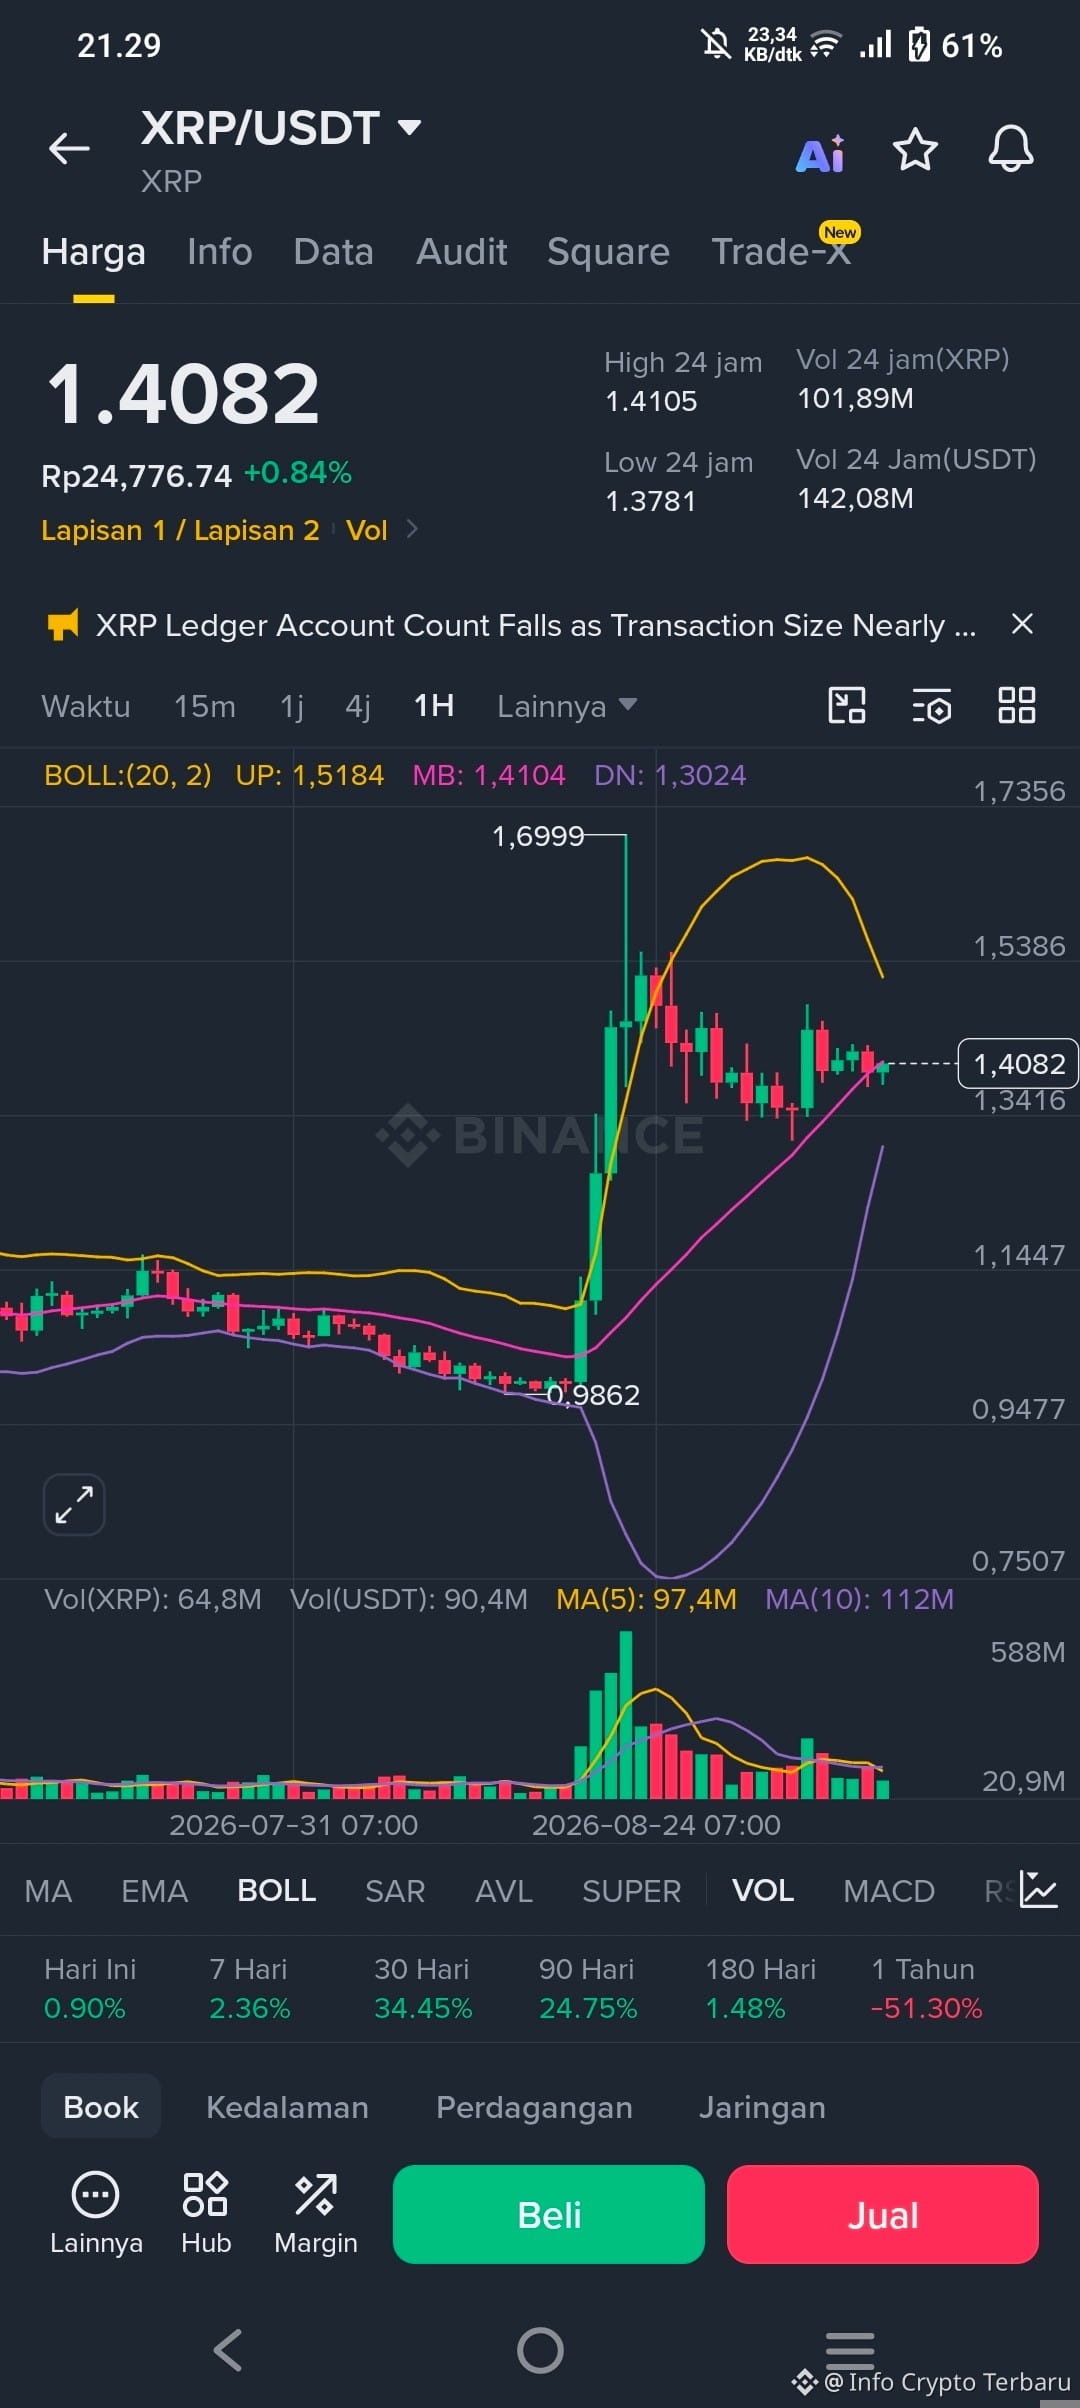
$XRP being traded near $1.40 after testing support at $1.38. This token maintains a constructive bullish bias while consolidating above a stack of Exponential Moving Averages (EMAs), suggesting an uptrend broadly supported even as a pullback from the recent new high occurs.
The Relative Strength Index (RSI) near 59 hints that momentum is slowing but still positive, while the Moving Average Convergence Divergence (MACD) has slipped slightly into negative territory, indicating that upward traction is weakening rather than breaking down.
🔥Initial resistance appears in the area of the downtrend line breakout around $1.42, where a daily close above it would reopen the path toward the respective highs at $1.50 and $1.70.
⛔On the downside, the first nearby support is the 200-day EMA near $1.36, with further cushioning at the 50-day EMA around $1.26 and the 100-day EMA near $1.24 if profit-taking deepens. As long as price holds above this EMA cluster, the larger bullish structure is likely to remain intact.
#UsCanadaTradeWar BitcoinETFsStill$1BShortIn2026$DEGO $OP
The Relative Strength Index (RSI) near 59 hints that momentum is slowing but still positive, while the Moving Average Convergence Divergence (MACD) has slipped slightly into negative territory, indicating that upward traction is weakening rather than breaking down.
🔥Initial resistance appears in the area of the downtrend line breakout around $1.42, where a daily close above it would reopen the path toward the respective highs at $1.50 and $1.70.
⛔On the downside, the first nearby support is the 200-day EMA near $1.36, with further cushioning at the 50-day EMA around $1.26 and the 100-day EMA near $1.24 if profit-taking deepens. As long as price holds above this EMA cluster, the larger bullish structure is likely to remain intact.
#UsCanadaTradeWar BitcoinETFsStill$1BShortIn2026$DEGO $OP