


Technical Situation Analysis (1h / 4h / 1D)
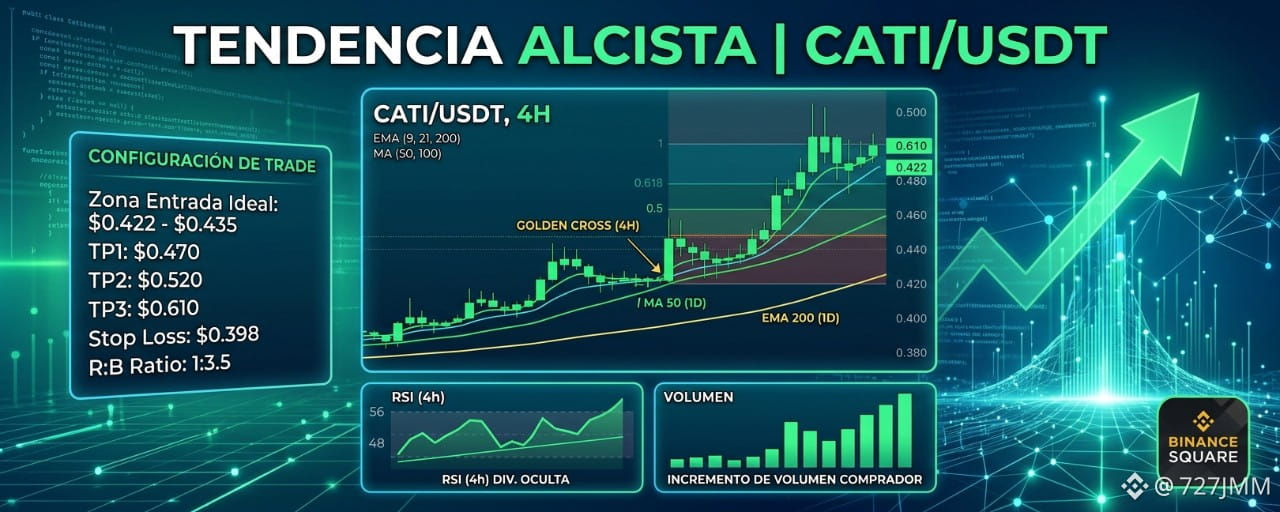
Structure: The pair has completed its re-accumulation phase after consolidating on a solid support at the 0.618 Fibonacci level, moving into a clean structure of higher lows.
EMAs & MAs: The EMA 9 has formed a Golden Cross over the EMA 21 on the 4H timeframe. On the daily chart (1D), the price respects the MA 50 ($0.415) and trades above the EMA 200 ($0.405), confirming demand dominance.
RSI & Volume: The RSI on 4H expands from 48 to 56 points without entering overbought territory, indicating a clear hidden bullish divergence. Buyer volume increased by 28% over the last confirmation candles.
Trade Setup Configuration
Range Level / Ideal Entry Price Zone $0.422 - $0.435 (Retest of the 21 EMA / 0.5 Fib)
TP1 (Conservative) $0.470 (Local resistance and liquidity start)
TP2 (Intermediate) $0.520 (Target at the 0.786 Fibonacci level)
TP3 (Moonshot) $0.610 (1.618 Fibonacci extension)
Stop Loss (SL) $0.398 (Technical invalidation below level $0.40 and the 200 EMA)
Reason for the Trade (Justification)
We enter based on the confluence of high-probability factors: dynamic rejection at the MA 50, bullish crossover of short-term moving averages (EMA 9/21), and an RSI accelerating in the expansion zone with rising volume. Risk/Reward ratio: 1:3.5.
#CATI #CryptoAnalysis #BinanceSquare #TradingSignals #TechnicalAnalysis