

🔥 BTC ANALYSIS SUMMARY: EUROPEAN SESSION CLOSES WITH AN INCLINATION TOWARD THE U.S. SESSION 🔥
📊 Real-time market data:
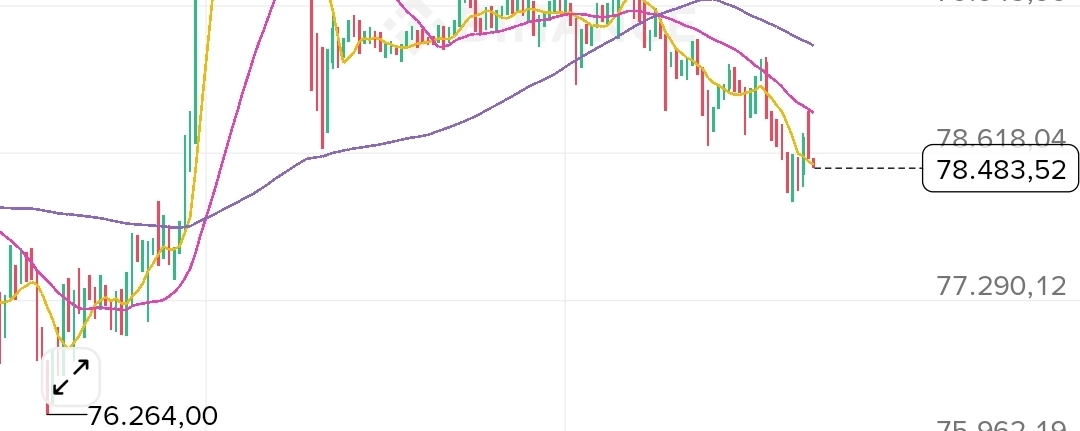
• Current BTC/USDT price: 78,483.52 USD 📉 (-1.04% in 24h)
🛑 1. SUMMARY OF THE EUROPEAN SESSION DEVELOPMENTS
• Price Action: BTC has been weakening continuously after being strongly rejected at the short-term peak zone of 82,300 USD. A surge in selling pressure in the final phase of the European session has pushed the price to officially break through the important psychological support level of 78,500 USD.
• Technical structure (H1 framework): The price is completely below 3 moving averages—MA(7) at 78.516, MA(25) at 78.980, and MA(99) at 79.586. All MA lines are sloping downward, confirming that the Bears hold an absolute advantage.
• Momentum indicator (MACD): Deep red Volume bars are prolonged below the 0 level. The DIF (-255.39) cuts far below the DEA (-234.17) and the gap is widening. The short-term downtrend momentum shows no signs of stopping.
🌍 2. MACRO BACKDROP FOR THE US SESSION
• The financial market reacted negatively to US employment data rising by 162k in August.
• The probability that the Fed will raise rates by another 25 basis points on September 16 has jumped to 58.4% - 60%. The DXY index and US bond yields rising strongly are weighing on Bitcoin.
🎯 3. STRATEGIC DIRECTION FOR THE US SESSION
Technical levels to note:
• Near resistance: 78.800 – 79.200 USD (Overlap zone of MA7 and MA25)
• Strong resistance: 79.800 – 80.100 USD (The former bottom zone that has just been broken)
• Strong support: 76.264 USD (Accumulation bottom on 03/09)
Trading scenario:
• Scenario 1 (Priority): In the US session, the price cannot rebound above 78.800 USD, triggering continued sell-off pressure. The price target quickly heads toward the strong support zone 76.264 USD.
• Scenario 2 (Bull trap): The price retraces to test the 79.200 - 79.600 USD zone with low Volume, then continues to reverse sharply downward.
💡 ACTION RECOMMENDATION
1. Absolutely DO NOT buy the bottom early when the H1 structure has no clear reversal signals.
2. Short strategy (Sell): Wait for a rebound up to 79.200 – 79.800 USD. If a long-wick candle or rejection appears, open a Short position. Absolute Stoploss (SL) at 80.200 USD.
3. Long strategy (Buy): Be patient and wait for the price to drop clearly into the strong support area 76.200 – 76.500 USD. If a pullback signal forms a new bottom, consider buying to catch a short-term rebound.
*Note: This analysis is based on real-time technical data for reference only, not investment advice.
#BTC #Bitcoin #Crypto #Binance #BTCUSDT #TechnicalAnalysis #Tradex #CryptoNews #CryptoTrading
