🔴 $ZEN · Hour Frame 1H
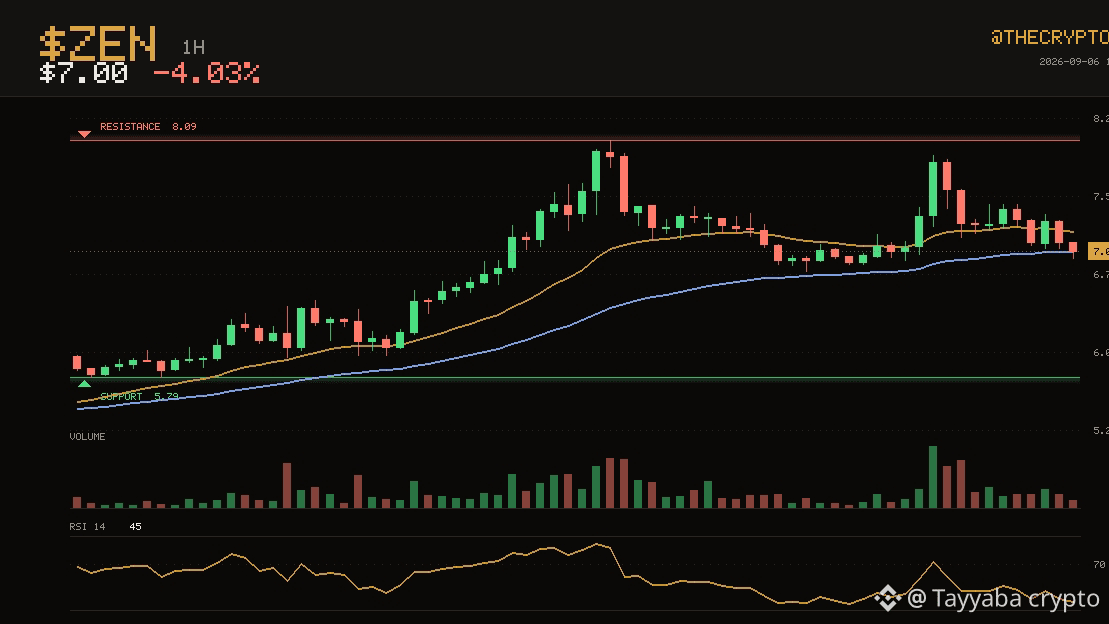
The current price is at 7.00$, and $ZEN is still trading below the moving averages that previously formed resistance for the price.
Over the past three days, the price has moved within a range between 5.79$ as support and 8.09$ as resistance, while it is currently near the middle of this range.
📊 The 20-day moving average is still above the 50 for a long time now, which is a signal worth monitoring.
The RSI indicator is at 45, meaning momentum is currently neutral and provides no clear advantage for either upward or downward movement.
In the past 24 hours, $ZEN has traded between 6.82$ and 7.93$, and the price is now close to the lower end of the range.
📈 Trading volume over the last 24 hours was about 1.9 times the usual average, while the coin fell by around 4.0% during the same period.
The price is facing an important zone… and a breakout or breakdown may determine the next move. 👀
DYOR — do your own research.
$ZEN #TechnicalAnalysis
The current price is at 7.00$, and $ZEN is still trading below the moving averages that previously formed resistance for the price.
Over the past three days, the price has moved within a range between 5.79$ as support and 8.09$ as resistance, while it is currently near the middle of this range.
📊 The 20-day moving average is still above the 50 for a long time now, which is a signal worth monitoring.
The RSI indicator is at 45, meaning momentum is currently neutral and provides no clear advantage for either upward or downward movement.
In the past 24 hours, $ZEN has traded between 6.82$ and 7.93$, and the price is now close to the lower end of the range.
📈 Trading volume over the last 24 hours was about 1.9 times the usual average, while the coin fell by around 4.0% during the same period.
The price is facing an important zone… and a breakout or breakdown may determine the next move. 👀
DYOR — do your own research.
$ZEN #TechnicalAnalysis