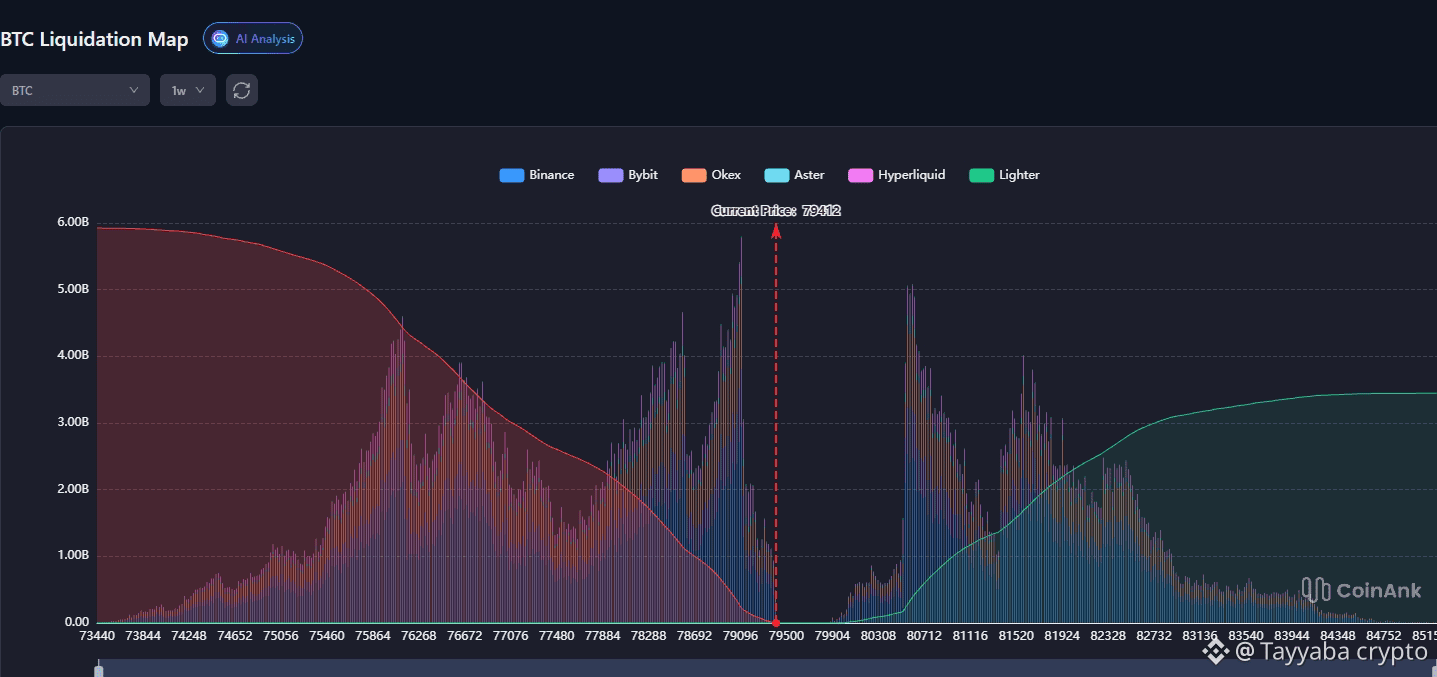
📊 BTC liquidation map
The weekly map is very clear, and liquidity is distributed strikingly between both sides.
🔻 There is a large block of buy-side liquidations (Longs) below the price, with dense clusters from the middle of the 76k to the late 78k range. This means bearish (downward) liquidity is still present and strong.
🔺 In contrast, selling leverage (Shorts) has started to build up again above the price. The first major liquidation cluster is near $80,700, with additional liquidity extending toward $81,500$ –$82,300.
The total shorts liquidation curve currently exceeds $3 billion 📈
Longs are stacked at the bottom…
While shorts are rebuilding their positions at the top. 👀
$BTCUSDT Perp
Price: 78,400.4$
-1.04%
#Bitcoin #BTC #trading
The weekly map is very clear, and liquidity is distributed strikingly between both sides.
🔻 There is a large block of buy-side liquidations (Longs) below the price, with dense clusters from the middle of the 76k to the late 78k range. This means bearish (downward) liquidity is still present and strong.
🔺 In contrast, selling leverage (Shorts) has started to build up again above the price. The first major liquidation cluster is near $80,700, with additional liquidity extending toward $81,500$ –$82,300.
The total shorts liquidation curve currently exceeds $3 billion 📈
Longs are stacked at the bottom…
While shorts are rebuilding their positions at the top. 👀
$BTCUSDT Perp
Price: 78,400.4$
-1.04%
#Bitcoin #BTC #trading