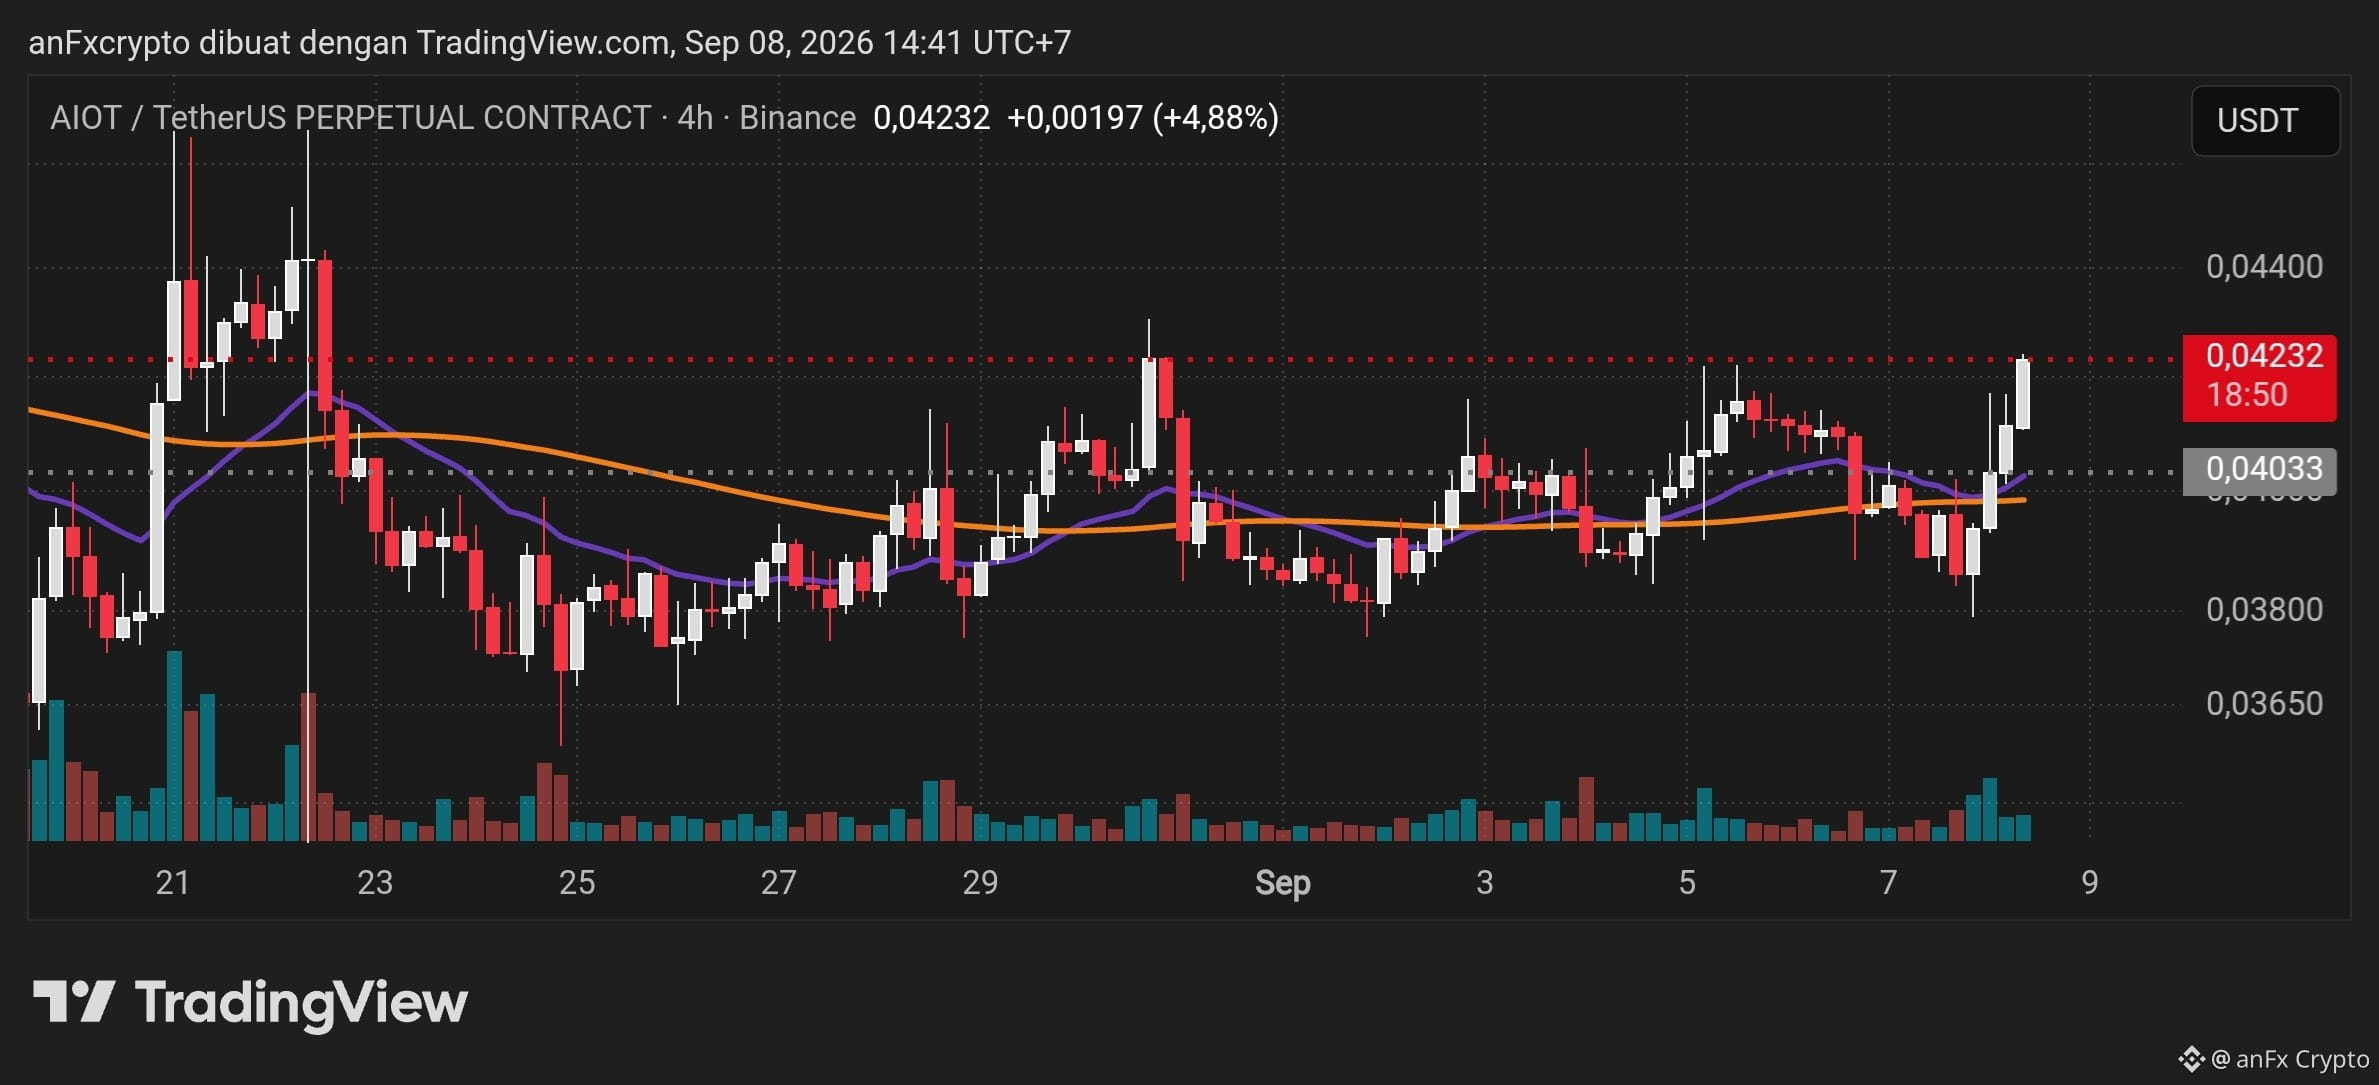
📊Technical Analysis ($AIOT /USDT Perpetuals - 4H Chart)
* Trend Structure: Price movement on the 4-hour timeframe shows an accumulation phase after experiencing a correction, where price is currently testing an important resistance area around $0.04232 with a daily increase of about +4.88%.
* Moving Average (MA) Indicator: The short-term MA line shows signs of a bullish crossover above the medium-term MA line, indicating that short-term momentum is starting to favor buyers.
* Volume: There appears to be an increase in buying volume on several of the last green candles, strengthening the validity of the current upward push.
* Key Levels:
* Resistance: $0.04300 – $0.04400
* Support: $0.04030 (EMA/MA area) and $0.03800 (lower support)
Trading Signal (Trading Setup)
* Bias: Bullish Momentum / Breakout Watch
* Execution Type: Buy on Breakout or Buy on Dip
Execution Plan:
🎯Entry Area (Buy):
* Alternative 1 (Conservative): Wait for a healthy correction (pullback) to the support/MA area around $0.04030 – $0.04100.
* Alternative 2 (Aggressive): Enter if a 4-hour candle close confirms a breakout above $0.04250.
🎯Take Profit (TP):
🟢TP 1: $0.04400 (previous local resistance)
🟢TP 2: $0.04650 (next target if volume keeps increasing)
🔴Stop Loss (SL):
* Place below the critical support level at $0.03950 to avoid false breakout risk.
Note: Always apply strict risk management and adjust your position size (position sizing) according to your risk profile.
* Trend Structure: Price movement on the 4-hour timeframe shows an accumulation phase after experiencing a correction, where price is currently testing an important resistance area around $0.04232 with a daily increase of about +4.88%.
* Moving Average (MA) Indicator: The short-term MA line shows signs of a bullish crossover above the medium-term MA line, indicating that short-term momentum is starting to favor buyers.
* Volume: There appears to be an increase in buying volume on several of the last green candles, strengthening the validity of the current upward push.
* Key Levels:
* Resistance: $0.04300 – $0.04400
* Support: $0.04030 (EMA/MA area) and $0.03800 (lower support)
Trading Signal (Trading Setup)
* Bias: Bullish Momentum / Breakout Watch
* Execution Type: Buy on Breakout or Buy on Dip
Execution Plan:
🎯Entry Area (Buy):
* Alternative 1 (Conservative): Wait for a healthy correction (pullback) to the support/MA area around $0.04030 – $0.04100.
* Alternative 2 (Aggressive): Enter if a 4-hour candle close confirms a breakout above $0.04250.
🎯Take Profit (TP):
🟢TP 1: $0.04400 (previous local resistance)
🟢TP 2: $0.04650 (next target if volume keeps increasing)
🔴Stop Loss (SL):
* Place below the critical support level at $0.03950 to avoid false breakout risk.
Note: Always apply strict risk management and adjust your position size (position sizing) according to your risk profile.