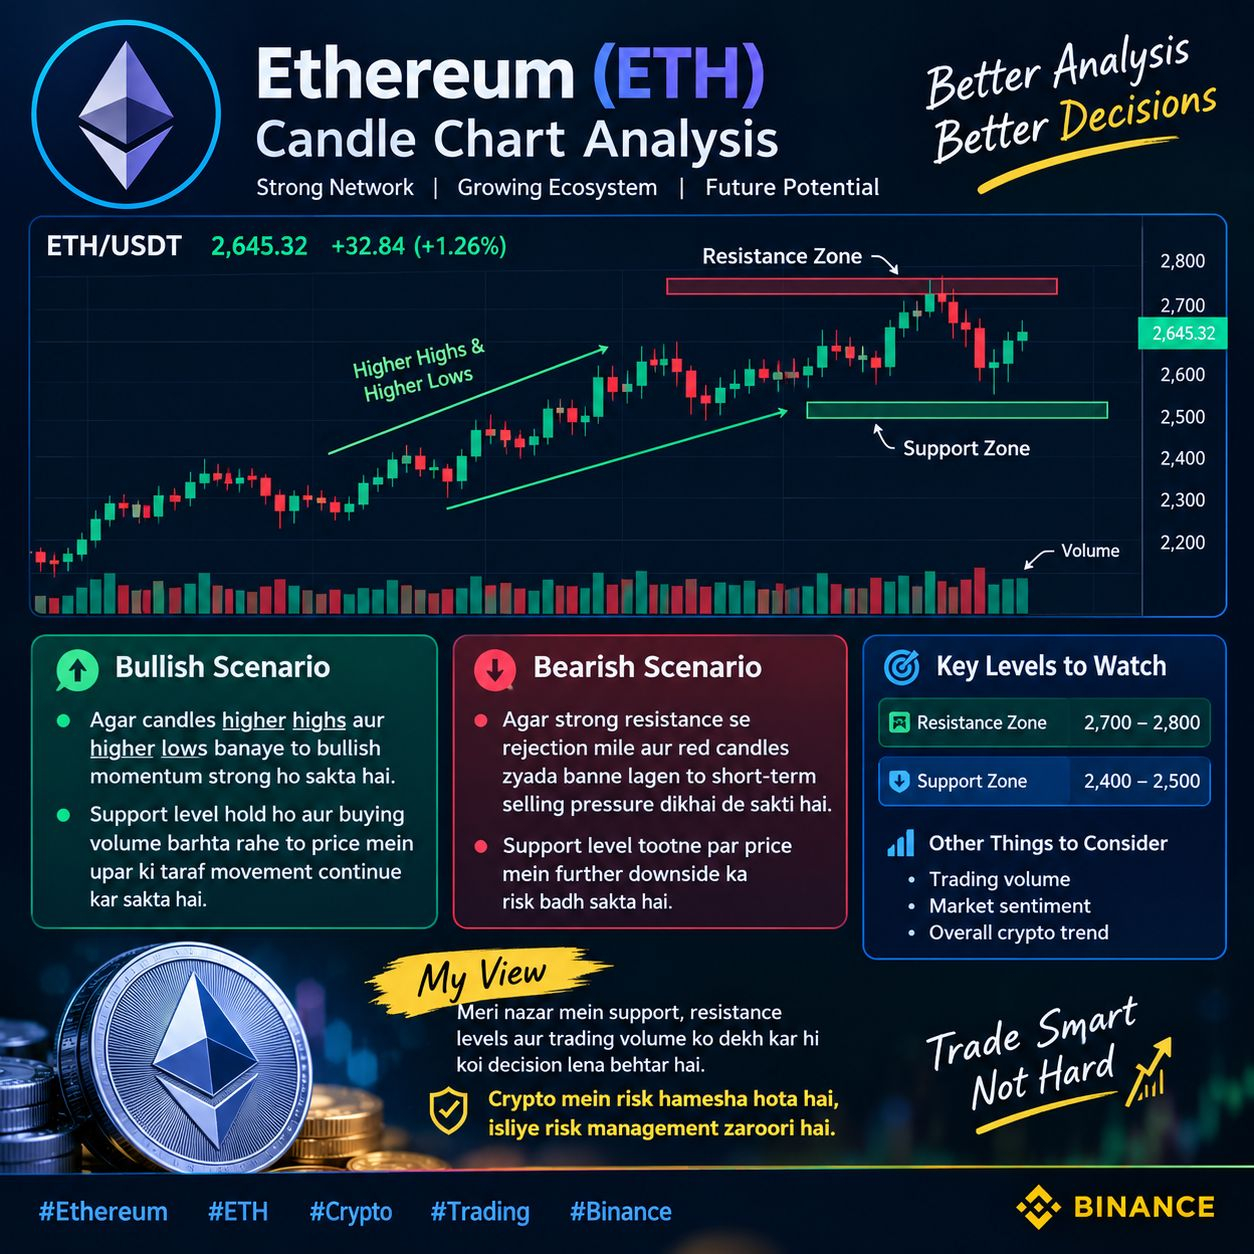
📊 Ethereum (ETH) – Short Candle Chart Analysis
If the price keeps making higher highs and higher lows in the ETH candlestick chart, it could be a sign of bullish momentum. On the other hand, rejection from strong resistance and large red candles may indicate short-term selling pressure.
📈 In my opinion, it’s better to make any decision by looking at support, resistance, and trading volume. There’s always risk in crypto, so risk management is necessary #YenBreaks155NearingYearHigh
If the price keeps making higher highs and higher lows in the ETH candlestick chart, it could be a sign of bullish momentum. On the other hand, rejection from strong resistance and large red candles may indicate short-term selling pressure.
📈 In my opinion, it’s better to make any decision by looking at support, resistance, and trading volume. There’s always risk in crypto, so risk management is necessary #YenBreaks155NearingYearHigh