Trading thesis|9/8 13:21
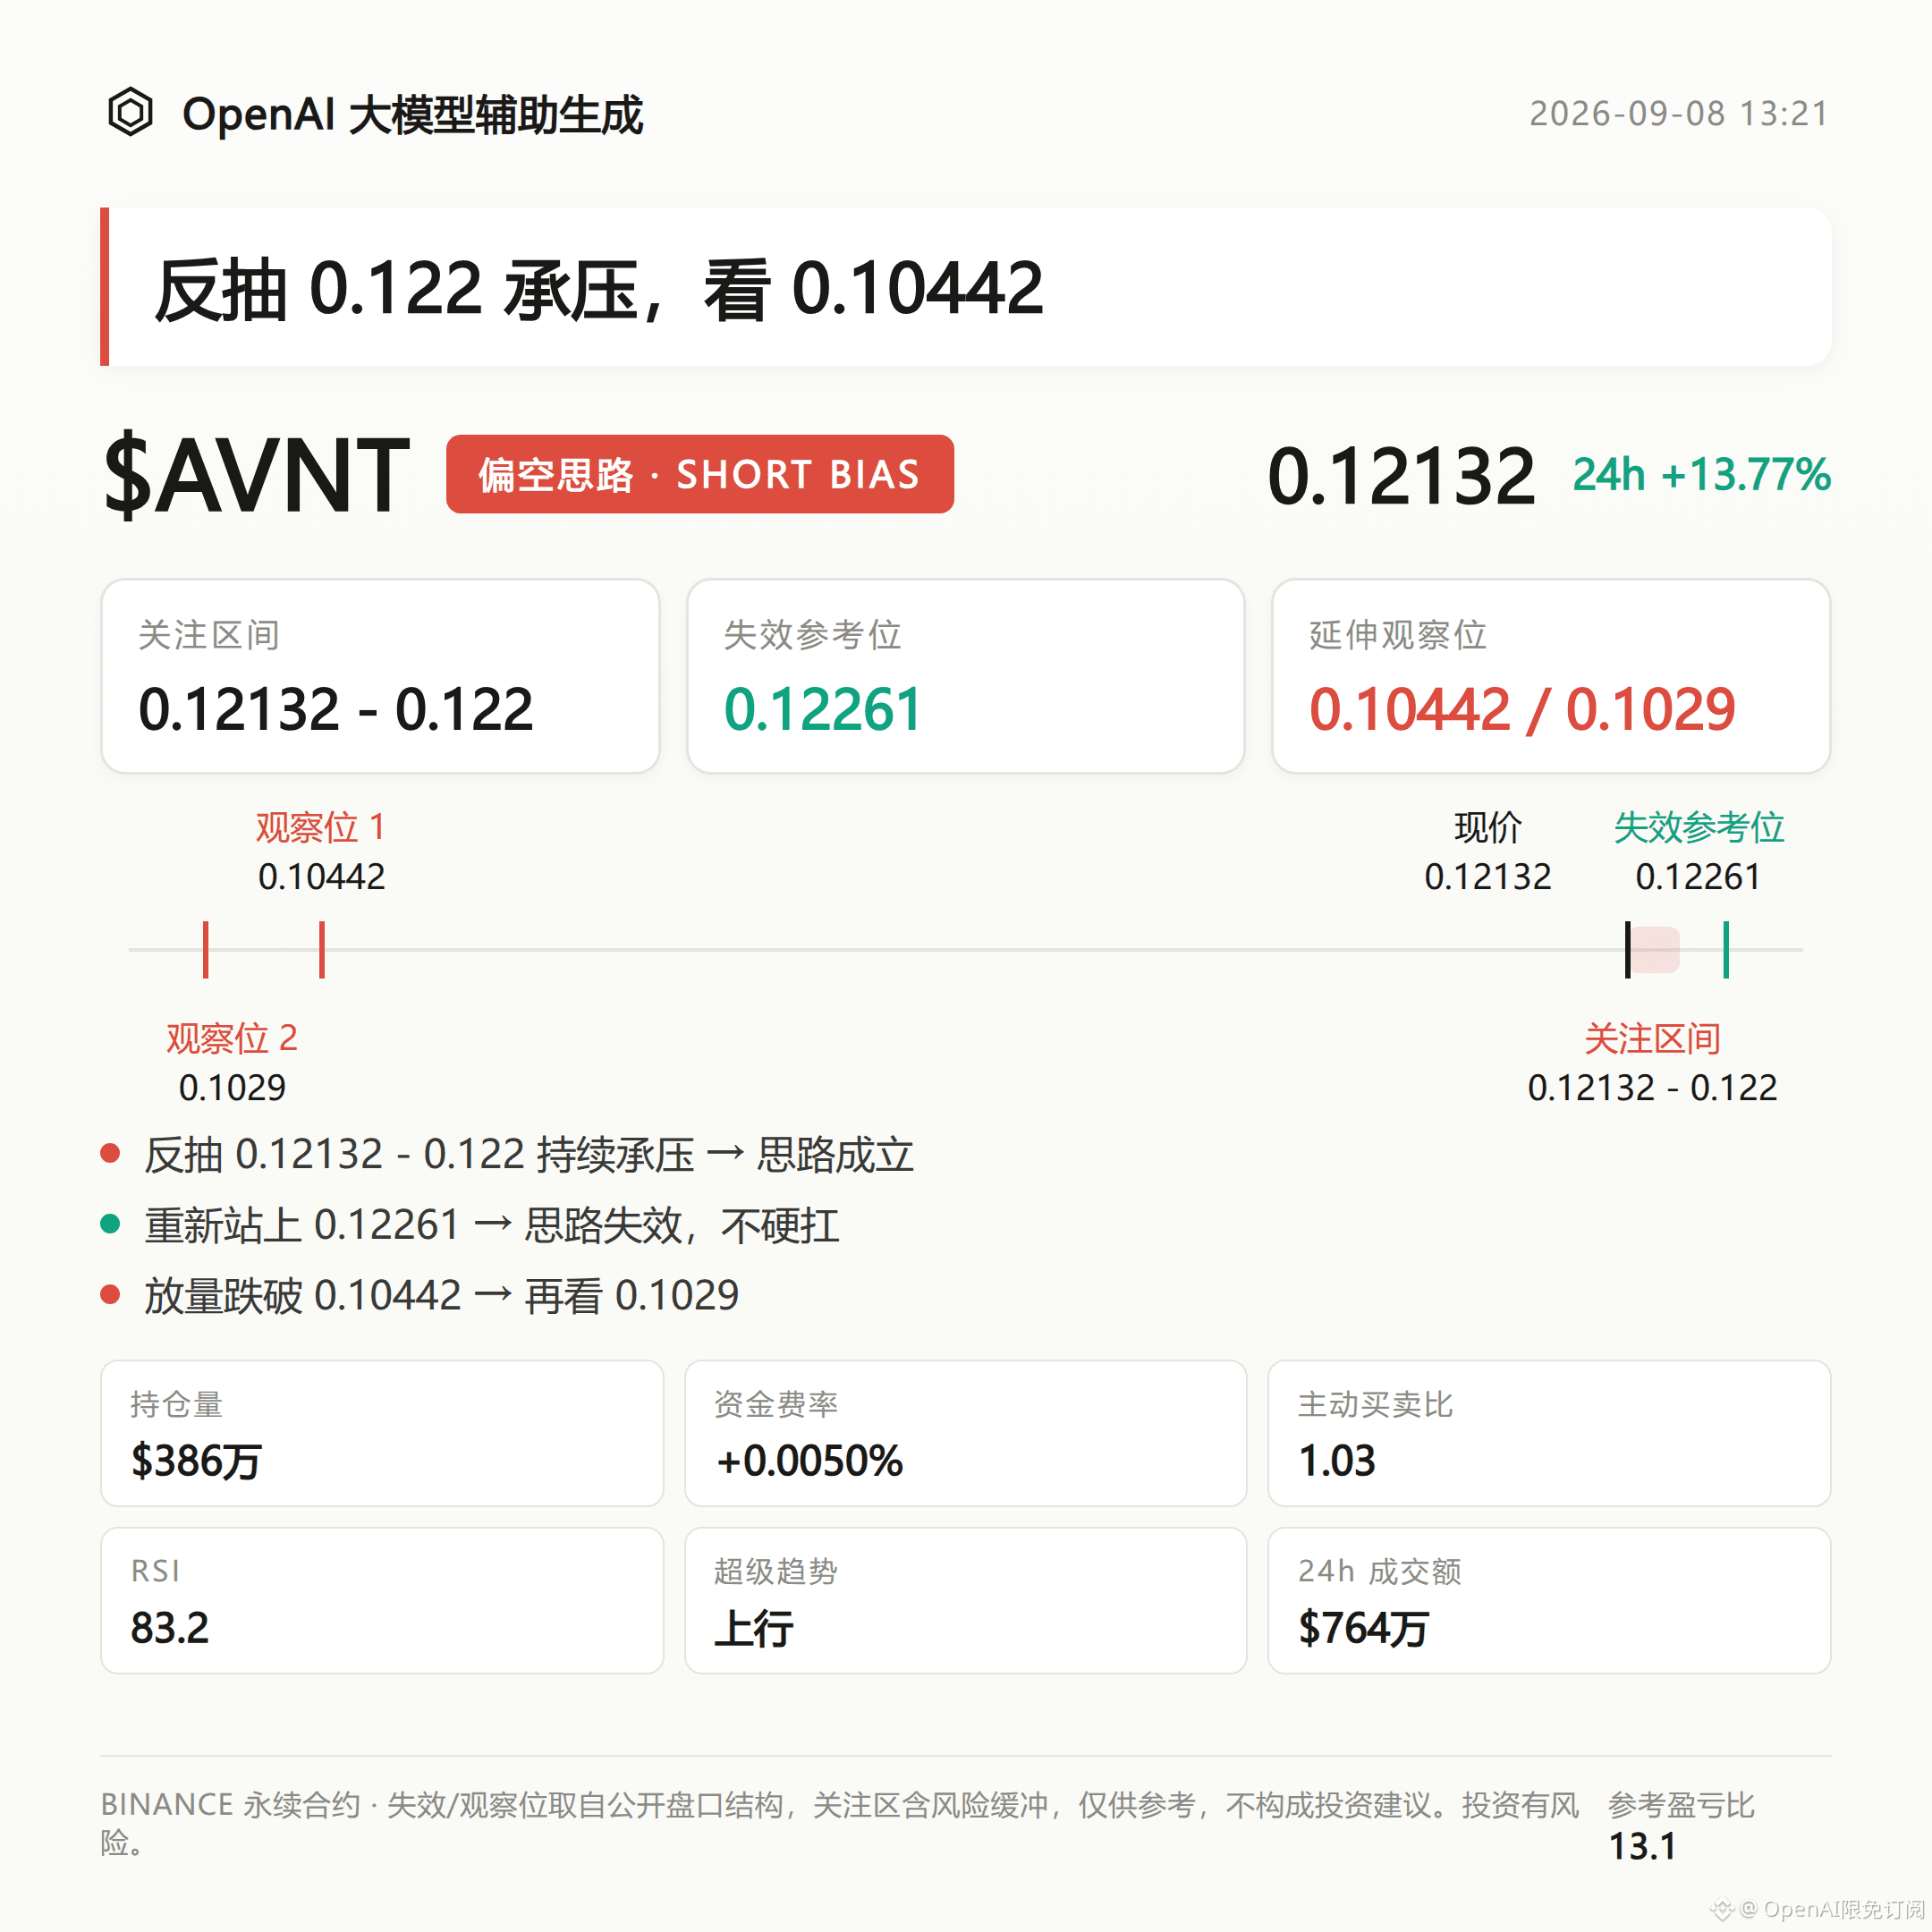
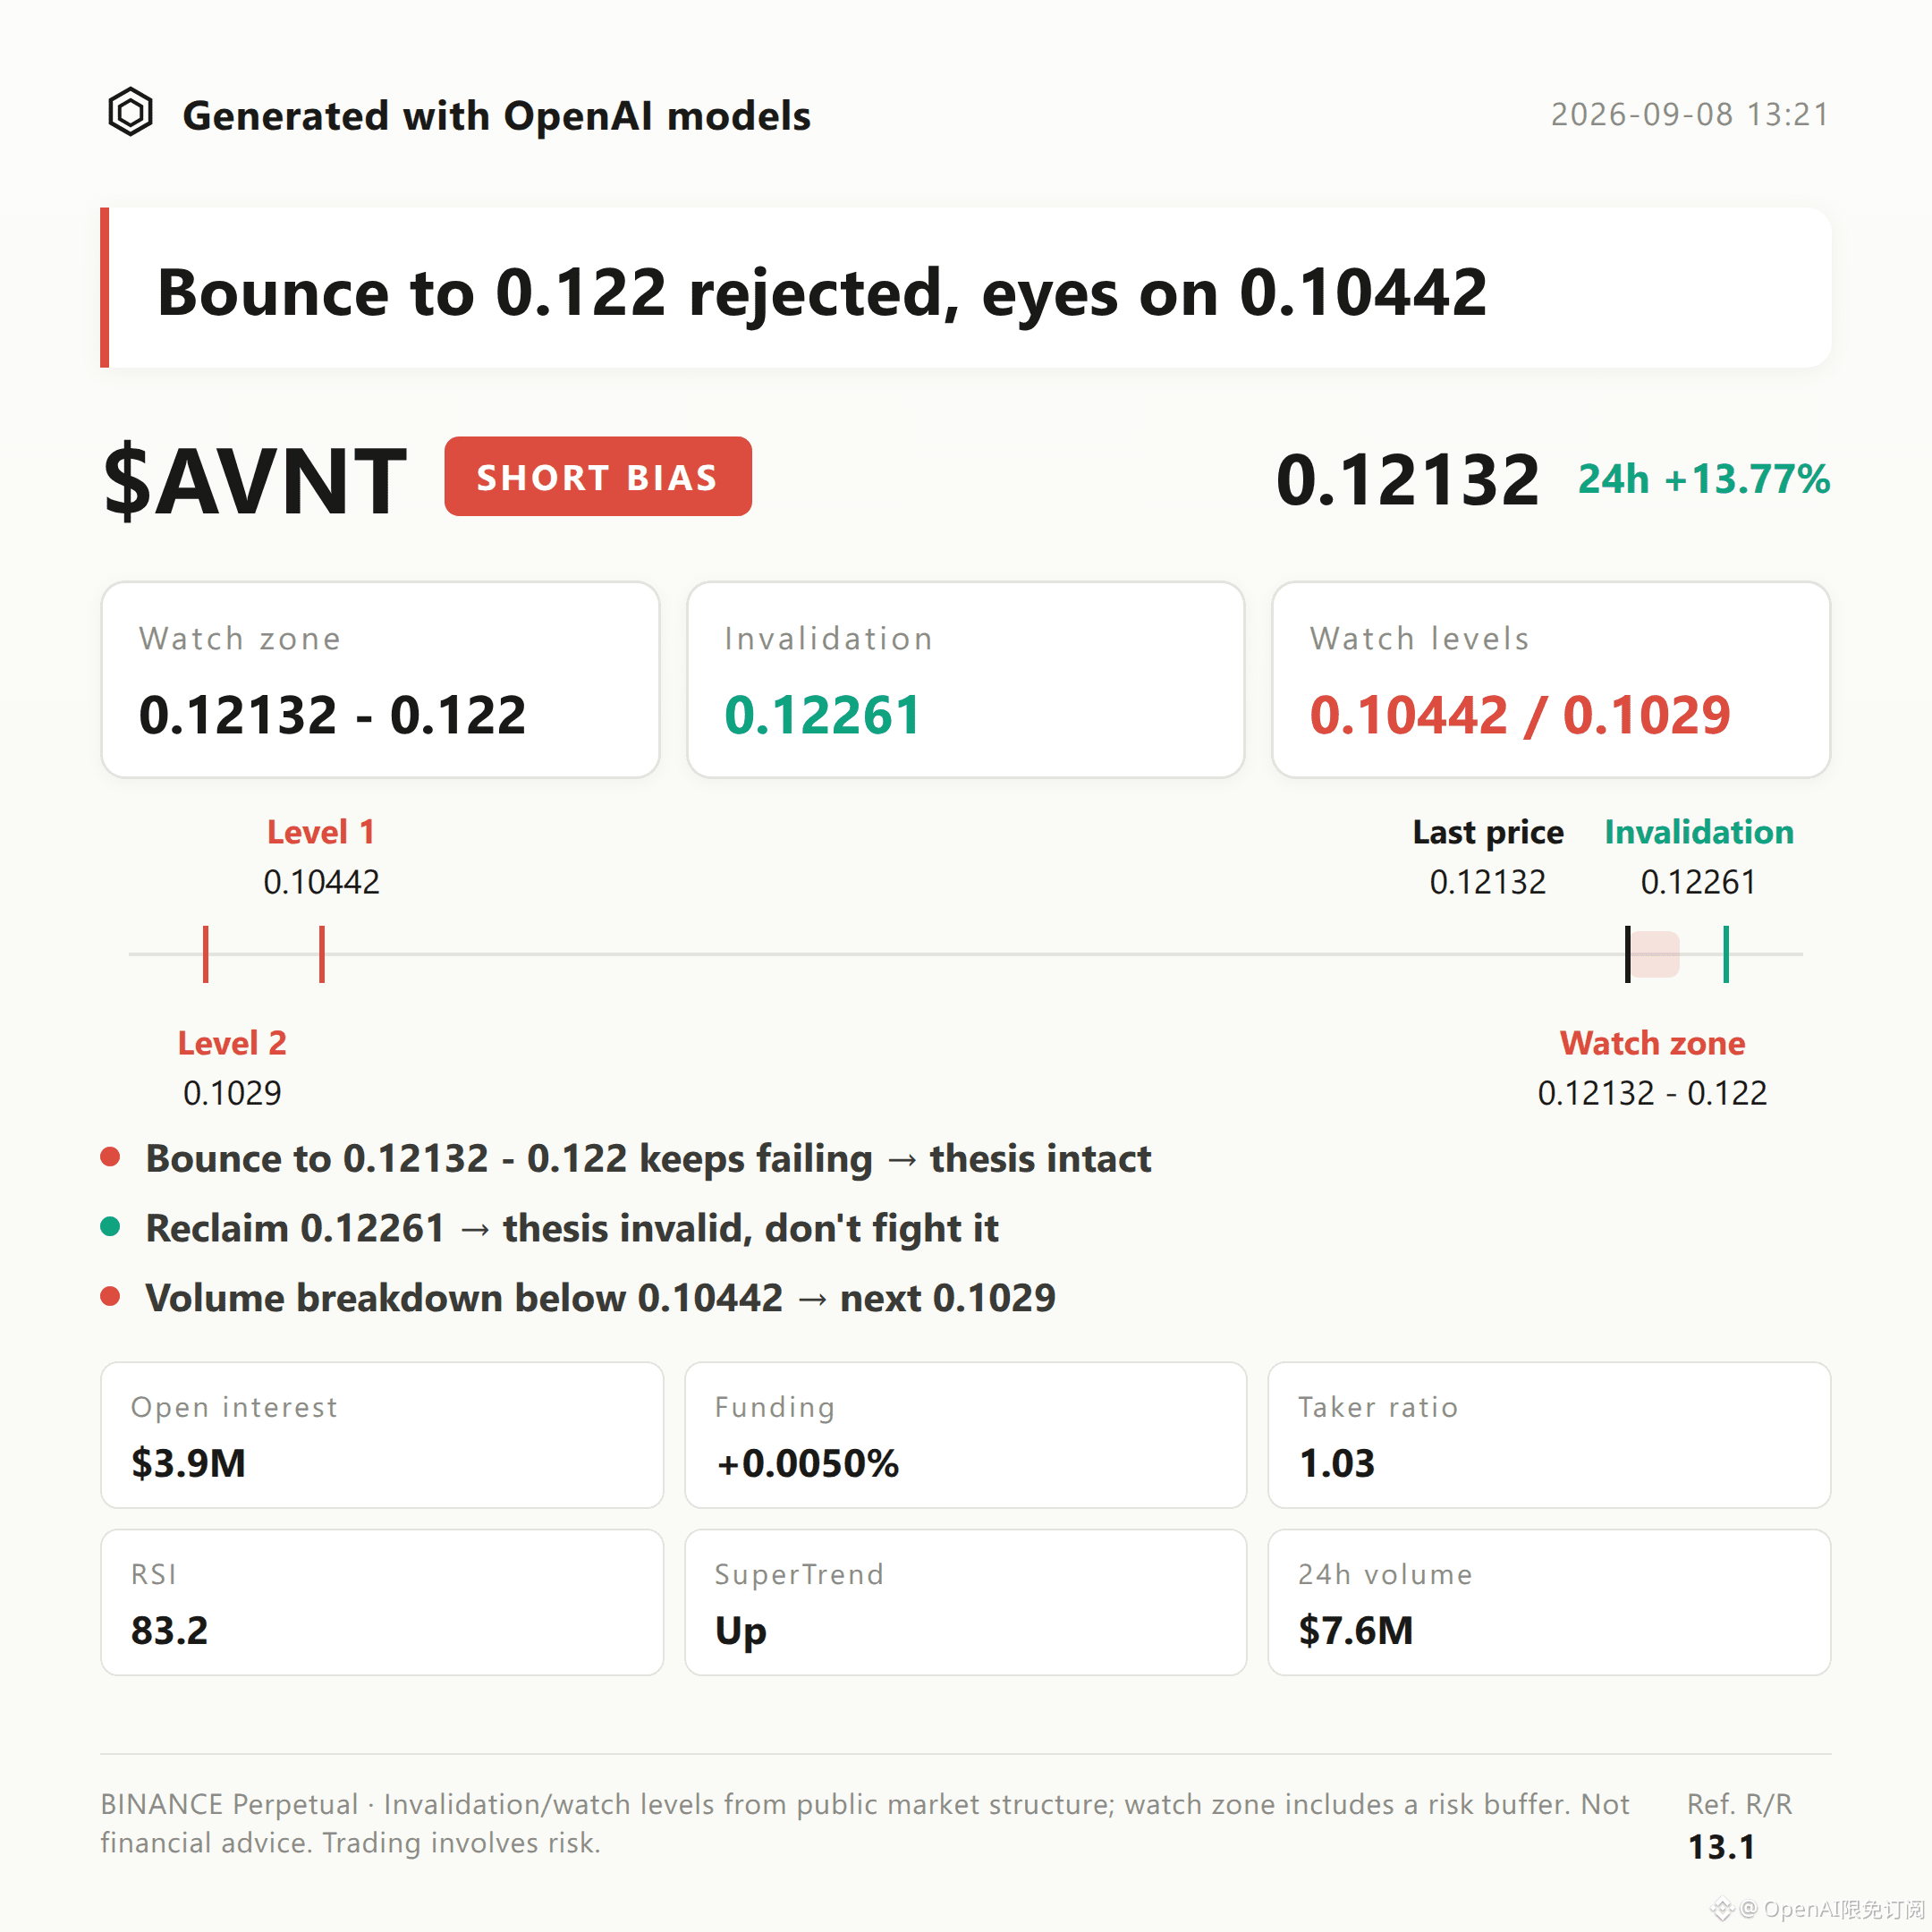
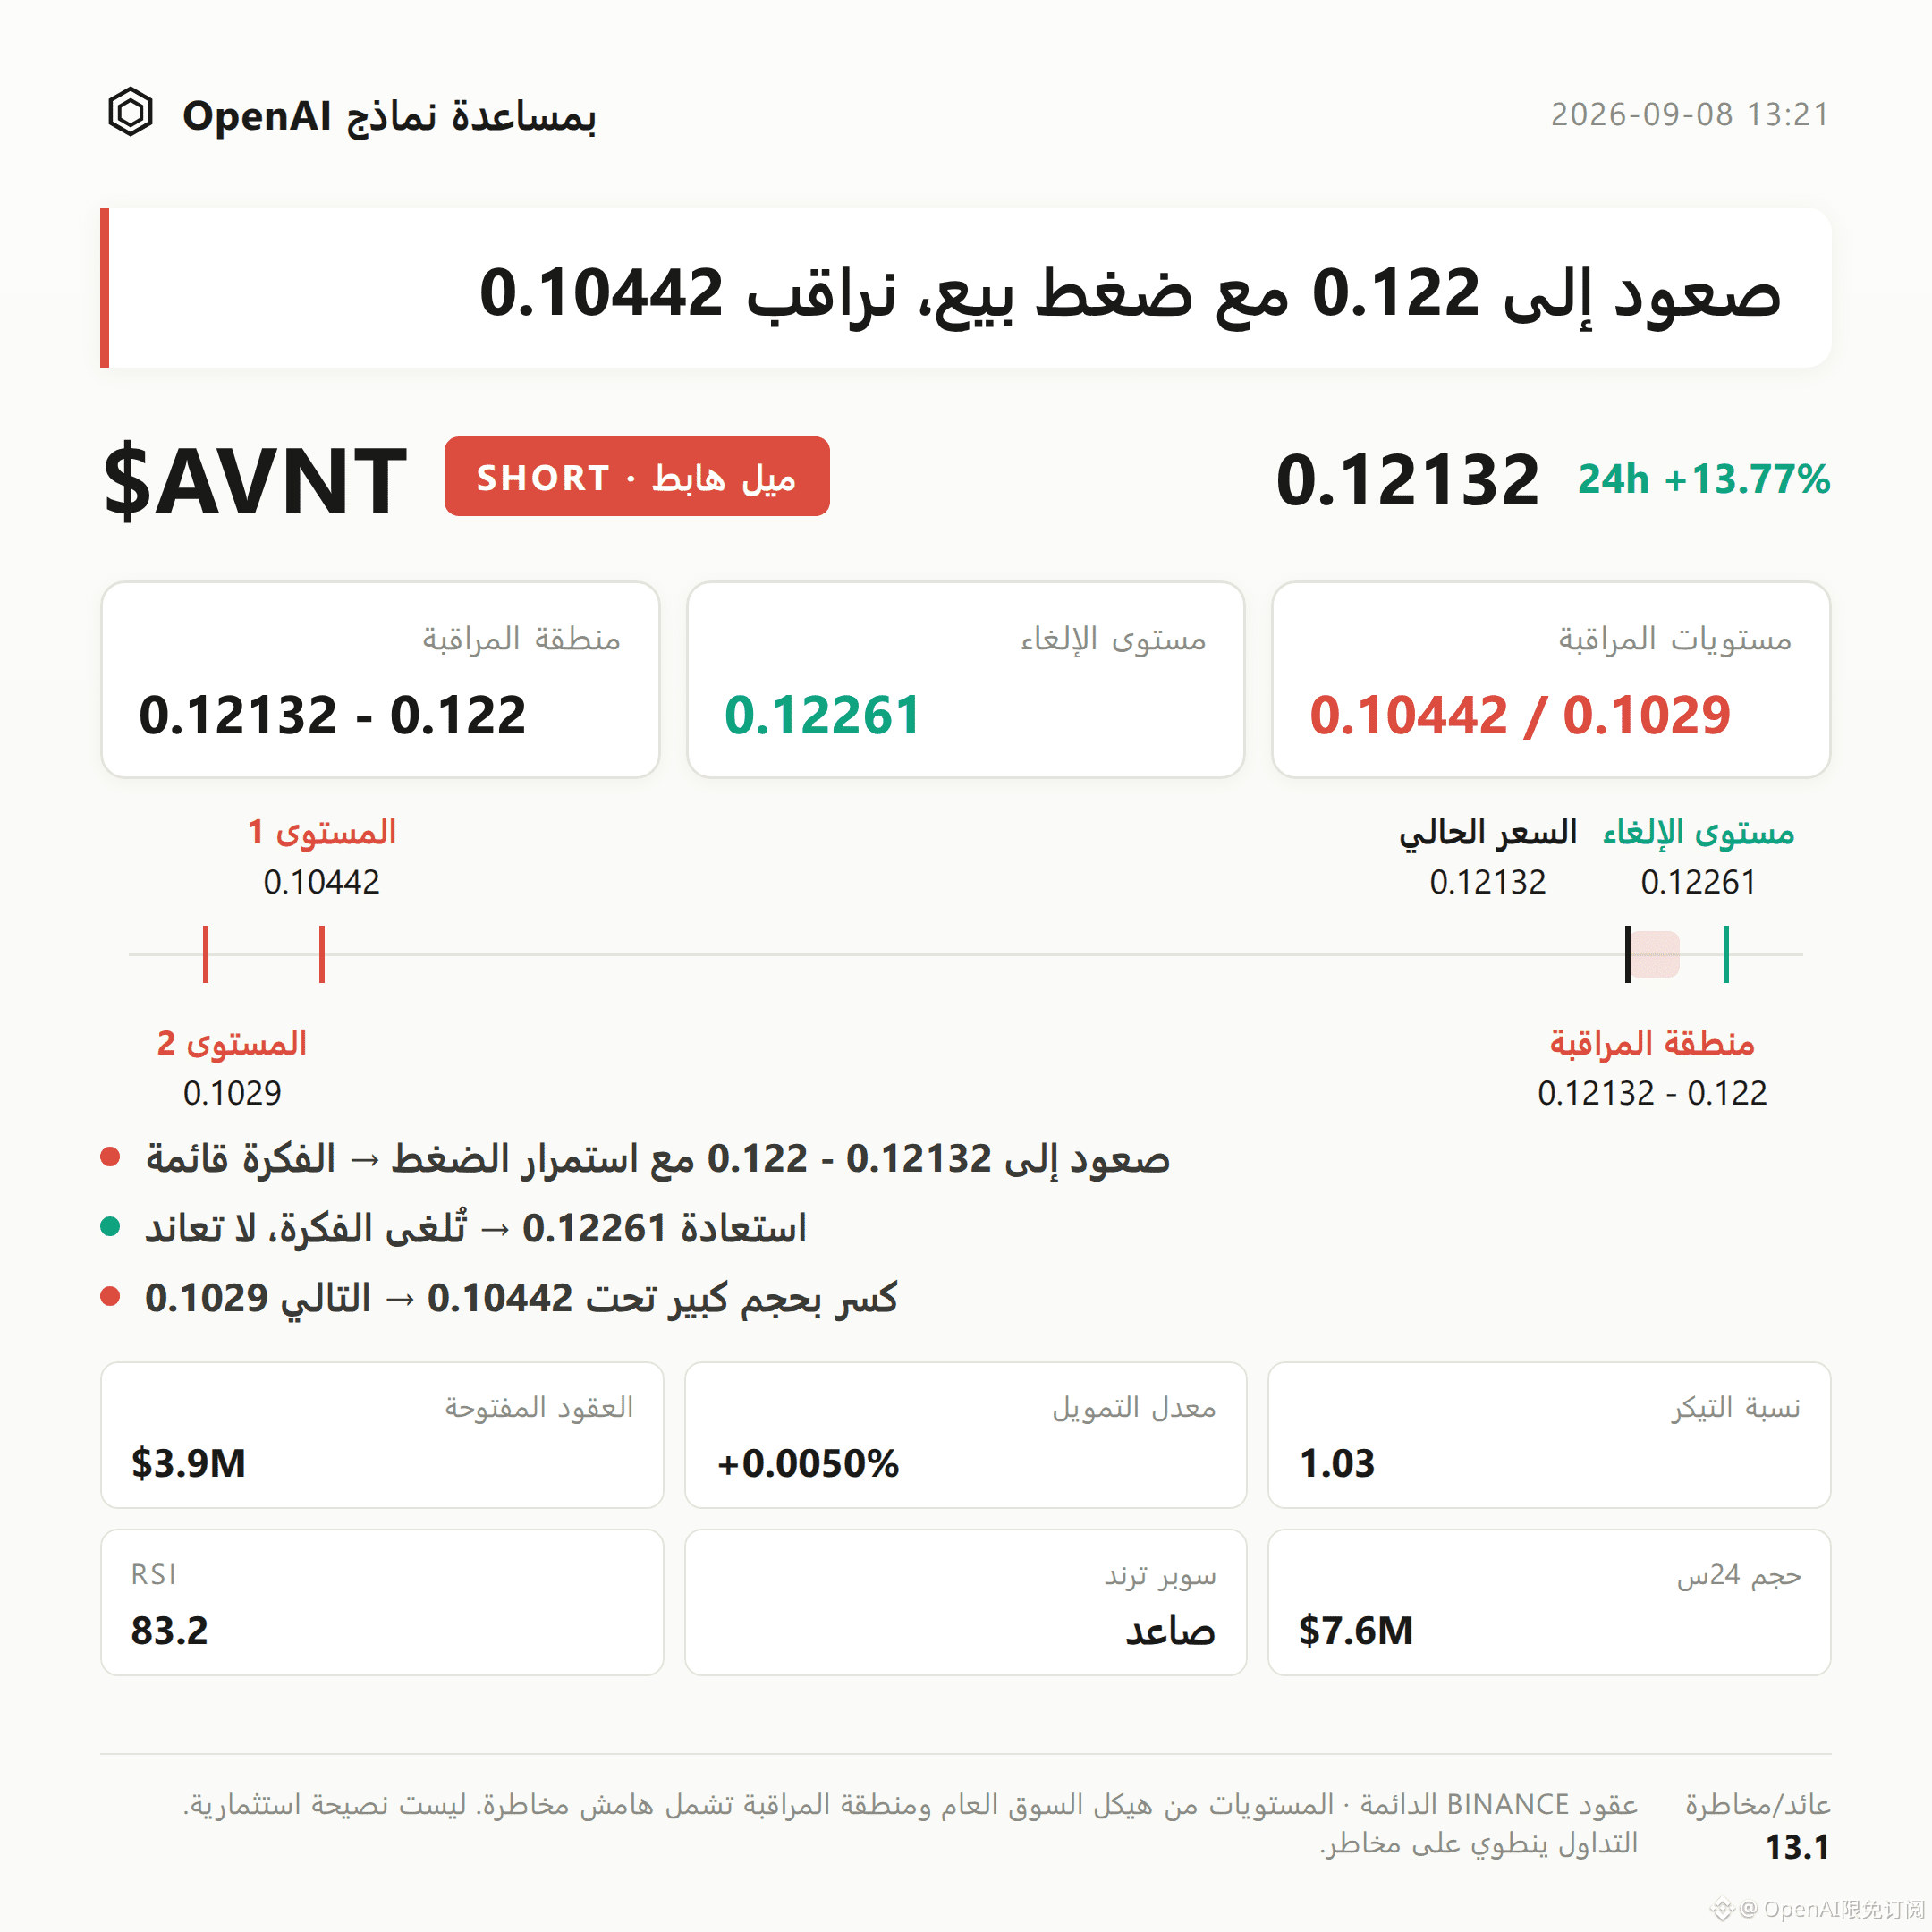
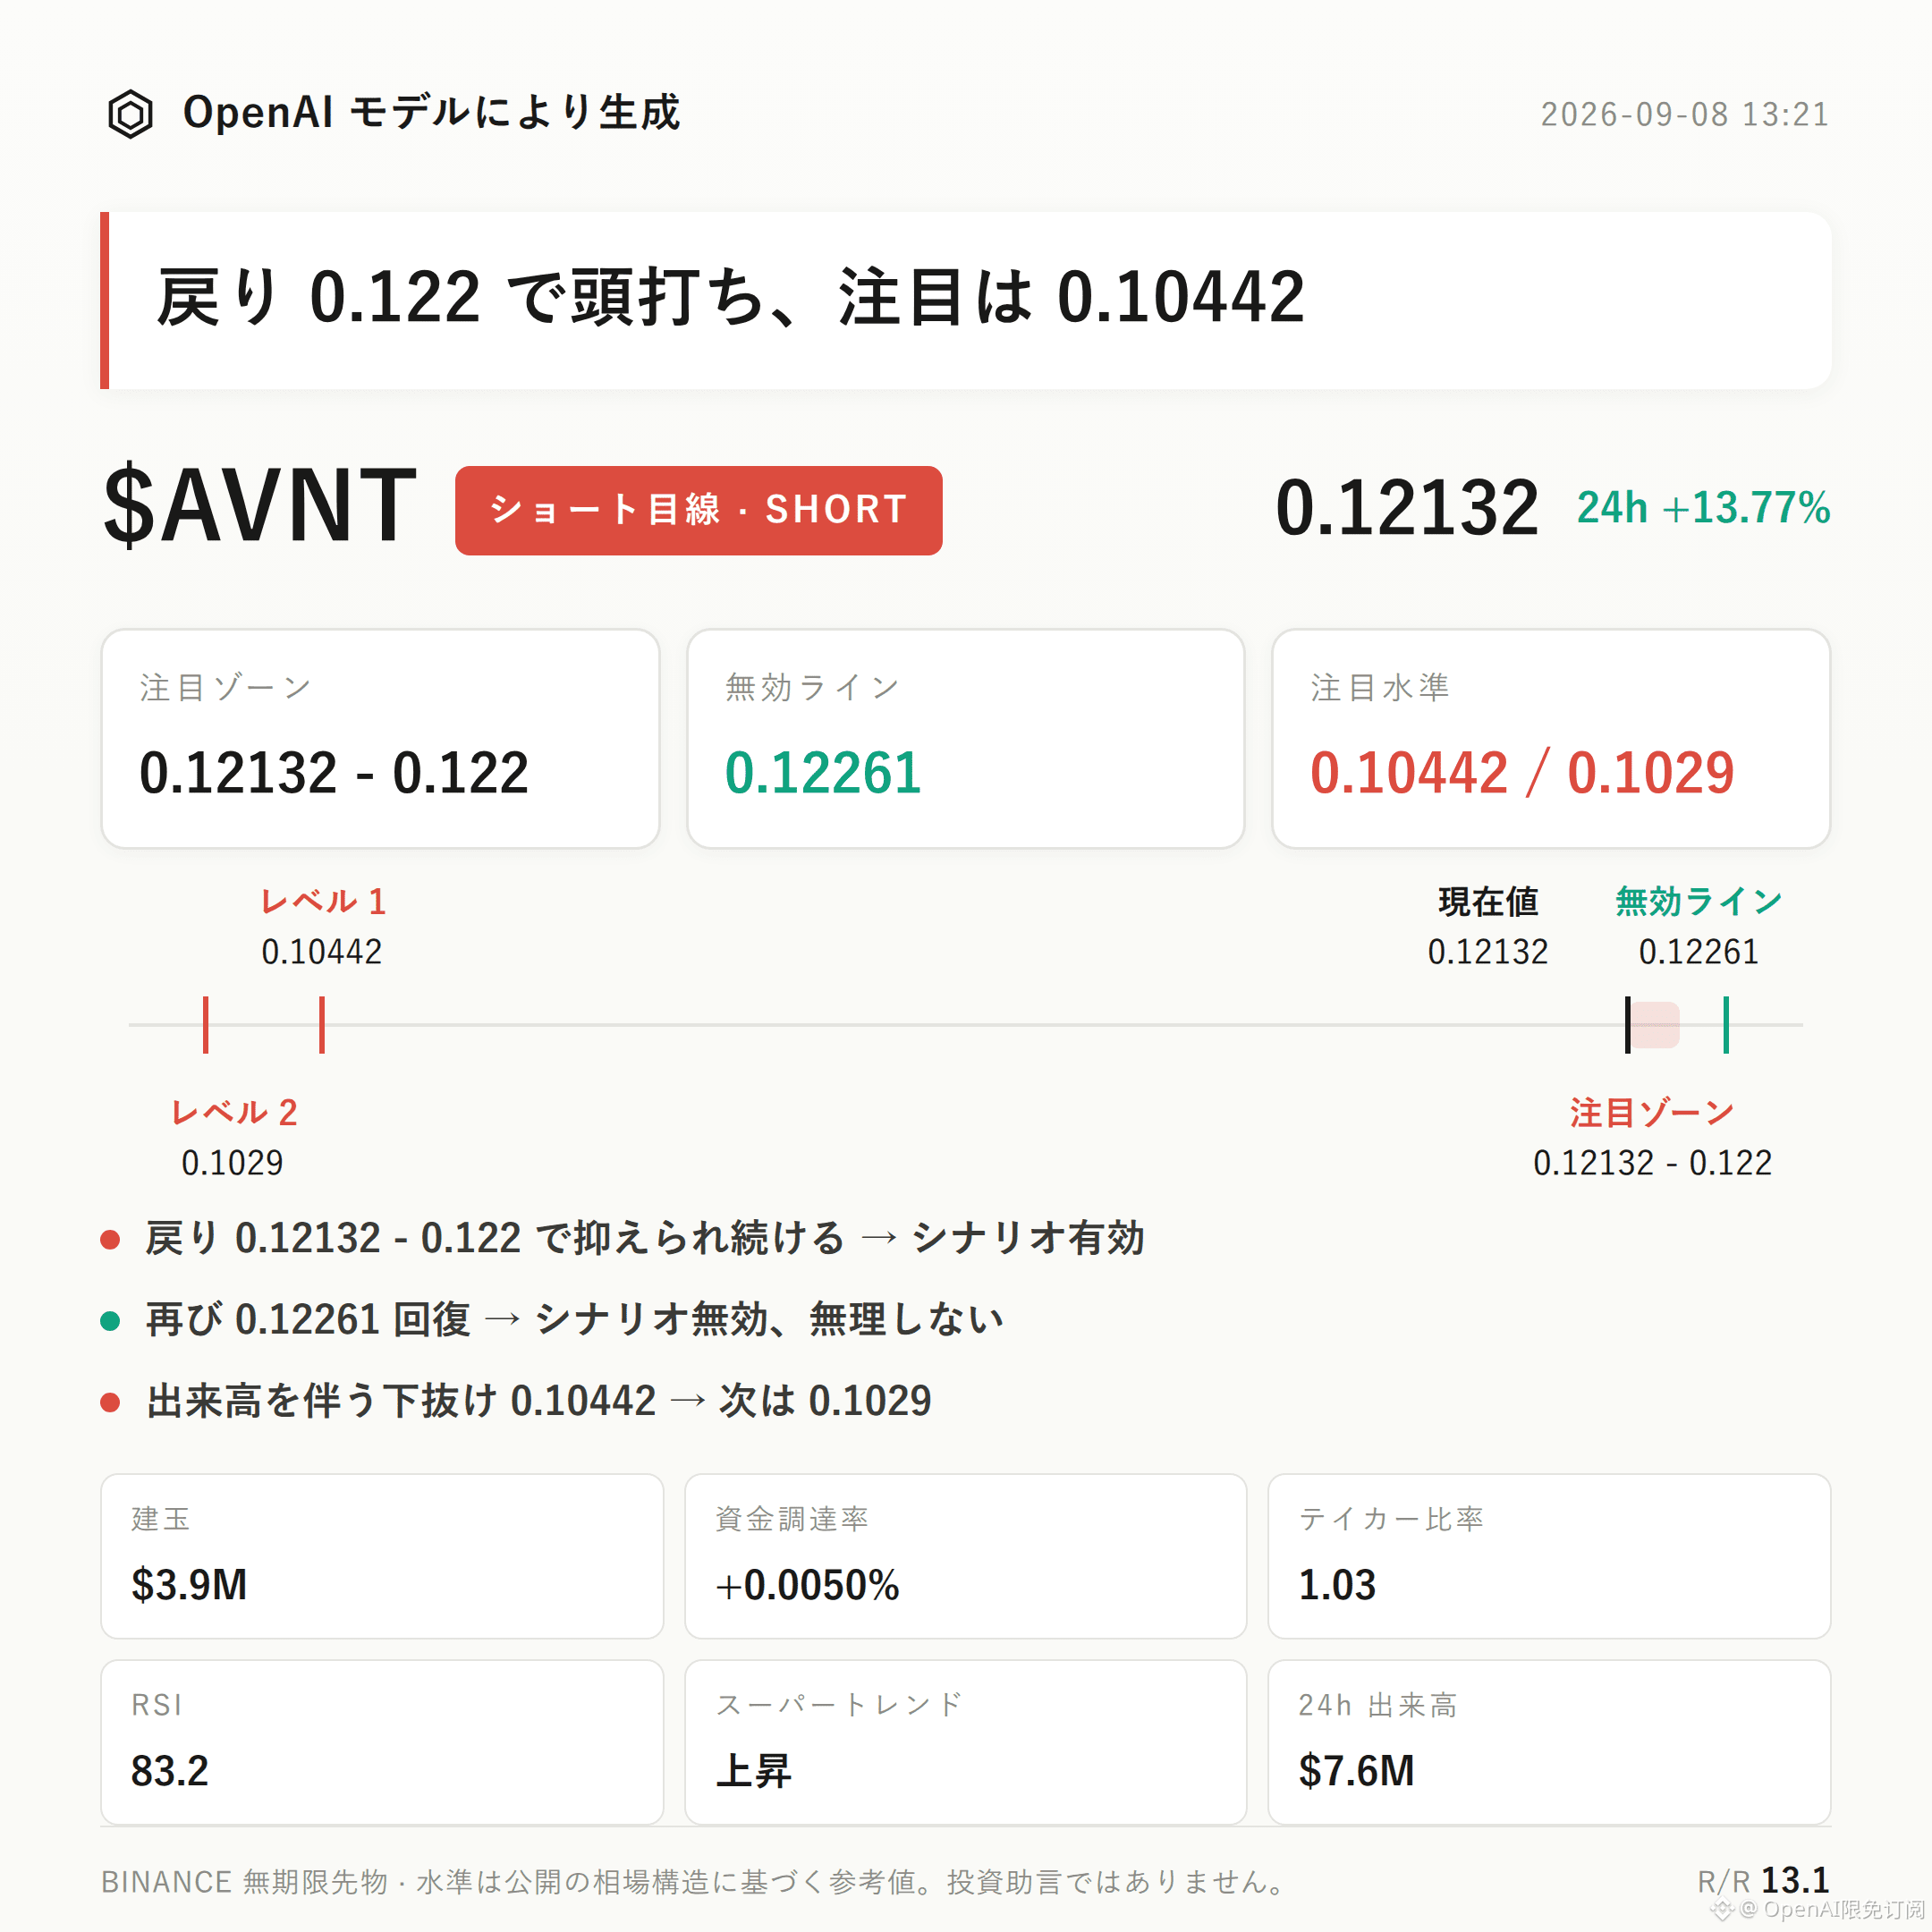
$AVNT bias to the downside | Watch zone 0.12132 - 0.122 | Invalidation reference 0.12261 | Observation levels 0.10442 / 0.1029
$AVNT ’s current bearish-leaning structure is unfolding.
Core argument: RSI has surged into the overbought zone at 83.2. While the price is up 13.77% over 24 hours, open interest has jumped 15.8% in a single day. The combination of rising volume and rising open interest alongside the rally often turns into profit-taking sell pressure after late-chasing buyers become concentrated.
Validation method: Focus on whether the pullback can be held down in the resistance area. If it cannot, the thesis doesn’t hold.
Structurally: the current price is 0.12132, already trading near the recent high around 0.12261, and it is above the Bollinger Band upper band at 0.1168, the middle band at 0.1099, and the lower band at 0.1029. Price is clearly running outside the band, away from the mean.
The Supertrend indicator still shows an upward direction, and MACD is also in a bullish momentum state. This means the trend has not yet weakened on the trend level—this point must be acknowledged objectively.
RSI at 83.2 has entered a widely recognized overbought area. Historically, readings like this are often accompanied by the risk of a phase pullback. This is the main technical basis for the thesis.
On the fund/positioning side: 24-hour trading value is $7.64 million; open interest is $3.86 million and has increased by 15.8% over 24 hours. This suggests that positions are expanding right near new price highs—an indication of crowded positioning at elevated levels.
Funding rate is positive at 0.0050%, long account share is 57%, and the aggressive buy/sell ratio is 1.03. All three metrics show long-side sentiment is dominant. However, positions where sentiment is consistent and net-long are often where contrarian risk begins to build.
The reference range is set at 0.12132 to 0.122. It is more suitable to wait for price to pull back into this zone and then look for signs of resistance before making further judgment, rather than assuming the structure is already broken at the current location.
If, after the pullback into the watch zone, you see signs such as a stall (lack of follow-through) or weakening volume/momentum, you can continue observing the effectiveness of the bearish structure.
The invalidation reference is 0.12261: if price re-validates and effectively trades back above this level, it means the current pullback structure is broken and the bearish thesis should be considered invalid—do not continue applying it.
For the lower extension observation levels: 0.10442. If later there is a breakdown on expanding volume, you can then look at the support performance near 0.1029 as further confirmation.
Need to state plainly: there is currently no clear reversal signal. Supertrend and MACD still maintain the long direction—this is something this thesis must face.
But the contract itself carries leverage; leverage amplifies the risk of movement beyond the directional judgment. Therefore, position management discipline is more important than directional calls.
Live account disclosure: This account currently holds $FOGO long positions. Structurally, I continue to look for upside, and the viewpoint is consistent with the position.
For reference only and does not constitute investment advice. Leverage is involved in this contract, and investing carries risk.
This article is generated with assistance from an OpenAI large model.
$AVNT
#Contract analysis
$AVNT bias to the downside | Watch zone 0.12132 - 0.122 | Invalidation reference 0.12261 | Observation levels 0.10442 / 0.1029
$AVNT ’s current bearish-leaning structure is unfolding.
Core argument: RSI has surged into the overbought zone at 83.2. While the price is up 13.77% over 24 hours, open interest has jumped 15.8% in a single day. The combination of rising volume and rising open interest alongside the rally often turns into profit-taking sell pressure after late-chasing buyers become concentrated.
Validation method: Focus on whether the pullback can be held down in the resistance area. If it cannot, the thesis doesn’t hold.
Structurally: the current price is 0.12132, already trading near the recent high around 0.12261, and it is above the Bollinger Band upper band at 0.1168, the middle band at 0.1099, and the lower band at 0.1029. Price is clearly running outside the band, away from the mean.
The Supertrend indicator still shows an upward direction, and MACD is also in a bullish momentum state. This means the trend has not yet weakened on the trend level—this point must be acknowledged objectively.
RSI at 83.2 has entered a widely recognized overbought area. Historically, readings like this are often accompanied by the risk of a phase pullback. This is the main technical basis for the thesis.
On the fund/positioning side: 24-hour trading value is $7.64 million; open interest is $3.86 million and has increased by 15.8% over 24 hours. This suggests that positions are expanding right near new price highs—an indication of crowded positioning at elevated levels.
Funding rate is positive at 0.0050%, long account share is 57%, and the aggressive buy/sell ratio is 1.03. All three metrics show long-side sentiment is dominant. However, positions where sentiment is consistent and net-long are often where contrarian risk begins to build.
The reference range is set at 0.12132 to 0.122. It is more suitable to wait for price to pull back into this zone and then look for signs of resistance before making further judgment, rather than assuming the structure is already broken at the current location.
If, after the pullback into the watch zone, you see signs such as a stall (lack of follow-through) or weakening volume/momentum, you can continue observing the effectiveness of the bearish structure.
The invalidation reference is 0.12261: if price re-validates and effectively trades back above this level, it means the current pullback structure is broken and the bearish thesis should be considered invalid—do not continue applying it.
For the lower extension observation levels: 0.10442. If later there is a breakdown on expanding volume, you can then look at the support performance near 0.1029 as further confirmation.
Need to state plainly: there is currently no clear reversal signal. Supertrend and MACD still maintain the long direction—this is something this thesis must face.
But the contract itself carries leverage; leverage amplifies the risk of movement beyond the directional judgment. Therefore, position management discipline is more important than directional calls.
Live account disclosure: This account currently holds $FOGO long positions. Structurally, I continue to look for upside, and the viewpoint is consistent with the position.
For reference only and does not constitute investment advice. Leverage is involved in this contract, and investing carries risk.
This article is generated with assistance from an OpenAI large model.
$AVNT
#Contract analysis