📊 Technical Analysis (TF 4H)
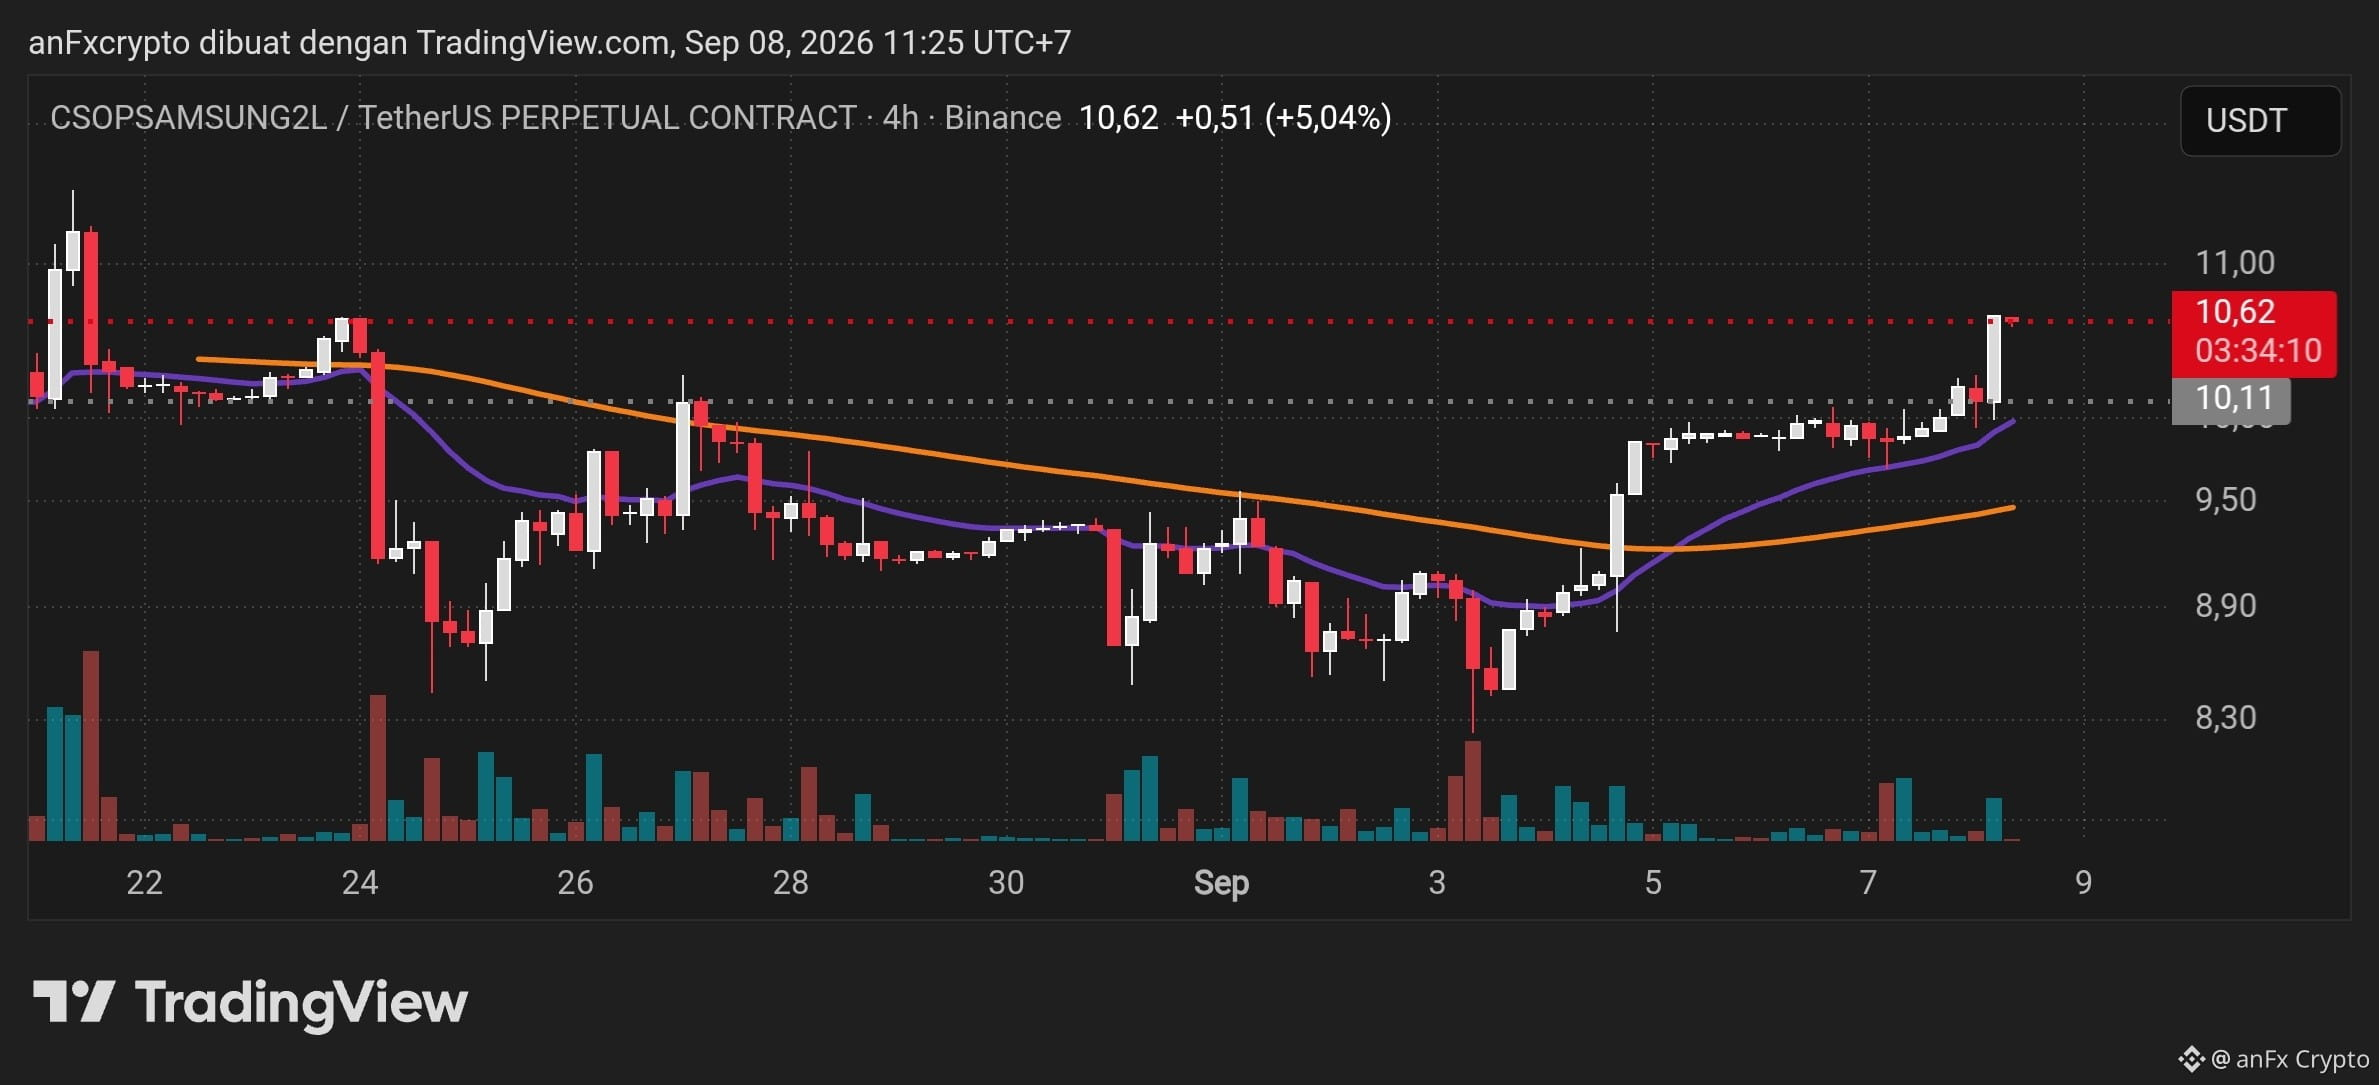
* Structure & Trend: The $CSOPSAMSUNG2L /USDT chart shows a reversal from bearish to bullish after successfully forming consecutive higher lows from the lowest area around 8.30 USDT.
* Moving Average Indicator: A bullish crossover occurred between the short-term MA line (purple) and the long-term MA line (orange) near 9.50 USDT, confirming that upward momentum is currently dominant.
* Breakout & Volume: The latest 4-hour candle successfully broke out above the horizontal resistance level of 10.11 USDT, accompanied by a surge in trading volume.
* Key Levels:
* Main Support: 10.11 USDT (former resistance turned support) and 9.50 USDT.
* Main Resistance: 11.00 USDT to 11.30 USDT (previous swing high).
Trading Signal (Long / Buy on Retest)
Considering the current running price is 10.62 USDT and it is approaching the psychological resistance at 11.00 USDT, avoid impulsive buying (FOMO). The best option is to wait for a pullback / retest to the new support area so the risk-to-reward ratio and profit potential remain ideal.
* Market Bias: Bullish
* Strategy: Buy on Retest (Limit Buy)
* Entry Area: 10.11 USDT – 10.25 USDT
* Take Profit 1 (TP1): 11.00 USDT
* Take Profit 2 (TP2): 11.30 USDT
* Stop Loss (SL): 9.75 USDT (below the breakout structure & MA)
* Risk-to-Reward Ratio: ~1 : 2.4
Risk Management & Execution Notes
* Limit Leverage: Since this is a perpetual contract, use measured leverage (maximum 3x–5x).
* Capital Allocation: Apply strict risk management by risking no more than 1–2% of total portfolio equity on this position.
* Invalidation: If price closes again (4H candle close) below 10.11 USDT with high volume, this indicates a potential false breakout, so the Long position should be canceled.
* Structure & Trend: The $CSOPSAMSUNG2L /USDT chart shows a reversal from bearish to bullish after successfully forming consecutive higher lows from the lowest area around 8.30 USDT.
* Moving Average Indicator: A bullish crossover occurred between the short-term MA line (purple) and the long-term MA line (orange) near 9.50 USDT, confirming that upward momentum is currently dominant.
* Breakout & Volume: The latest 4-hour candle successfully broke out above the horizontal resistance level of 10.11 USDT, accompanied by a surge in trading volume.
* Key Levels:
* Main Support: 10.11 USDT (former resistance turned support) and 9.50 USDT.
* Main Resistance: 11.00 USDT to 11.30 USDT (previous swing high).
Trading Signal (Long / Buy on Retest)
Considering the current running price is 10.62 USDT and it is approaching the psychological resistance at 11.00 USDT, avoid impulsive buying (FOMO). The best option is to wait for a pullback / retest to the new support area so the risk-to-reward ratio and profit potential remain ideal.
* Market Bias: Bullish
* Strategy: Buy on Retest (Limit Buy)
* Entry Area: 10.11 USDT – 10.25 USDT
* Take Profit 1 (TP1): 11.00 USDT
* Take Profit 2 (TP2): 11.30 USDT
* Stop Loss (SL): 9.75 USDT (below the breakout structure & MA)
* Risk-to-Reward Ratio: ~1 : 2.4
Risk Management & Execution Notes
* Limit Leverage: Since this is a perpetual contract, use measured leverage (maximum 3x–5x).
* Capital Allocation: Apply strict risk management by risking no more than 1–2% of total portfolio equity on this position.
* Invalidation: If price closes again (4H candle close) below 10.11 USDT with high volume, this indicates a potential false breakout, so the Long position should be canceled.