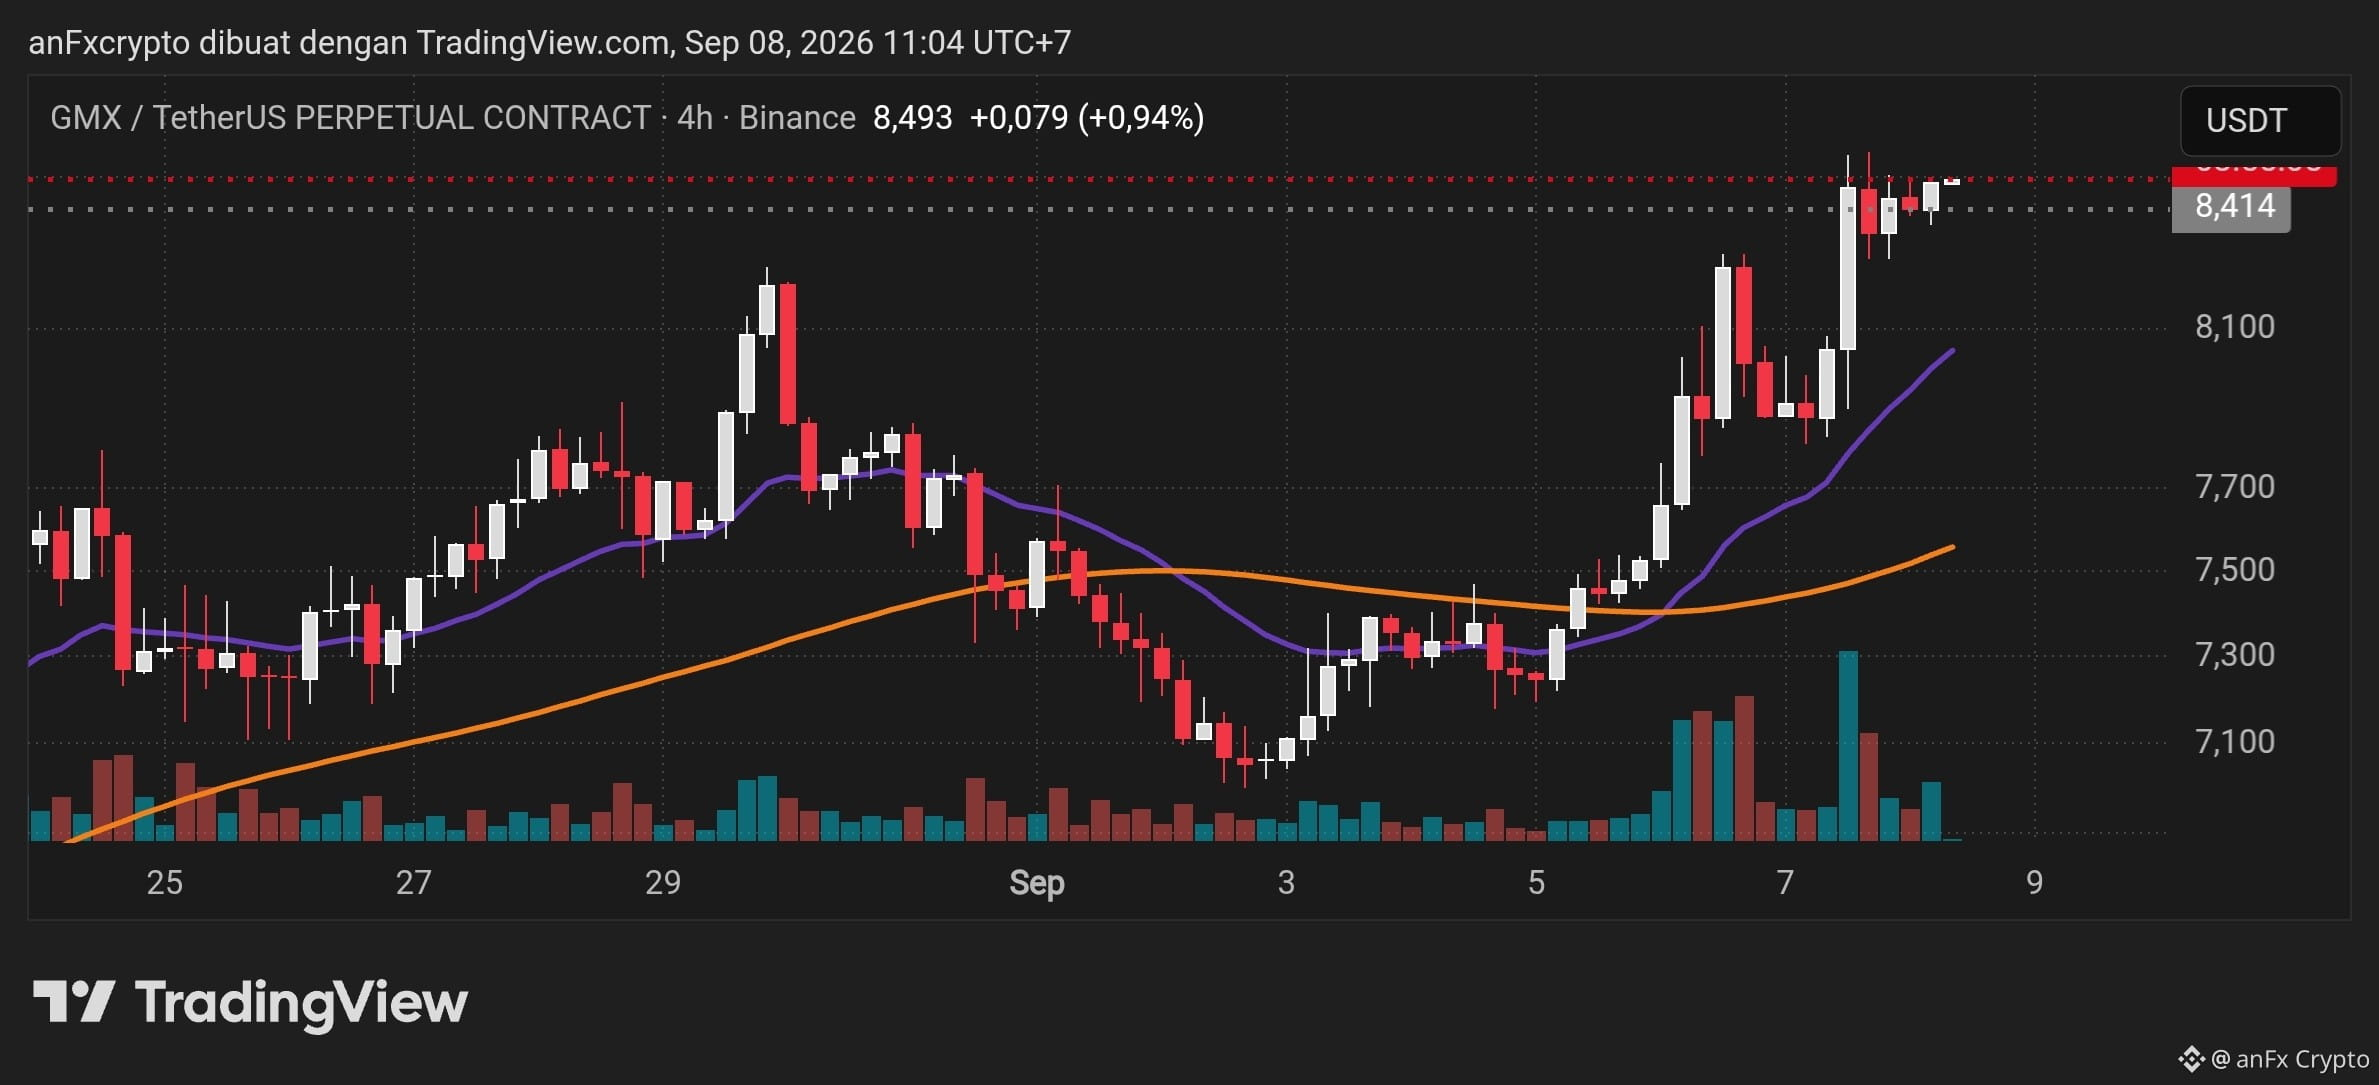
Price movement $GMX /USDT on the 4-hour time frame (4H) shows a strong bullish trend after successfully breaking out of a consolidation structure in the 7,300–7,500 range.
📊 Technical Analysis of GMX/USDT (4H)
* Trend & Momentum: Price forms a higher high and higher low pattern, driven by a significant spike in buy volume on 6–7 September.
* Moving Average: The short-term Moving Average line (purple) has crossed above the long-term MA line (orange) (Golden Cross), indicating that upward momentum is still dominant.
* Support & Resistance:
* Nearest Resistance: 8,500 (current local wick high area).
* Nearest Support: 8,100 – 8,200 (a former resistance area that has turned into support / retest zone).
* Secondary Support: 7,700 – 7,800 (aligned with the short MA line).
Trading Signal (Long / Buy Plan)
The safest strategy is to wait for a pullback (healthy correction) to the support area before confirming a Long position, to keep the Risk-to-Reward ratio optimal.
| Parameter | Price Level |
| Bias | Bullish (Long) |
| Entry Area (Limit Order) | 8,150 – 8,250 (Retest Zone) |
| Stop Loss (SL) | 7,900 (Below the local swing low & MA line) |
| Take Profit 1 (TP1) | 8,500 (Retest of the previous High) |
| Take Profit 2 (TP2) | 8,900 (Bullish extension target) |
| Risk / Reward Ratio | ~ 1 : 2.2 |
Alternative Scenario (Breakout Buy)
If price immediately breaks through the 8,520 level with high volume without a correction, the entry can be made via a breakout buy, targeting TP2 at 8,900–9,200 and a tight SL at 8,300.
Risk Management
Use sensible leverage (maximum 3x–5x for perpetual contracts) and allocate a maximum risk of 1%–2% of the total market capital. Always place a Stop Loss to anticipate sudden volatility in the crypto market.
📊 Technical Analysis of GMX/USDT (4H)
* Trend & Momentum: Price forms a higher high and higher low pattern, driven by a significant spike in buy volume on 6–7 September.
* Moving Average: The short-term Moving Average line (purple) has crossed above the long-term MA line (orange) (Golden Cross), indicating that upward momentum is still dominant.
* Support & Resistance:
* Nearest Resistance: 8,500 (current local wick high area).
* Nearest Support: 8,100 – 8,200 (a former resistance area that has turned into support / retest zone).
* Secondary Support: 7,700 – 7,800 (aligned with the short MA line).
Trading Signal (Long / Buy Plan)
The safest strategy is to wait for a pullback (healthy correction) to the support area before confirming a Long position, to keep the Risk-to-Reward ratio optimal.
| Parameter | Price Level |
| Bias | Bullish (Long) |
| Entry Area (Limit Order) | 8,150 – 8,250 (Retest Zone) |
| Stop Loss (SL) | 7,900 (Below the local swing low & MA line) |
| Take Profit 1 (TP1) | 8,500 (Retest of the previous High) |
| Take Profit 2 (TP2) | 8,900 (Bullish extension target) |
| Risk / Reward Ratio | ~ 1 : 2.2 |
Alternative Scenario (Breakout Buy)
If price immediately breaks through the 8,520 level with high volume without a correction, the entry can be made via a breakout buy, targeting TP2 at 8,900–9,200 and a tight SL at 8,300.
Risk Management
Use sensible leverage (maximum 3x–5x for perpetual contracts) and allocate a maximum risk of 1%–2% of the total market capital. Always place a Stop Loss to anticipate sudden volatility in the crypto market.