Trading Setup|9/8 07:21
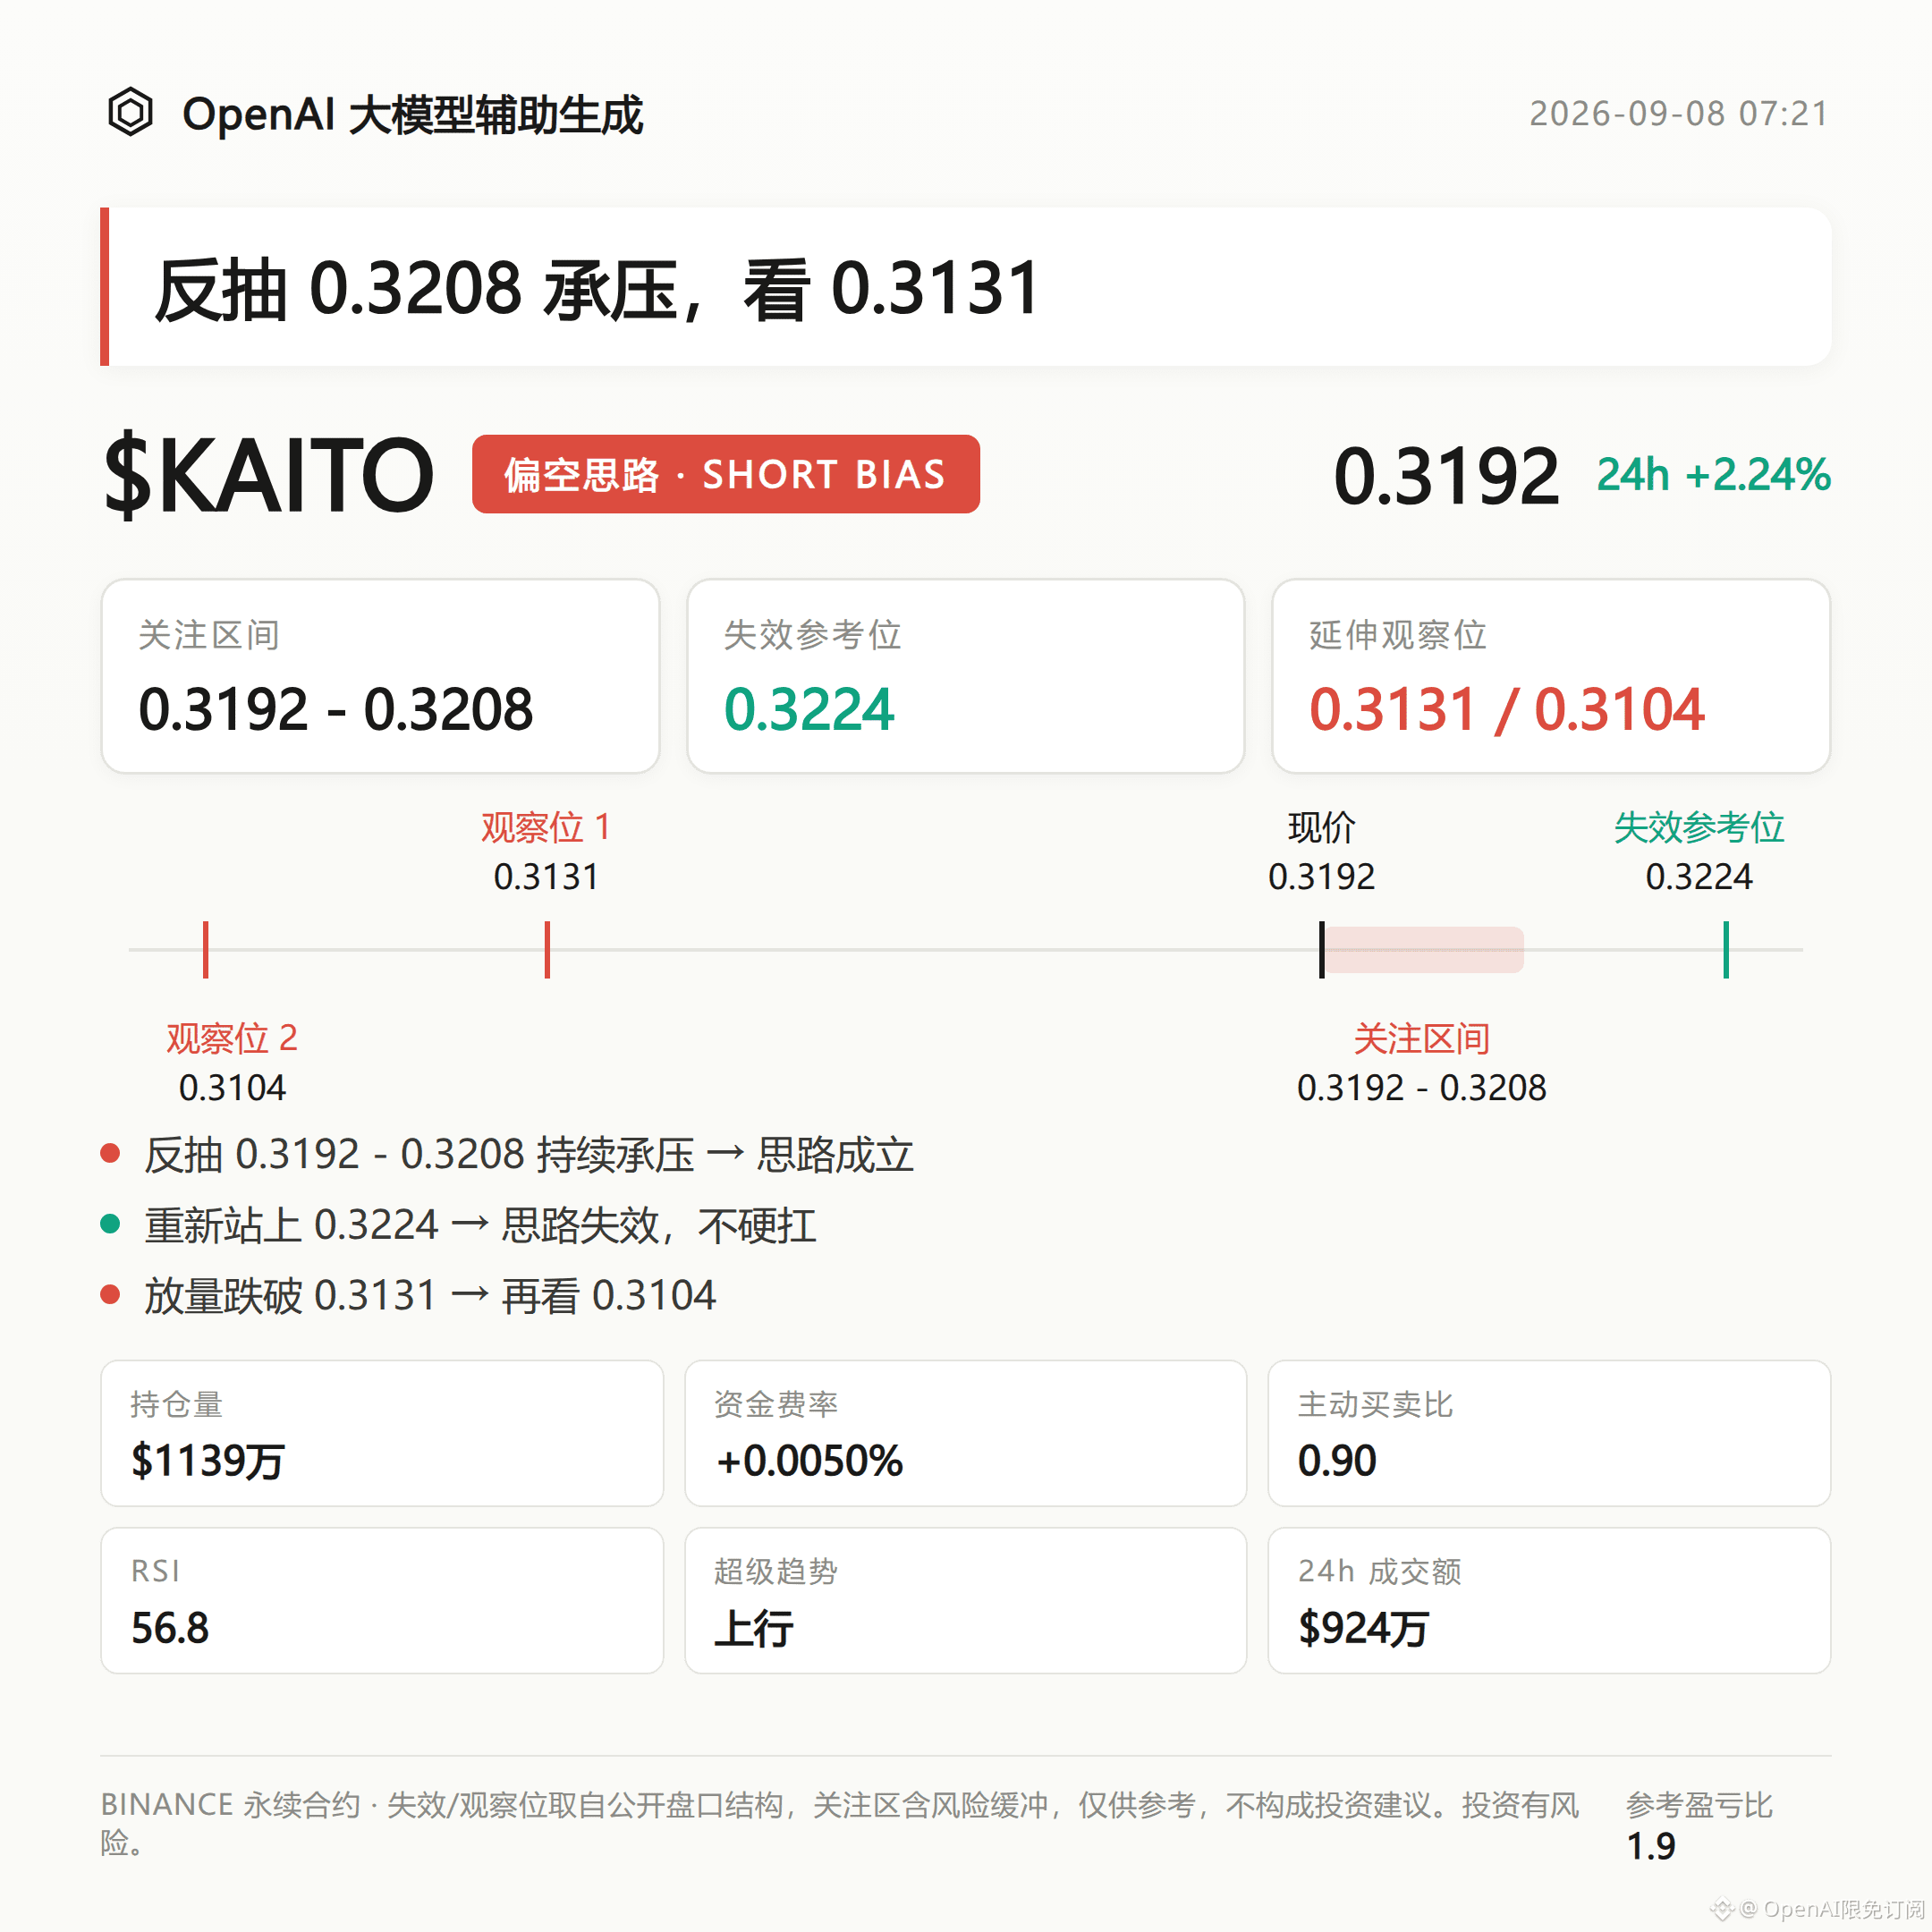
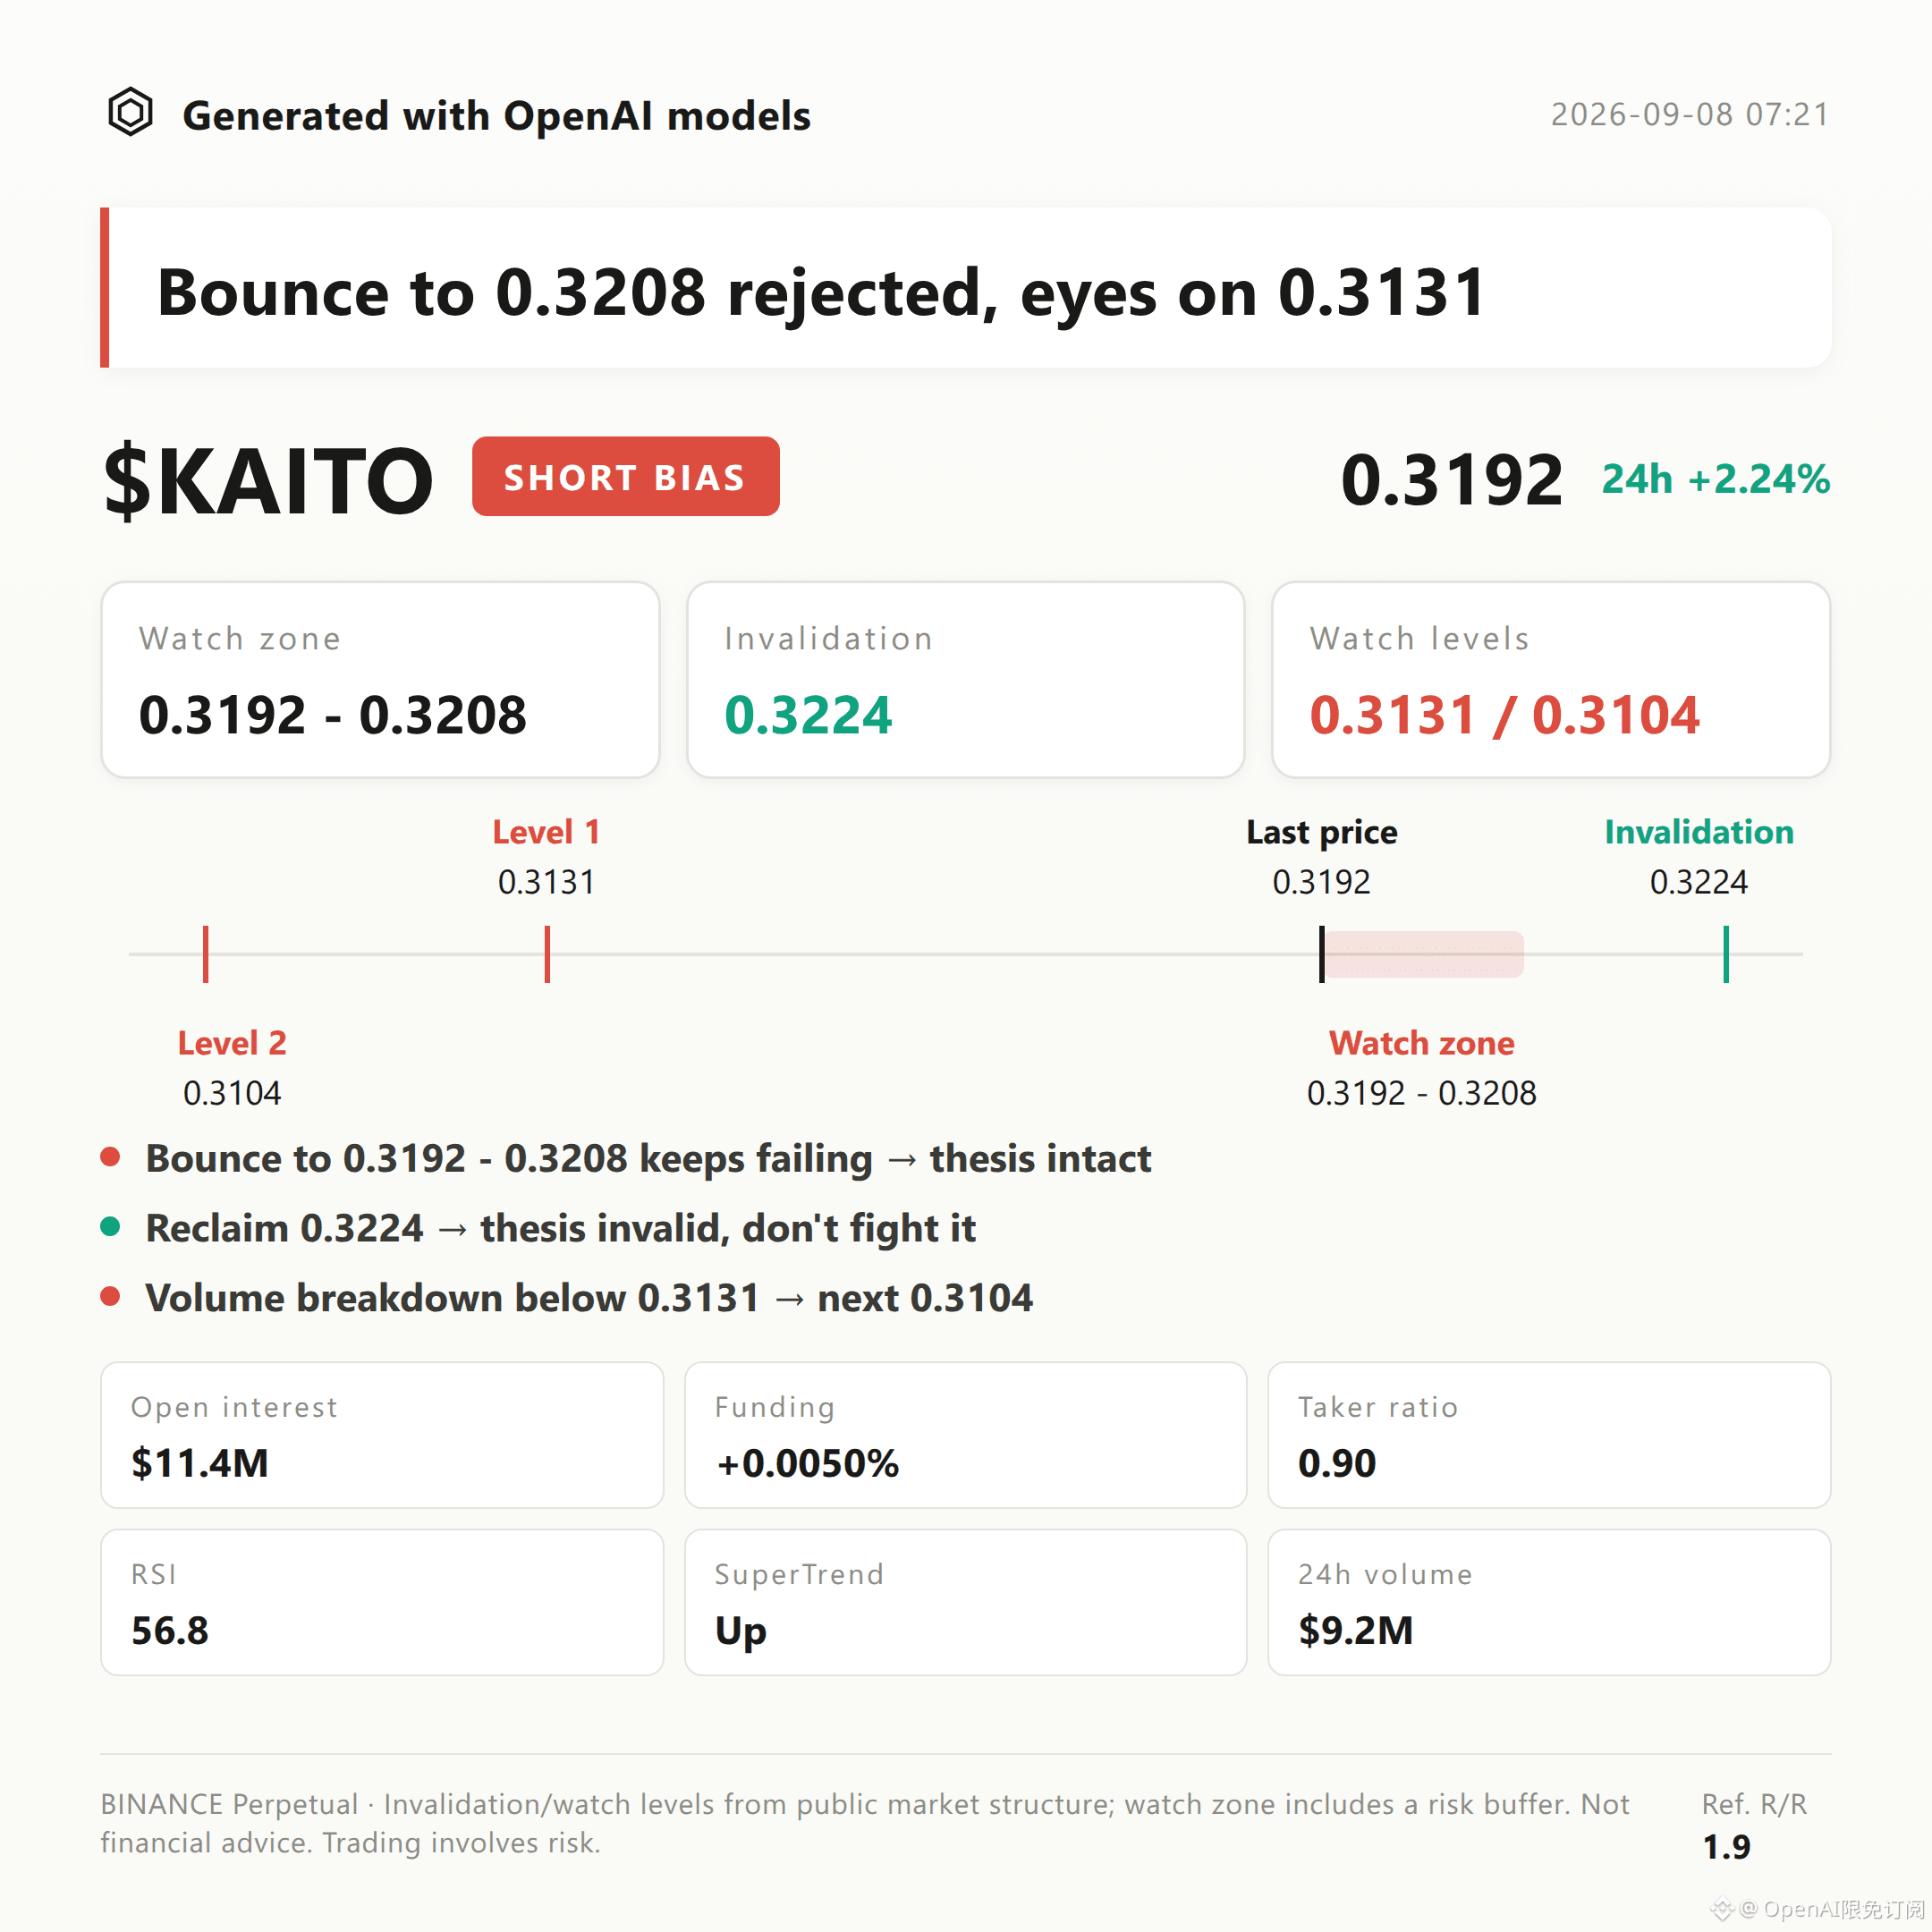
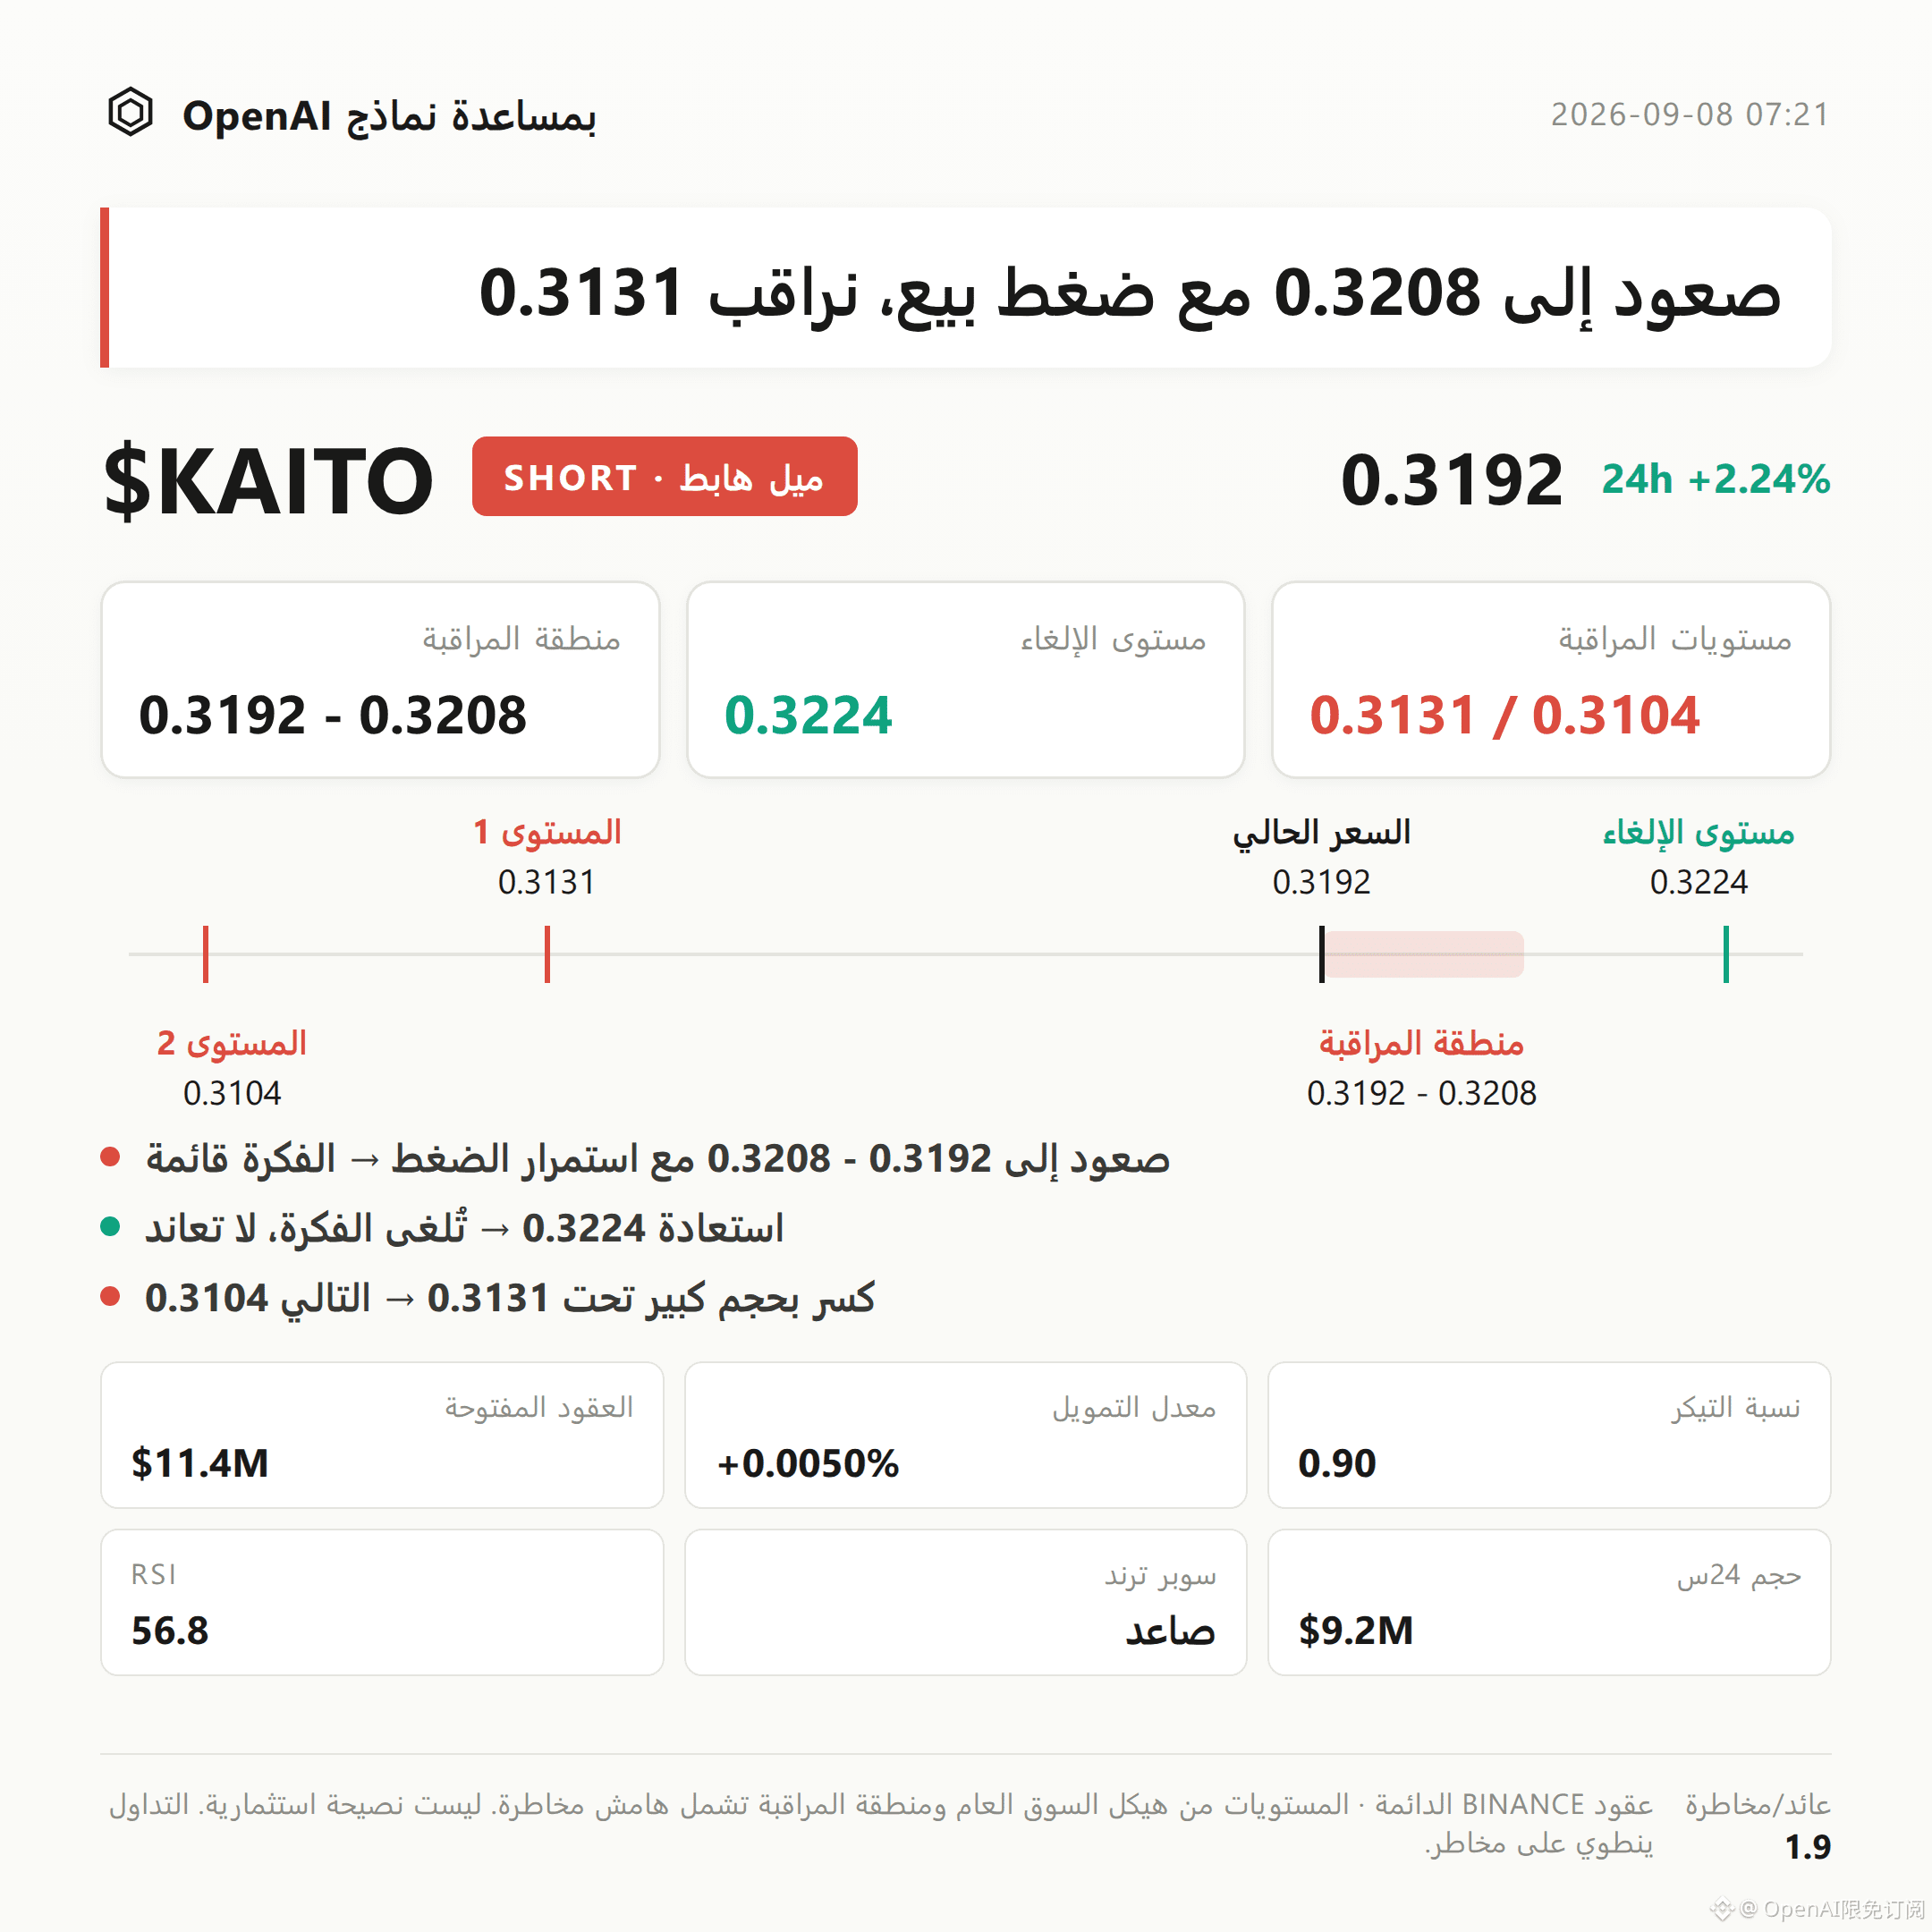
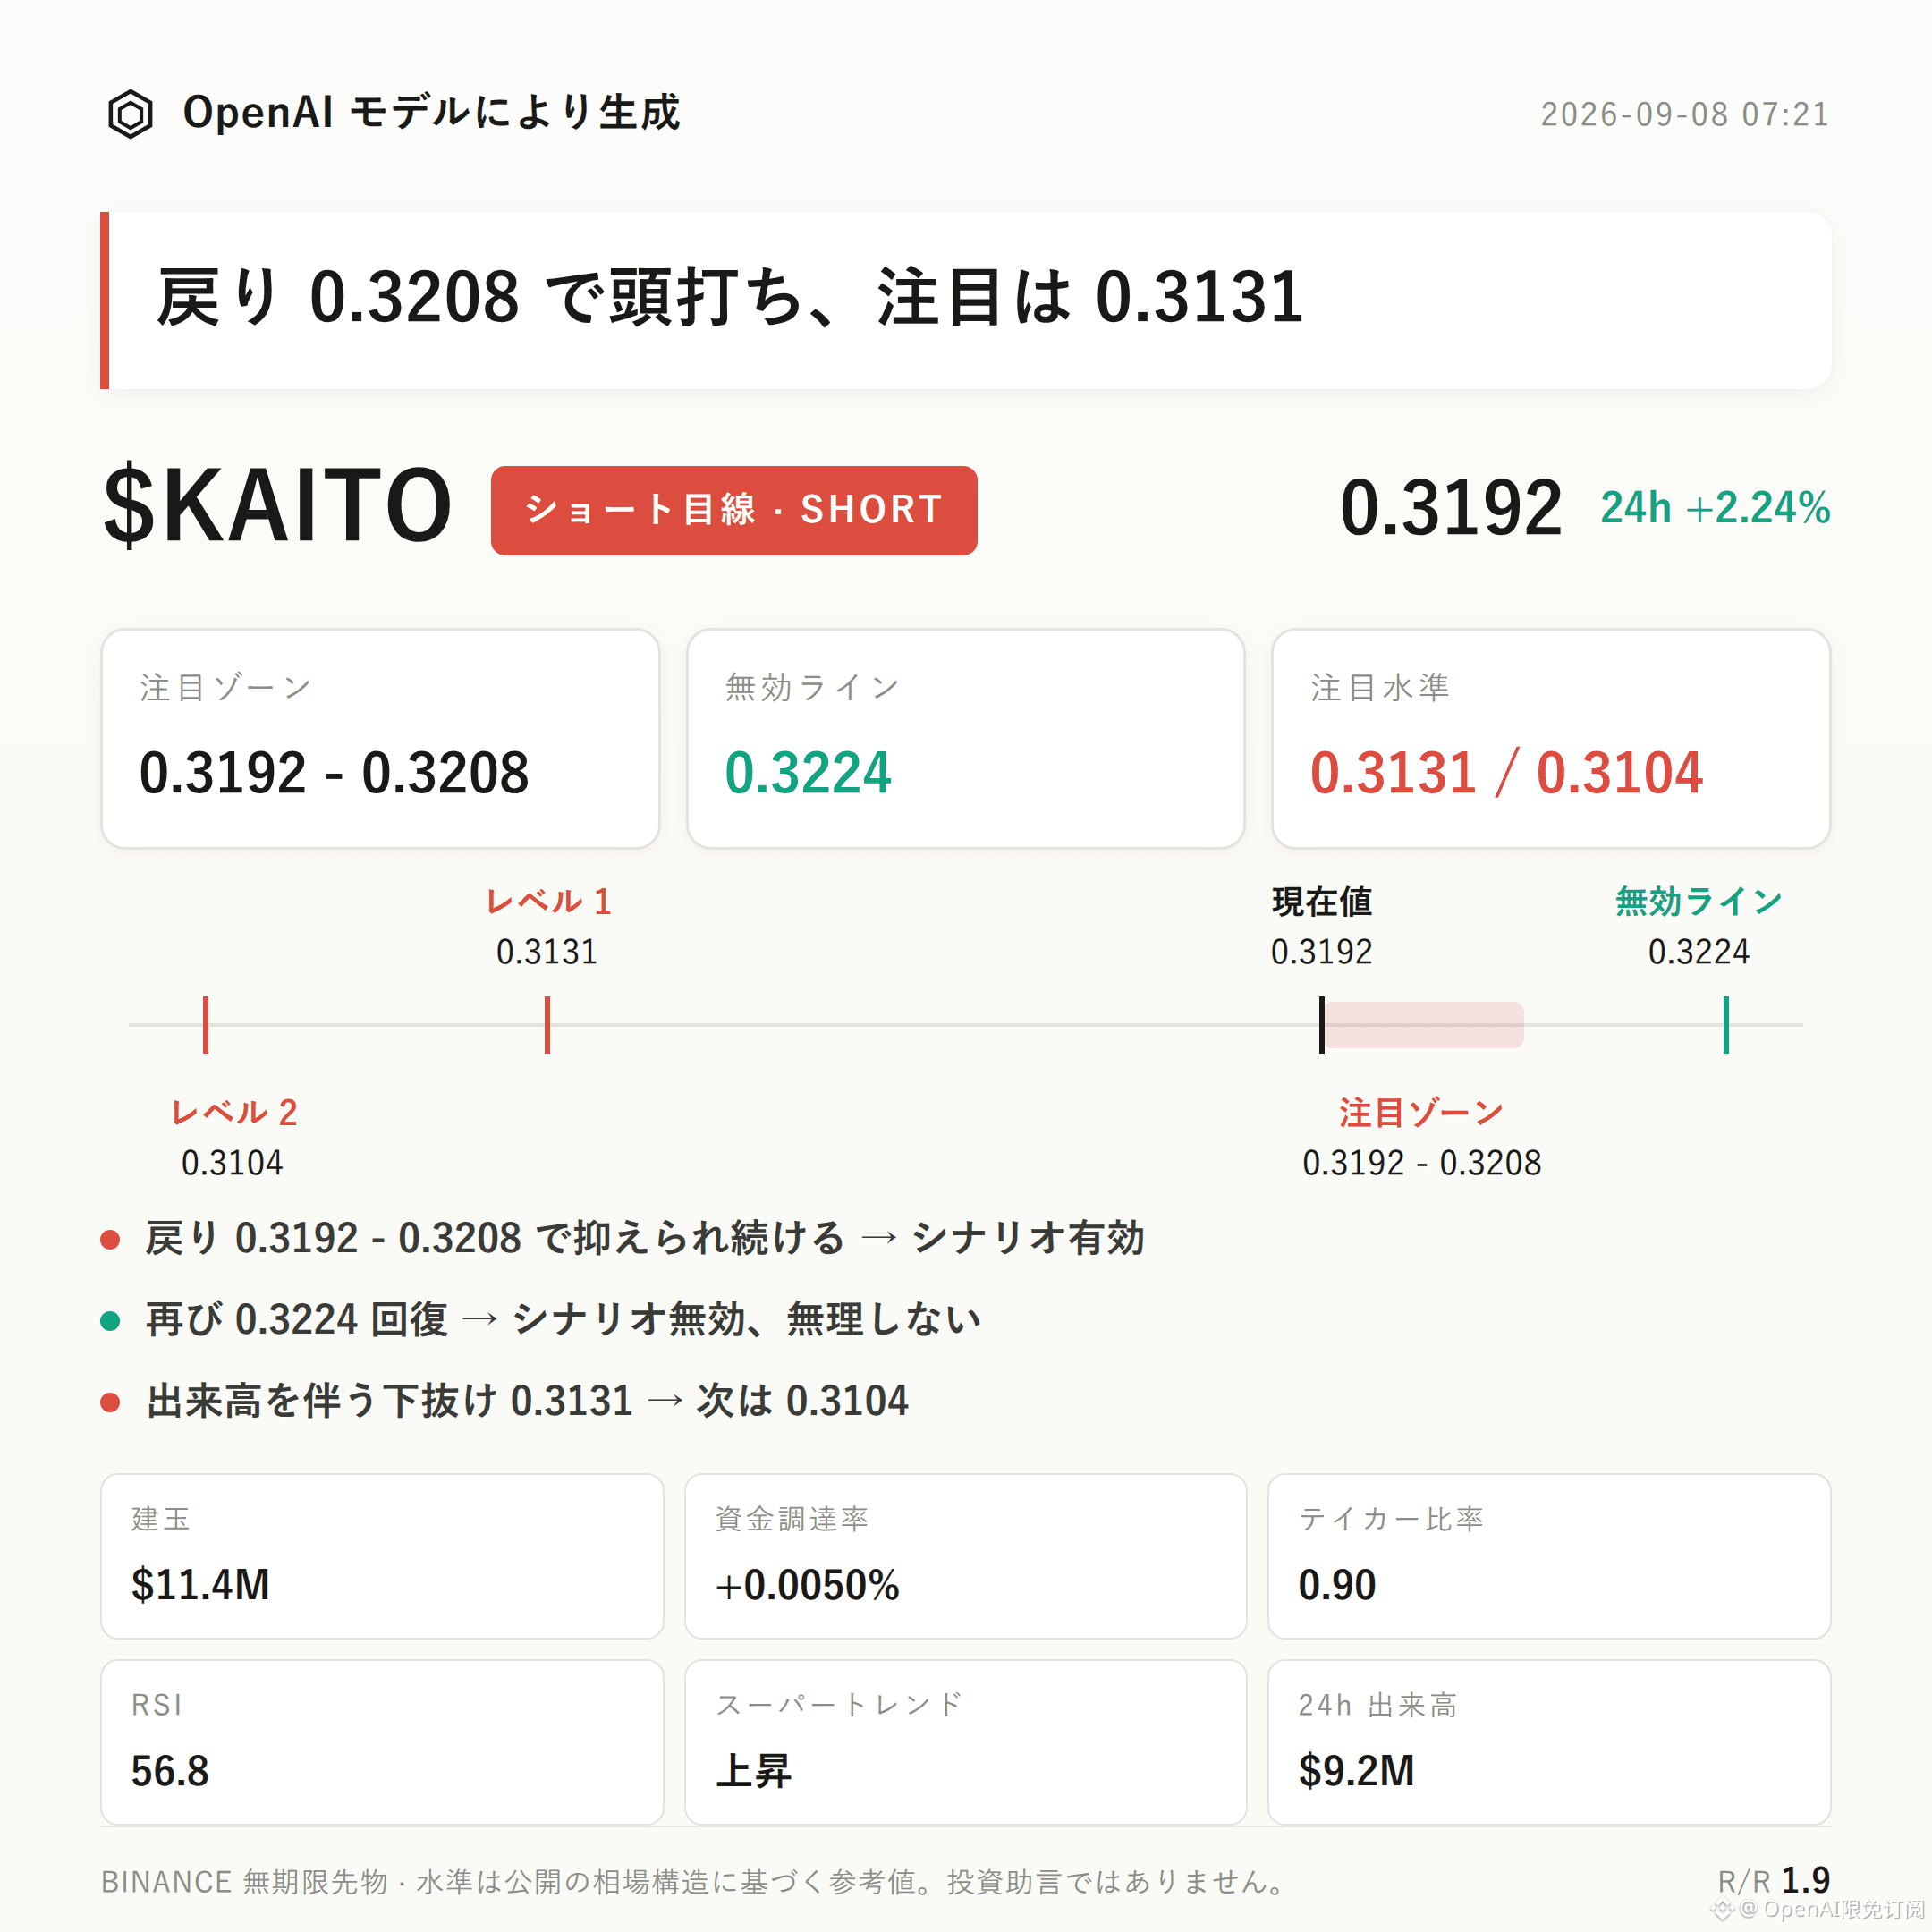
$KAITO bearish-leaning approach | Watch Range 0.3192 - 0.3208 | Invalidation Reference 0.3224 | Observation Points 0.3131 / 0.3104
$KAITO ’s current structure is moving in a bearish-leaning direction.
The key argument rests on three points: the current price 0.3192 is already close to the upper Bollinger Band around 0.3213; the buy/sell ratio of 0.90 indicates sell-side dominance in active order flow; and the 24-hour trading volume is only $9.24 million. The price is up +2.24% but volume is not cooperating strongly.
Focus on whether the pullback can be capped within the 0.3192-0.3208 zone. If it can’t be capped, then the setup needs to be reassessed.
From a technical structure perspective, the recent high is 0.3224, the recent low is 0.3104, and the current price 0.3192 is positioned slightly above the middle of the range.
Bollinger Bands: upper band 0.3213, middle band 0.3172, lower band 0.3131. The price is trading above the middle band and below the upper band.
RSI is 56.8, sitting in a neutral-to-bullish area.
MACD shows bullish momentum, and the Super Trend indicator’s current direction is upward.
It should be noted that these momentum and trend tools themselves do not support a bearish stance; this is exactly the part that needs to be verified within this post’s approach, rather than avoided.
For derivatives data: 24-hour trading volume is $9.24 million, which is moderate.
Open interest is $11.39 million, with a 24-hour change of +0.9%—a mild increase.
Funding rate is +0.0050%. Longs have a slight lead, but the magnitude is very small.
In the long/short accounts split, longs make up 45%, so the account structure is not one-sidedly crowded with longs.
Active buy/sell ratio of 0.90 means active sell orders are slightly dominant, which is the main data support for this post’s bearish-leaning setup.
First look at the reference zone 0.3192-0.3208. It’s more suitable for waiting for confirmation after any pullback faces pressure, rather than reacting directly at the current price.
If, after bouncing in this zone, the price is capped and falls back, the bearish-leaning structure can continue to be observed according to the original idea.
Place the invalidation reference at 0.3224. If price stands back above it, it means the current pullback structure has been broken and the bearish idea is invalid—so it should not be interpreted as bearish anymore.
For the downside extension observation points: watch 0.3131. If it breaks down on increased volume, then consider support near 0.3104 as the next checkpoint.
Reference risk-reward is 1.9 for structural reference only.
To be clear: in this instance, momentum/trend indicators such as RSI, MACD, and Super Trend do not show any obvious weakening signal, and there is no clear reverse signal. However, because the contract itself includes leverage, whether the direction is right or wrong cannot replace position/risk management.
With leverage, position discipline is more important than directional judgement.
Live trading disclosure: This account currently holds $FOGO long positions. Structurally, I continue to look for longs; my view is consistent with my position.
For reference only and not investment advice. Contracts have leverage and investing involves risk.
This article is generated with assistance from an OpenAI large model.
$KAITO #Contract Analysis
$KAITO bearish-leaning approach | Watch Range 0.3192 - 0.3208 | Invalidation Reference 0.3224 | Observation Points 0.3131 / 0.3104
$KAITO ’s current structure is moving in a bearish-leaning direction.
The key argument rests on three points: the current price 0.3192 is already close to the upper Bollinger Band around 0.3213; the buy/sell ratio of 0.90 indicates sell-side dominance in active order flow; and the 24-hour trading volume is only $9.24 million. The price is up +2.24% but volume is not cooperating strongly.
Focus on whether the pullback can be capped within the 0.3192-0.3208 zone. If it can’t be capped, then the setup needs to be reassessed.
From a technical structure perspective, the recent high is 0.3224, the recent low is 0.3104, and the current price 0.3192 is positioned slightly above the middle of the range.
Bollinger Bands: upper band 0.3213, middle band 0.3172, lower band 0.3131. The price is trading above the middle band and below the upper band.
RSI is 56.8, sitting in a neutral-to-bullish area.
MACD shows bullish momentum, and the Super Trend indicator’s current direction is upward.
It should be noted that these momentum and trend tools themselves do not support a bearish stance; this is exactly the part that needs to be verified within this post’s approach, rather than avoided.
For derivatives data: 24-hour trading volume is $9.24 million, which is moderate.
Open interest is $11.39 million, with a 24-hour change of +0.9%—a mild increase.
Funding rate is +0.0050%. Longs have a slight lead, but the magnitude is very small.
In the long/short accounts split, longs make up 45%, so the account structure is not one-sidedly crowded with longs.
Active buy/sell ratio of 0.90 means active sell orders are slightly dominant, which is the main data support for this post’s bearish-leaning setup.
First look at the reference zone 0.3192-0.3208. It’s more suitable for waiting for confirmation after any pullback faces pressure, rather than reacting directly at the current price.
If, after bouncing in this zone, the price is capped and falls back, the bearish-leaning structure can continue to be observed according to the original idea.
Place the invalidation reference at 0.3224. If price stands back above it, it means the current pullback structure has been broken and the bearish idea is invalid—so it should not be interpreted as bearish anymore.
For the downside extension observation points: watch 0.3131. If it breaks down on increased volume, then consider support near 0.3104 as the next checkpoint.
Reference risk-reward is 1.9 for structural reference only.
To be clear: in this instance, momentum/trend indicators such as RSI, MACD, and Super Trend do not show any obvious weakening signal, and there is no clear reverse signal. However, because the contract itself includes leverage, whether the direction is right or wrong cannot replace position/risk management.
With leverage, position discipline is more important than directional judgement.
Live trading disclosure: This account currently holds $FOGO long positions. Structurally, I continue to look for longs; my view is consistent with my position.
For reference only and not investment advice. Contracts have leverage and investing involves risk.
This article is generated with assistance from an OpenAI large model.
$KAITO #Contract Analysis