🔥 Is the correction over? Is it time for a
massive breakout? 🔥
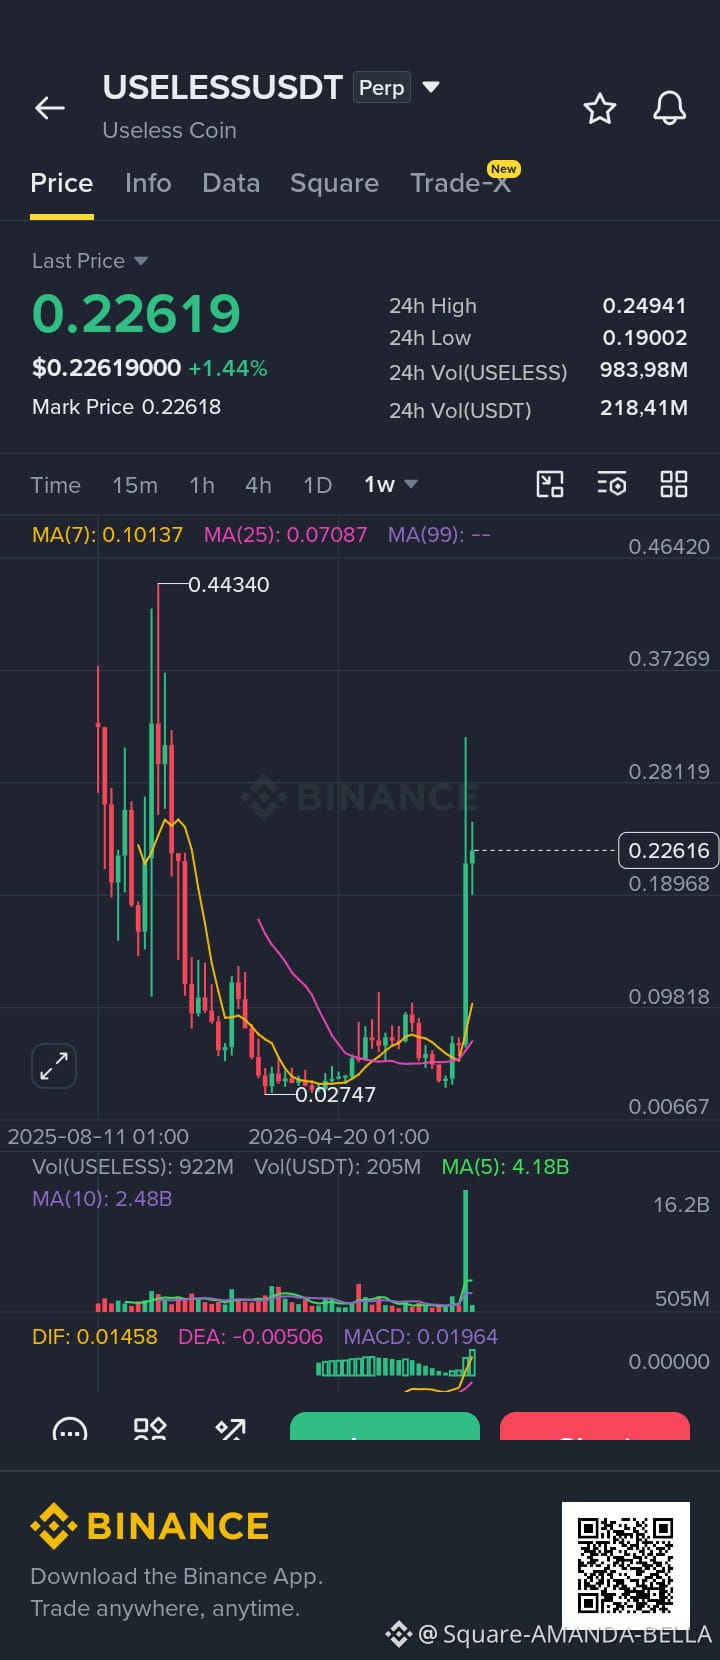
After a brutal correction from a historic high of $0.44340 down to a low of $0.02747, the signal we’re seeing today simply cannot be ignored.
What is happening right now?
On the weekly chart, we see a massive green candle—backed by significant volume—powerfully breaking through the 7-week and 25-week moving averages. The MACD has flashed a bullish crossover for the first time in a month, serving as a strong entry signal.
Simply put, the main phase—and the accumulation phase—has fully begun.
A clear roadmap:
No room for guesswork; here are the levels I’m watching:
Buy Zone: $0.22 – $0.23 (current retest zone)
Stop Loss: $0.207 (a weekly close below this level invalidates the scenario)
Staged Targets:
Target 1: $0.25
Target 2: $0.27
Target 3: $0.30
Target 4: $0.40
Target 5: $0.50 (new high)
The risk-to-reward ratio is excellent for those who manage their capital wisely.
My question to you, traders:
Do you think it will break its previous high of $0.443 this month? Or is this just a quick speculative play?
Share your thoughts in the comments 👇
$USELESS
#useless #USELESSUSDT
massive breakout? 🔥
After a brutal correction from a historic high of $0.44340 down to a low of $0.02747, the signal we’re seeing today simply cannot be ignored.
What is happening right now?
On the weekly chart, we see a massive green candle—backed by significant volume—powerfully breaking through the 7-week and 25-week moving averages. The MACD has flashed a bullish crossover for the first time in a month, serving as a strong entry signal.
Simply put, the main phase—and the accumulation phase—has fully begun.
A clear roadmap:
No room for guesswork; here are the levels I’m watching:
Buy Zone: $0.22 – $0.23 (current retest zone)
Stop Loss: $0.207 (a weekly close below this level invalidates the scenario)
Staged Targets:
Target 1: $0.25
Target 2: $0.27
Target 3: $0.30
Target 4: $0.40
Target 5: $0.50 (new high)
The risk-to-reward ratio is excellent for those who manage their capital wisely.
My question to you, traders:
Do you think it will break its previous high of $0.443 this month? Or is this just a quick speculative play?
Share your thoughts in the comments 👇
$USELESS
#useless #USELESSUSDT