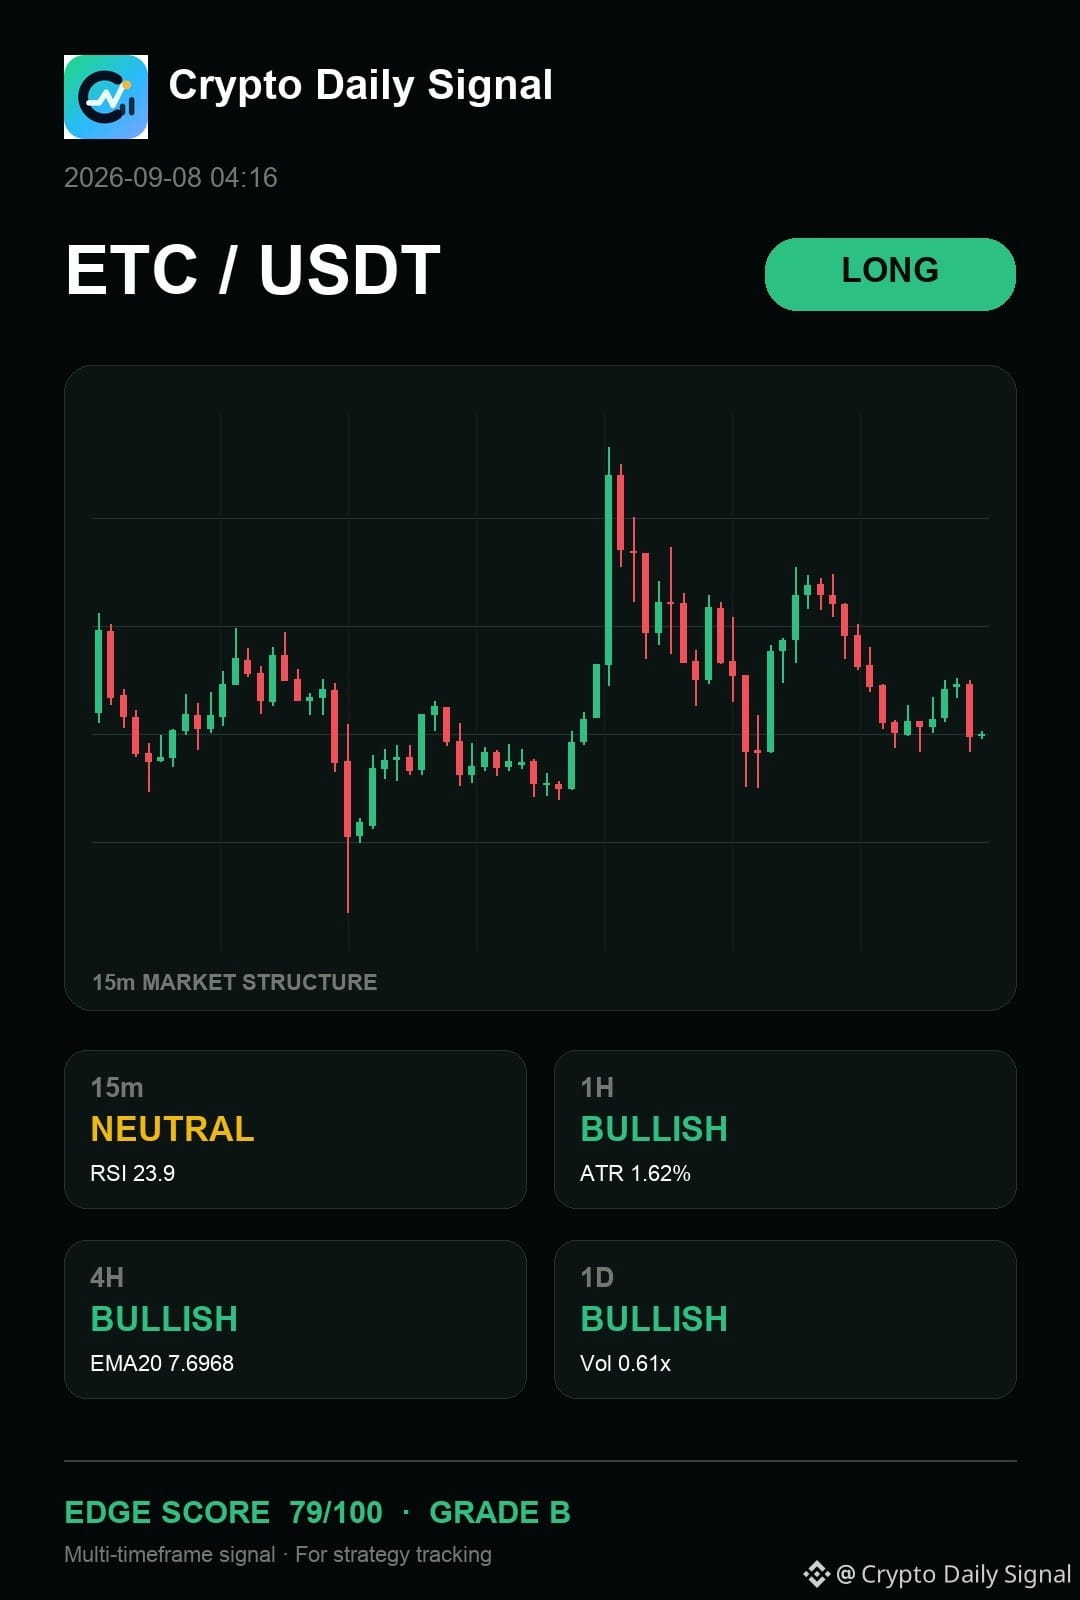
$ETC — honestly, the chart still says it keeps the bullish thesis active as the price respects the established range floor, showing buying strength rejection on the most recent candle. The wider timeframes suggest a bullish lean, though the momentum on the short-term timeframe is stalling. A real confirmation on the bigger chart would be a solid close above the recent swing high; failing to hold this range floor on a bearish print suggests a shift.
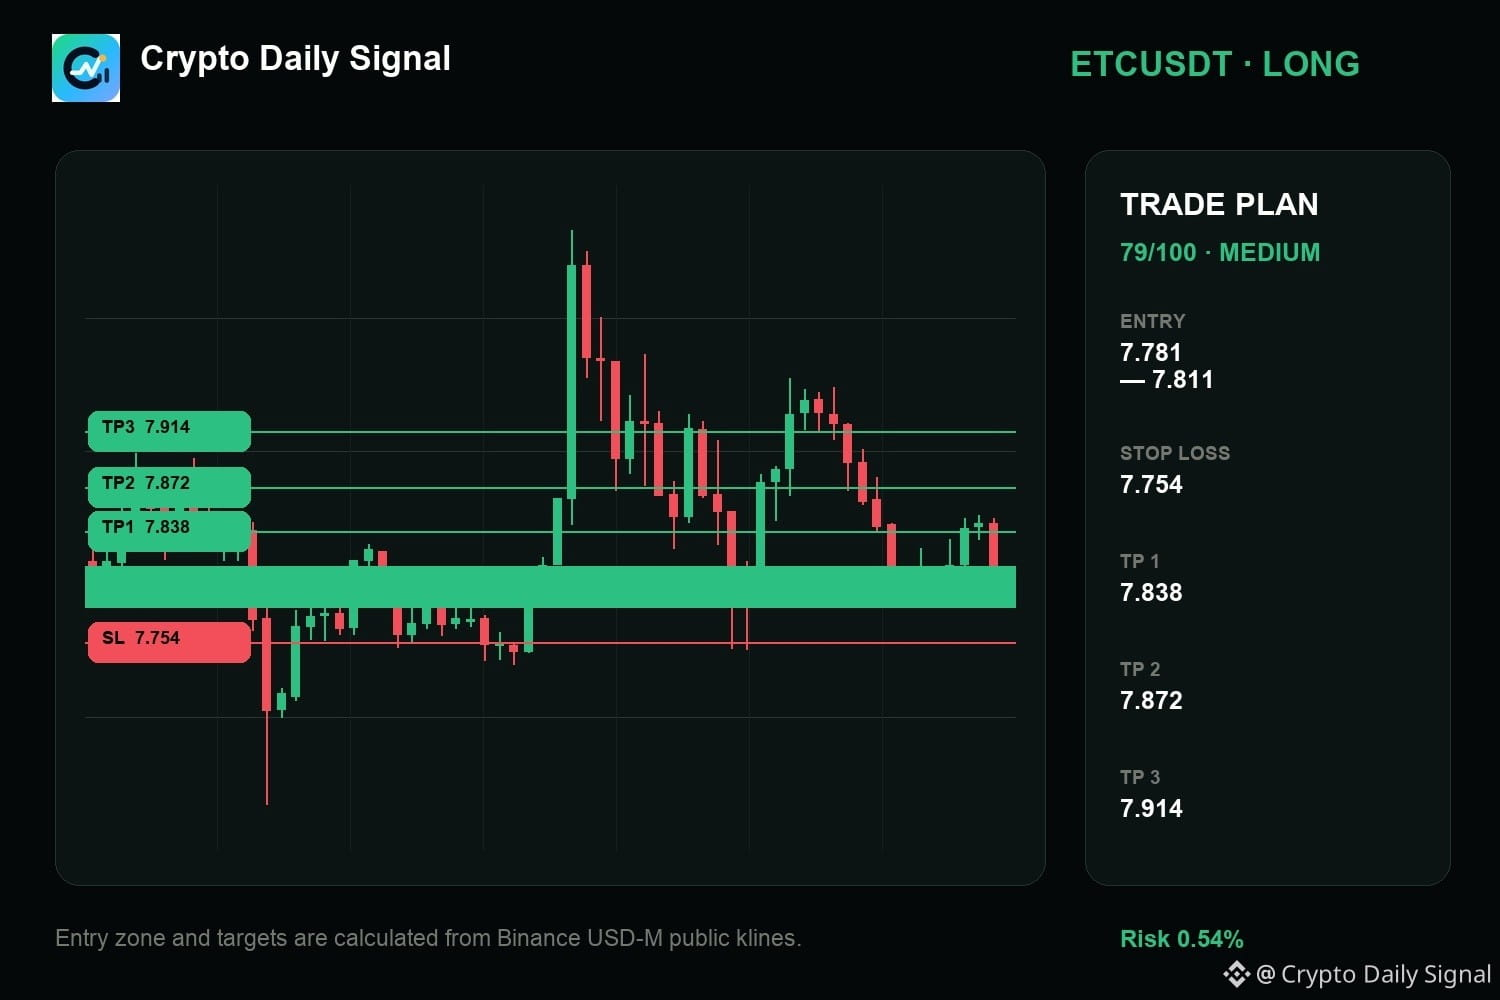
ETCUSDT LONG
IN 7.781 - 7.811
OUT 7.754
TP 7.838 · 7.872 · 7.914
What would you need to see before putting risk behind this idea?
#TradingSignal
ETCUSDT LONG
IN 7.781 - 7.811
OUT 7.754
TP 7.838 · 7.872 · 7.914
What would you need to see before putting risk behind this idea?
#TradingSignal