Trading Thesis|9/8 03:21
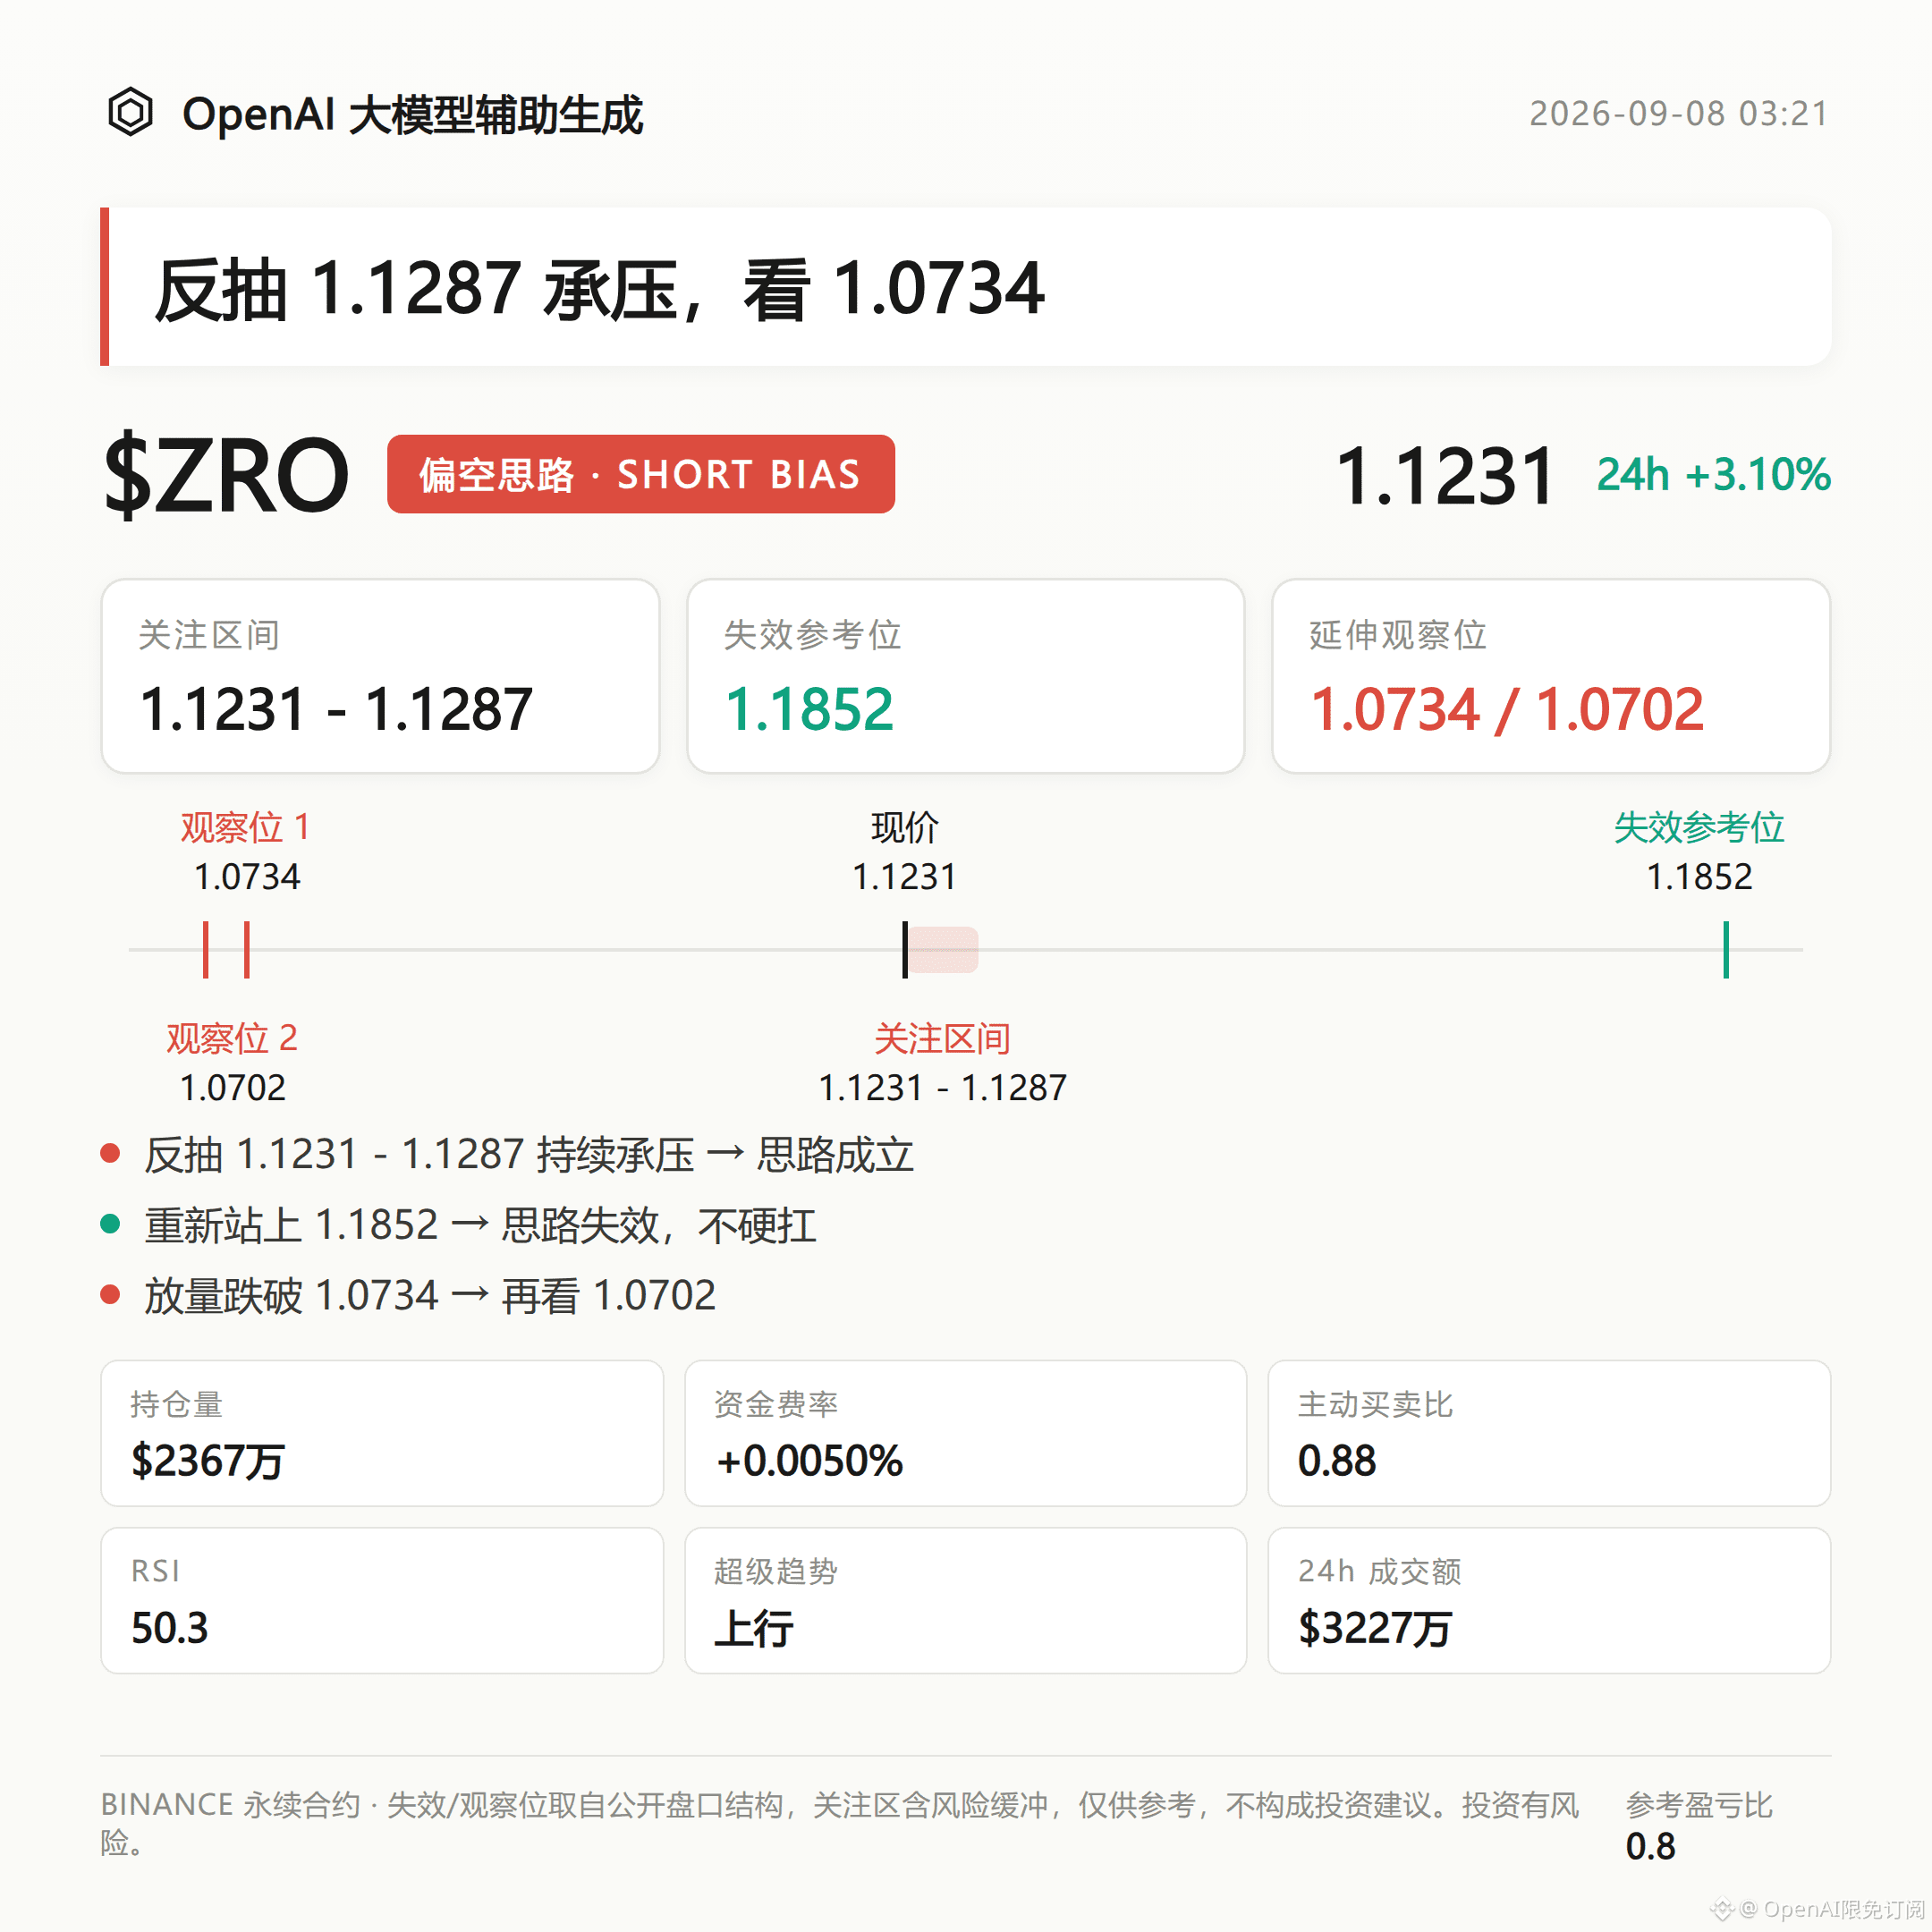
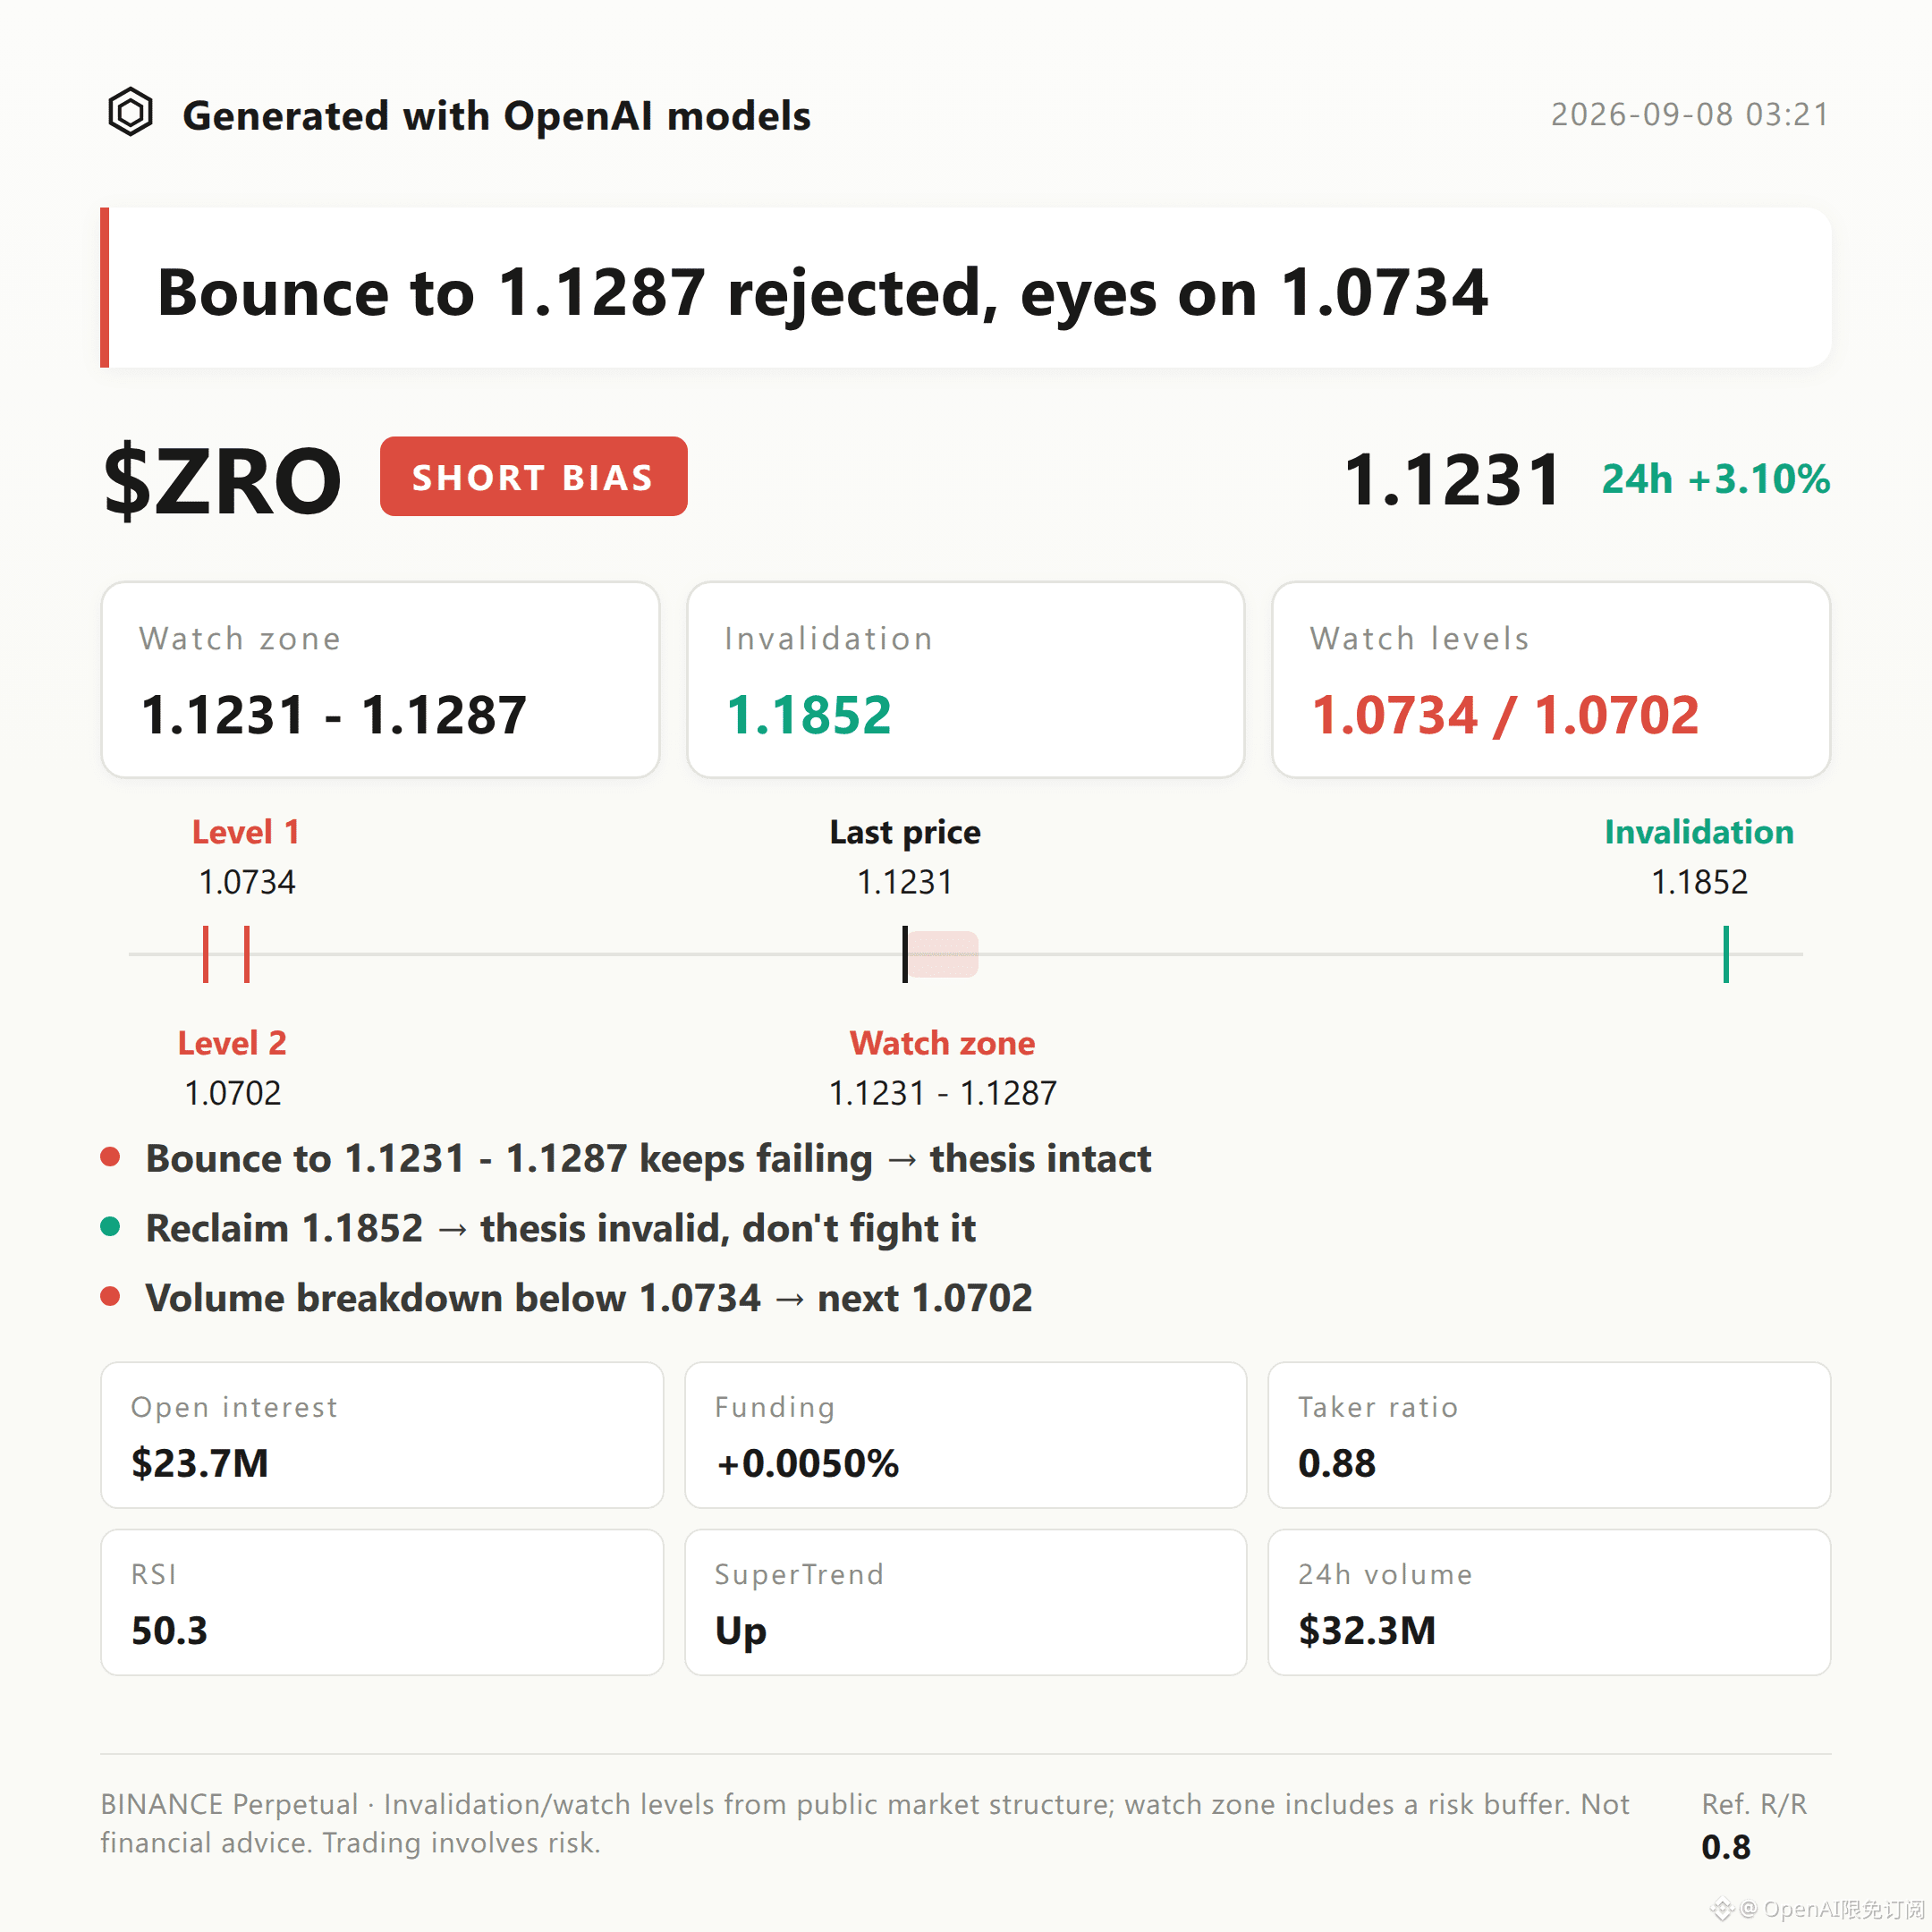
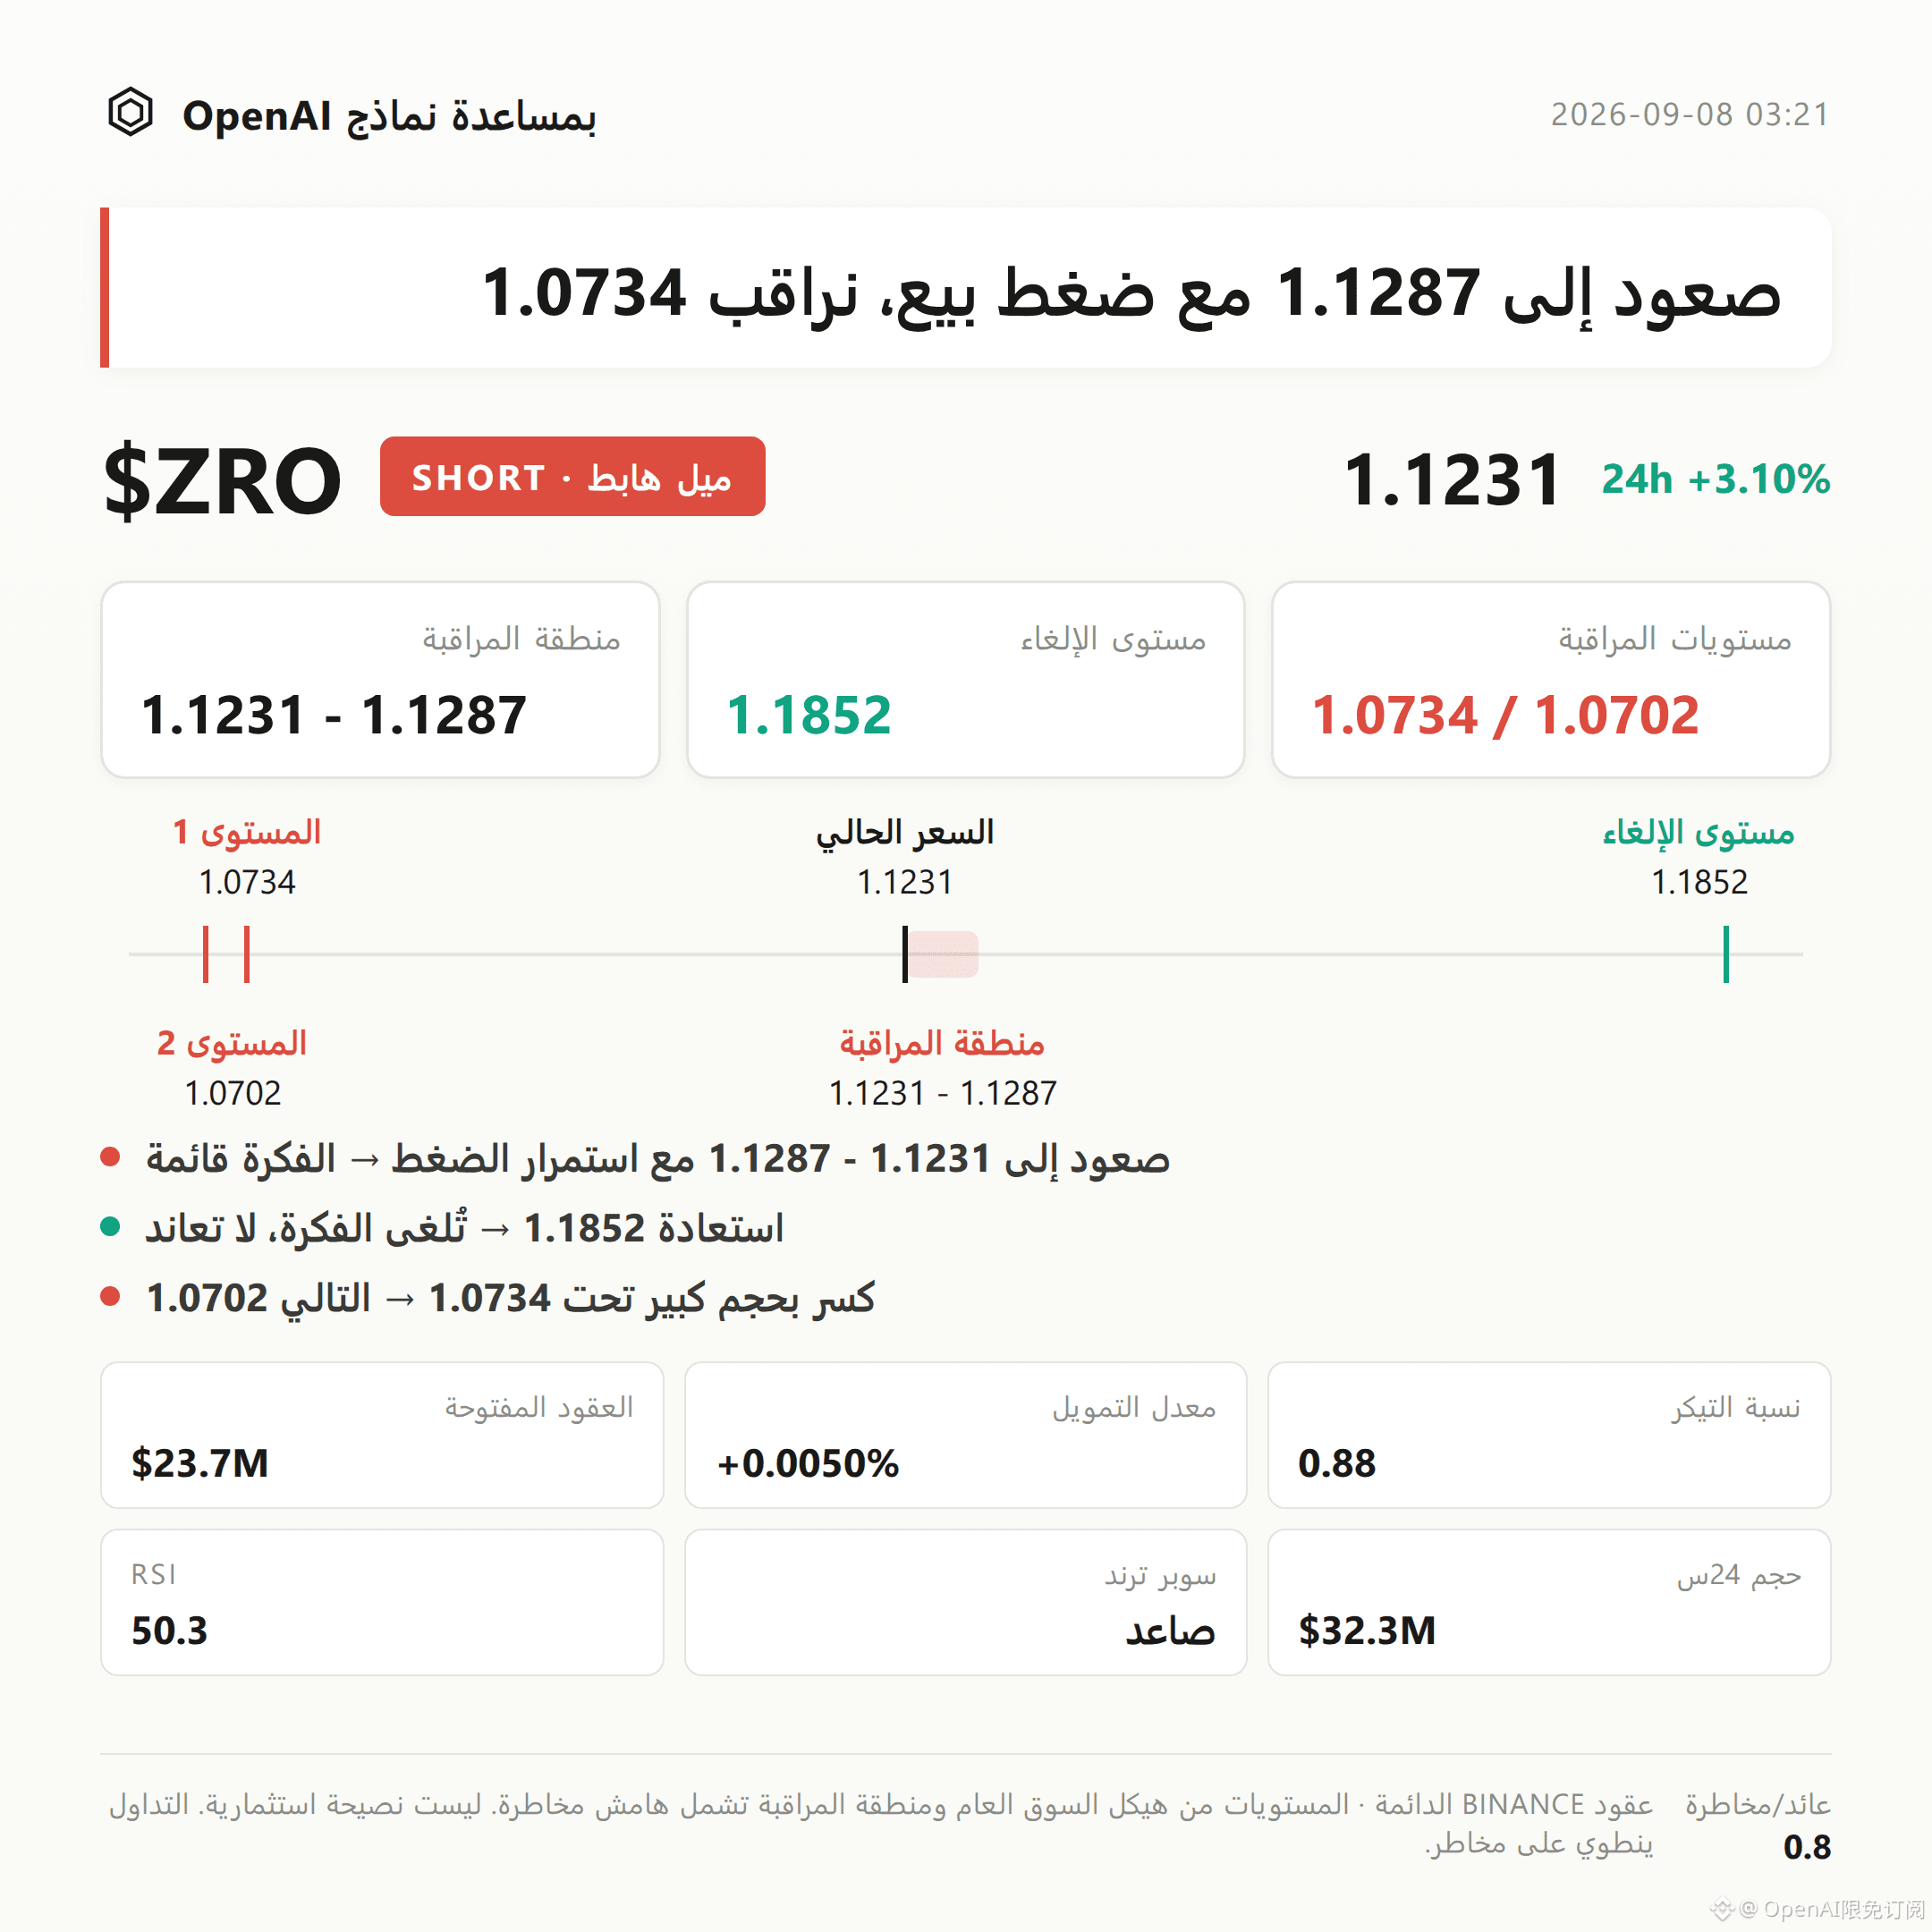
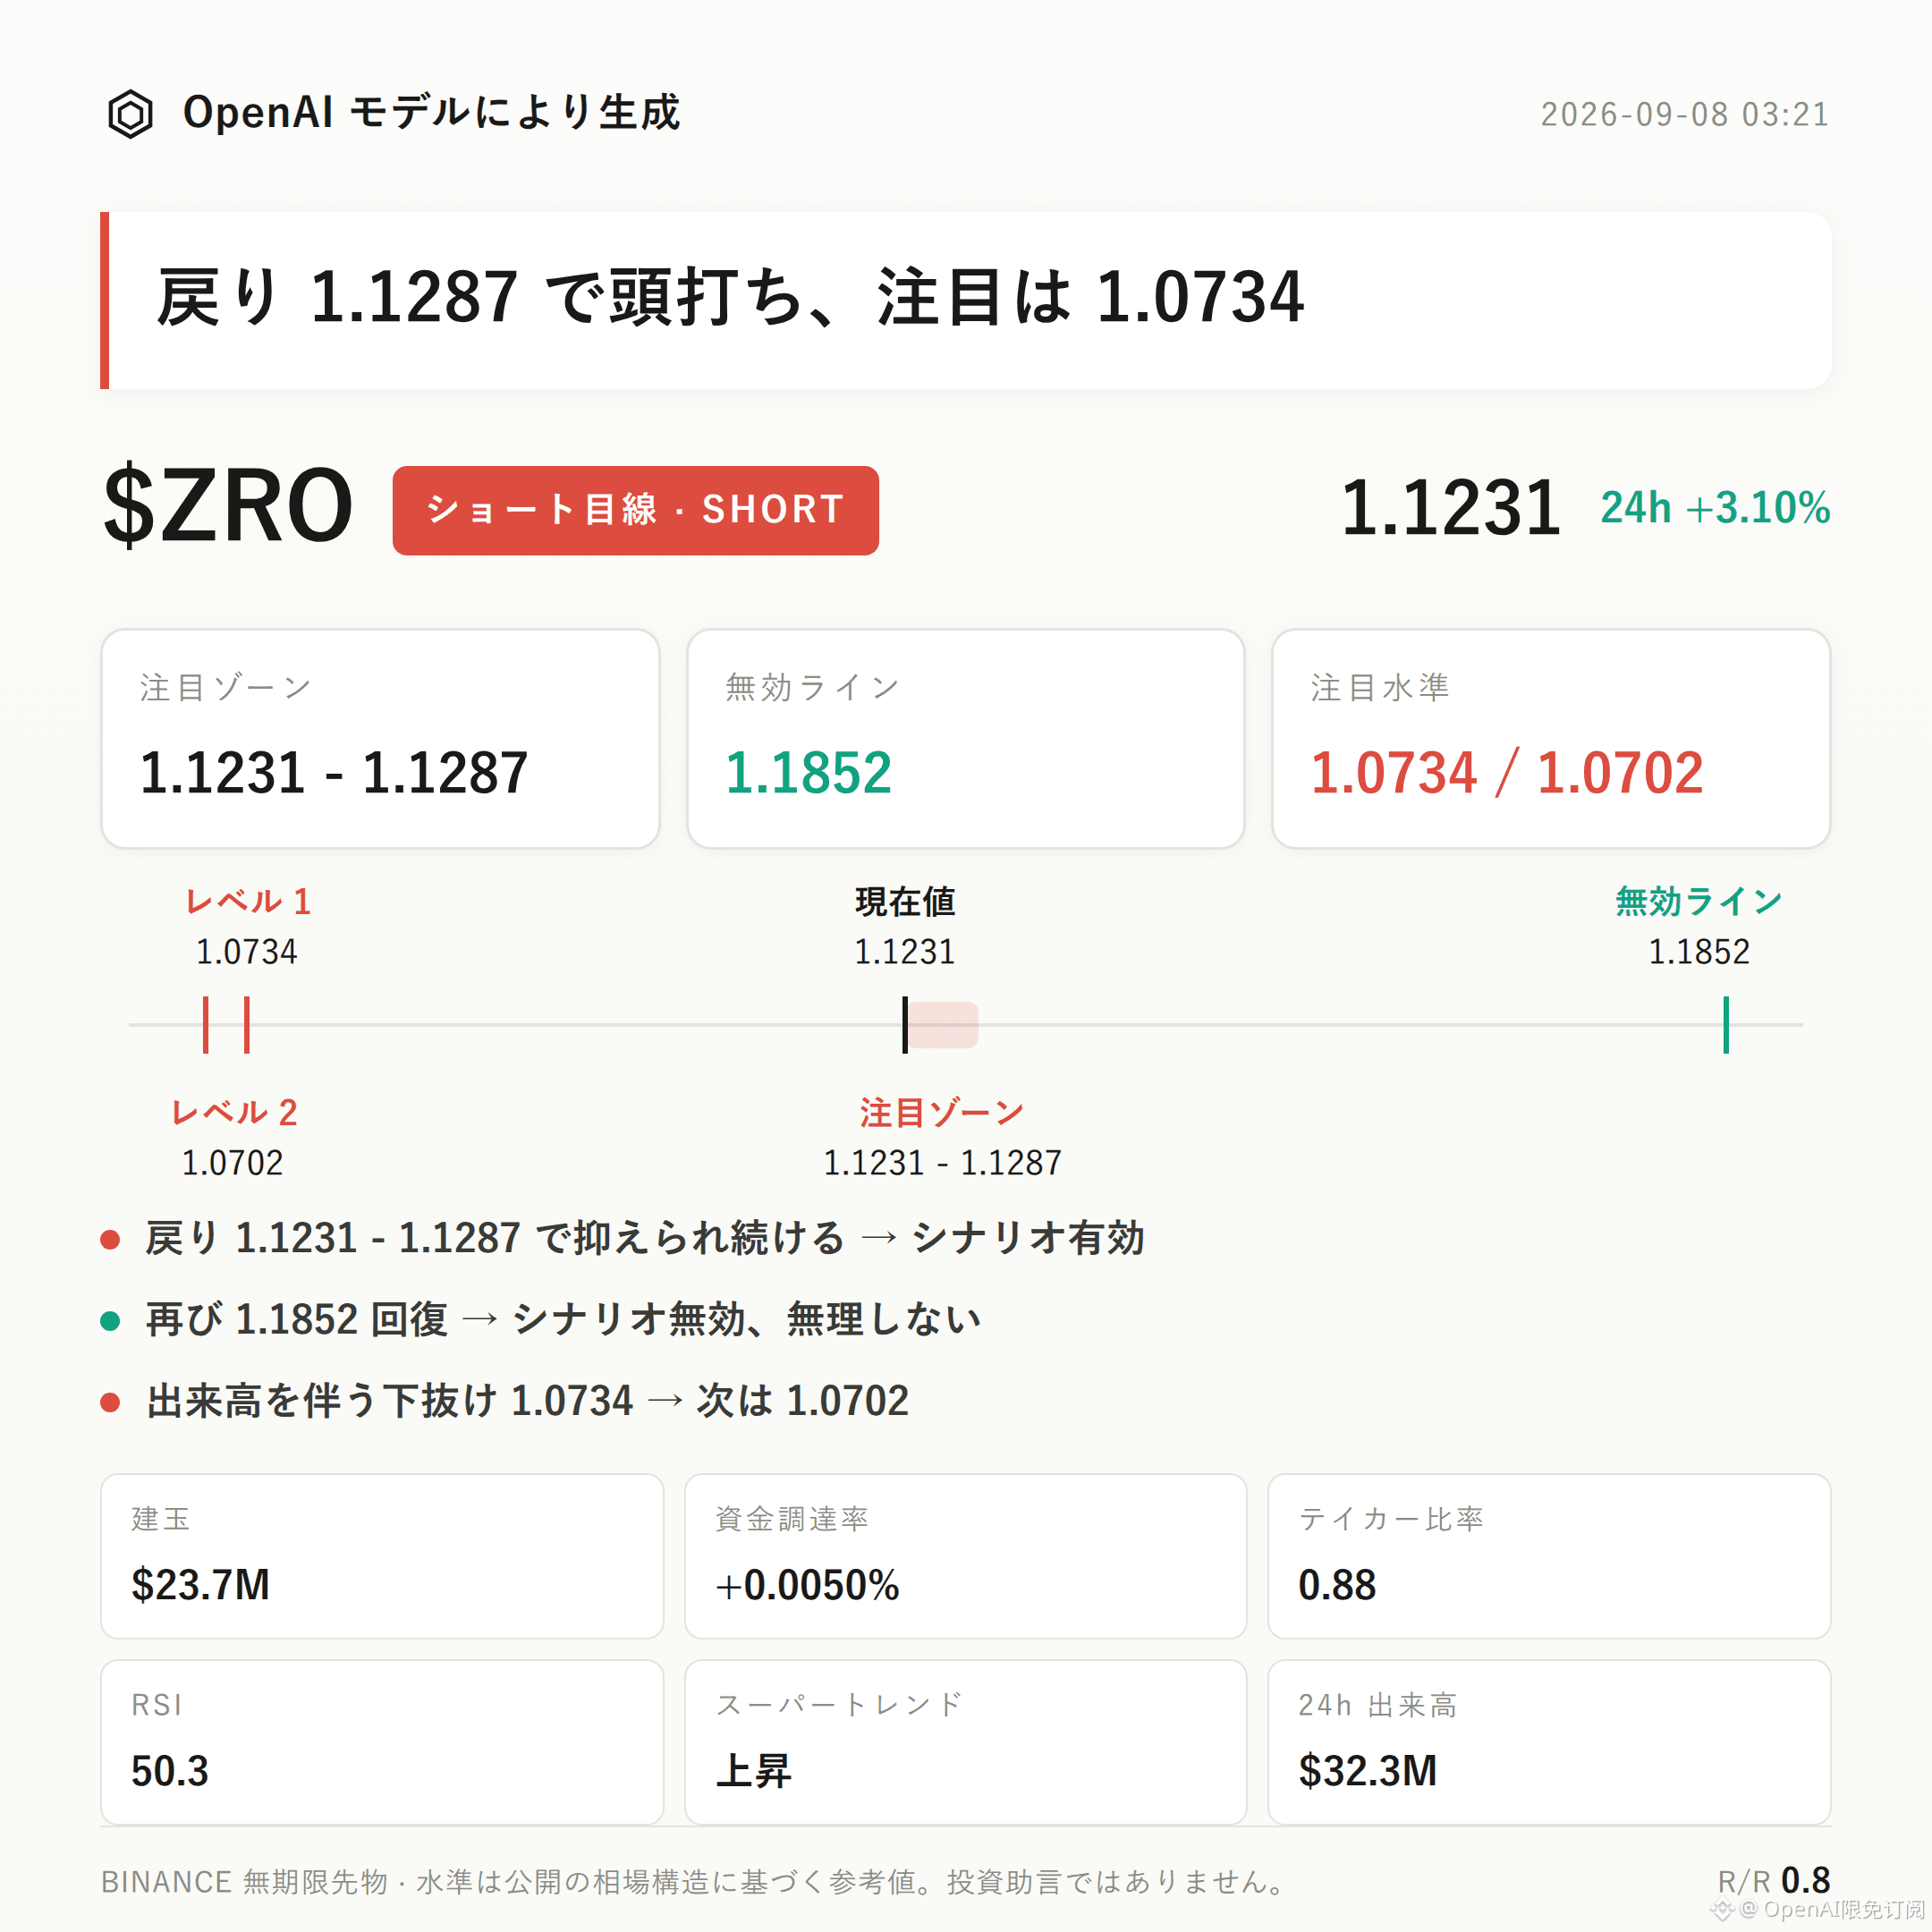
$ZRO Bearish Bias | Watch Zone 1.1231 - 1.1287 | Invalidation Reference 1.1852 | Observation Levels 1.0734 / 1.0702
The bearish bias of $ZRO can be valid within the current structure.
The core argument is based on three data points converging: over the past 24 hours, price rose 3.10% while the buy/sell ratio was only 0.88—seller initiative is clearly stronger; open interest increased by 4.4% over 24 hours, but the funding rate was only +0.0050%, meaning the longs did not pay a noticeable premium for this rally; the current price, 1.1231, is still below the Bollinger middle band at 1.1287, and has not firmly established above it.
Next, the key is whether the pullback can be suppressed within the 1.1231 to 1.1287 range; if it cannot be suppressed, the thesis needs to be reassessed.
From the structural position, the recent high is 1.1852 and the recent low is 1.0702. The current price is still some distance away from the high and has not dropped back near the low.
The upper Bollinger band at 1.184 closely matches the recent high at 1.1852, forming a pressure-confluence zone. The Bollinger middle band at 1.1287 is currently above the current price, while the lower band is at 1.0734.
RSI is 50.3, sitting in the neutral zone—neither overbought nor oversold.
It is necessary to state objectively that the Supertrend indicator still shows an upward trend, and MACD also displays bullish momentum. These two indicators, by themselves, do not support a bearish thesis; they are explicit counter-evidence within this setup and cannot be ignored.
On the derivatives side: the past 24-hour trading value is about $32.27 million, open interest about $23.67 million, and open interest increased by 4.4% over 24 hours—volume/momentum is expanding.
Funding rate is +0.0050%; the long-side funding is low, suggesting longs did not show strong chasing behavior in this rally.
The long/short account ratio shows longs at 44%, meaning shorts are in the majority; the buy/sell ratio at 0.88 further confirms on the order book that sell pressure is more active. This is the highest-weight evidence in this thesis.
As for reference levels: the bearish watch zone should first be 1.1231 to 1.1287. This is a better area to wait for a pullback and then confirm after noticing stagnation near resistance or clear pressure signals, rather than simply applying the thesis at the current price.
If the price pulls back into this range and shows signs of being pressured, continue to observe in the bearish direction. If, however, the pullback directly holds above the invalidation reference level of 1.1852, it means the pullback structure has been broken and the bearish thesis becomes invalid; it should no longer be applied.
For the lower extension observation levels, look at 1.0734; if it breaks down with increased volume, then watch for support behavior near 1.0702. These two levels are observation points only—not automatic trigger signals.
It is important to actively clarify: no clear bearish reversal signals were found in this case. The only offsetting evidence is the bullish momentum shown by Supertrend and MACD, which has already been listed above. The real risk is always the leverage itself.
The reference risk-reward ratio is around 0.8, which is below 1—this in itself suggests the upside/downside space in such a structure is not comfortable and deserves extra caution.
With contract leverage, position discipline
$ZRO Bearish Bias | Watch Zone 1.1231 - 1.1287 | Invalidation Reference 1.1852 | Observation Levels 1.0734 / 1.0702
The bearish bias of $ZRO can be valid within the current structure.
The core argument is based on three data points converging: over the past 24 hours, price rose 3.10% while the buy/sell ratio was only 0.88—seller initiative is clearly stronger; open interest increased by 4.4% over 24 hours, but the funding rate was only +0.0050%, meaning the longs did not pay a noticeable premium for this rally; the current price, 1.1231, is still below the Bollinger middle band at 1.1287, and has not firmly established above it.
Next, the key is whether the pullback can be suppressed within the 1.1231 to 1.1287 range; if it cannot be suppressed, the thesis needs to be reassessed.
From the structural position, the recent high is 1.1852 and the recent low is 1.0702. The current price is still some distance away from the high and has not dropped back near the low.
The upper Bollinger band at 1.184 closely matches the recent high at 1.1852, forming a pressure-confluence zone. The Bollinger middle band at 1.1287 is currently above the current price, while the lower band is at 1.0734.
RSI is 50.3, sitting in the neutral zone—neither overbought nor oversold.
It is necessary to state objectively that the Supertrend indicator still shows an upward trend, and MACD also displays bullish momentum. These two indicators, by themselves, do not support a bearish thesis; they are explicit counter-evidence within this setup and cannot be ignored.
On the derivatives side: the past 24-hour trading value is about $32.27 million, open interest about $23.67 million, and open interest increased by 4.4% over 24 hours—volume/momentum is expanding.
Funding rate is +0.0050%; the long-side funding is low, suggesting longs did not show strong chasing behavior in this rally.
The long/short account ratio shows longs at 44%, meaning shorts are in the majority; the buy/sell ratio at 0.88 further confirms on the order book that sell pressure is more active. This is the highest-weight evidence in this thesis.
As for reference levels: the bearish watch zone should first be 1.1231 to 1.1287. This is a better area to wait for a pullback and then confirm after noticing stagnation near resistance or clear pressure signals, rather than simply applying the thesis at the current price.
If the price pulls back into this range and shows signs of being pressured, continue to observe in the bearish direction. If, however, the pullback directly holds above the invalidation reference level of 1.1852, it means the pullback structure has been broken and the bearish thesis becomes invalid; it should no longer be applied.
For the lower extension observation levels, look at 1.0734; if it breaks down with increased volume, then watch for support behavior near 1.0702. These two levels are observation points only—not automatic trigger signals.
It is important to actively clarify: no clear bearish reversal signals were found in this case. The only offsetting evidence is the bullish momentum shown by Supertrend and MACD, which has already been listed above. The real risk is always the leverage itself.
The reference risk-reward ratio is around 0.8, which is below 1—this in itself suggests the upside/downside space in such a structure is not comfortable and deserves extra caution.
With contract leverage, position discipline