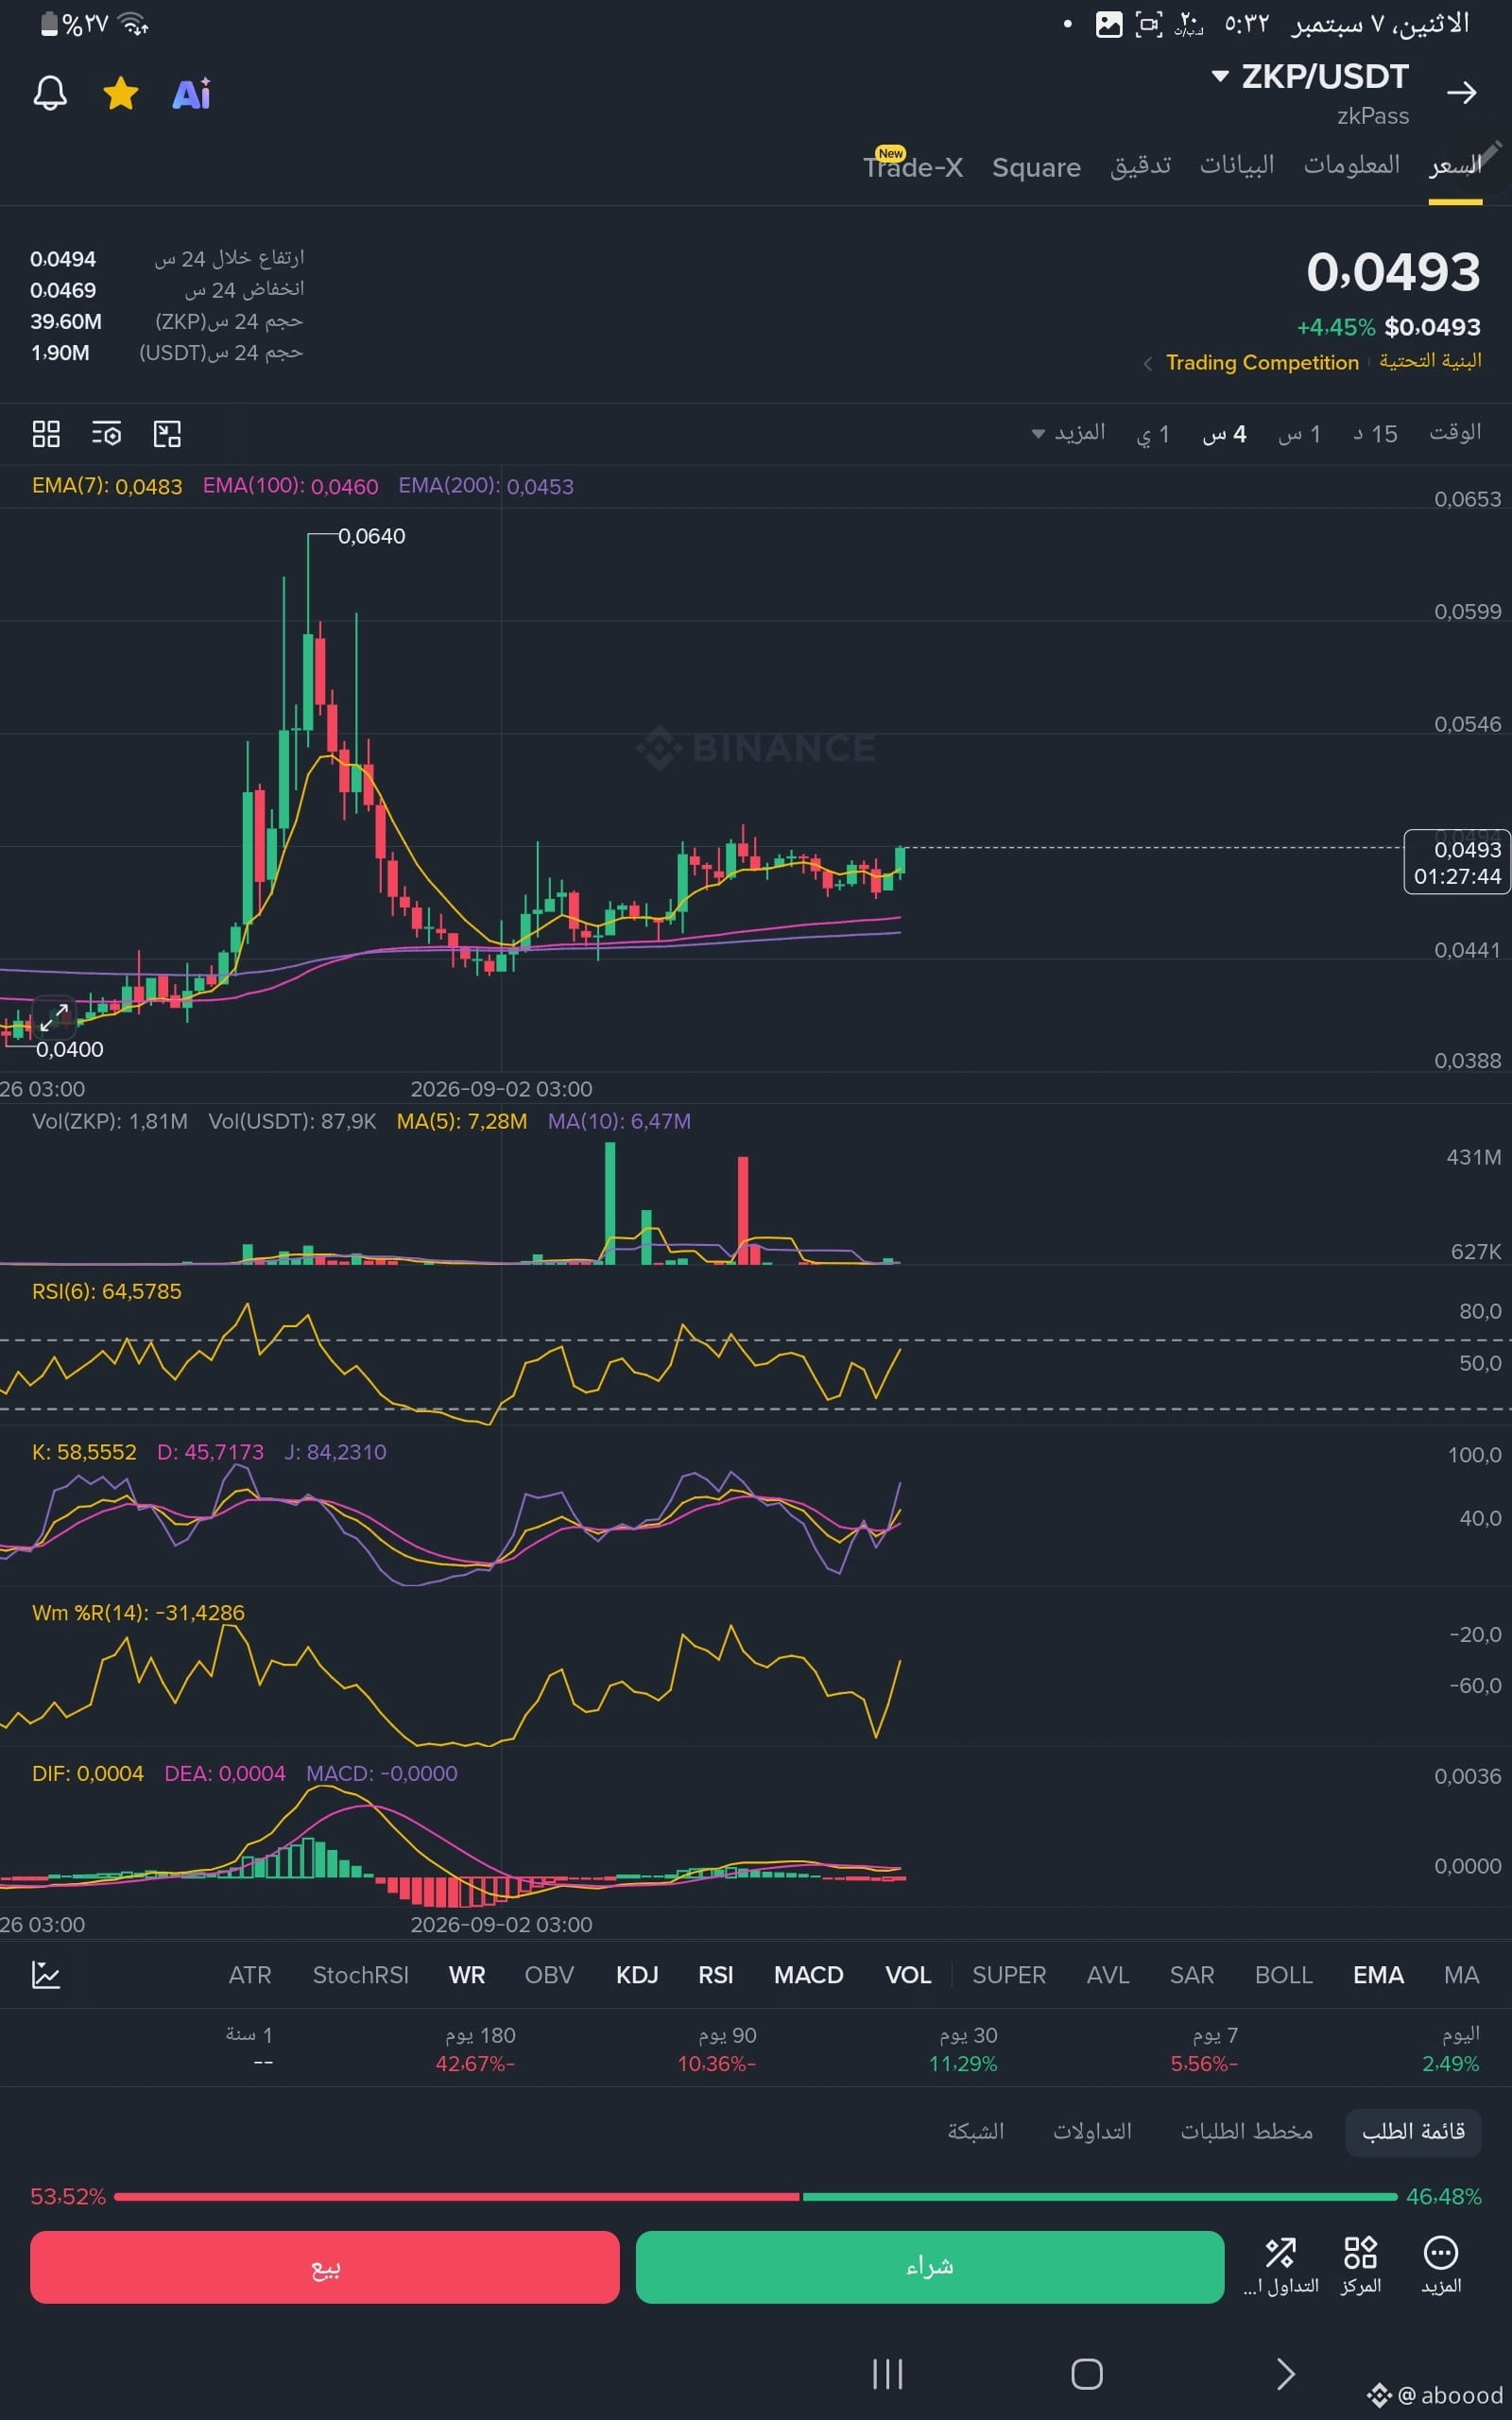
📊 Technical Analysis $ZKP based on frame integration
1️⃣ 4-hour frame (Medium-term trend: positive and accumulative 📈)
The price managed to stabilize above the major moving averages (EMA 100 and EMA 200) and broke through the 0.0483 levels.
The overall movement shows a positive horizontal accumulation, attempting to break upward to conclude the sideways behavior.
2️⃣ 15-minute frame (Instant trading: bullish overbought ⚠️)
The price surged in a quick, consecutive upward wave from the 0.0469 bottom to touch the immediate peak at 0.0494.
A strong warning signal: the RSI (6) indicator exploded to reach 92.2 levels, and the KDJ indicator is crossing at a very high peak (above 90). This overbought condition tells us technically that the price urgently needs a correction and a temporary drop to calm the indicators.
⚠️ Summary (Entry Plan):
The overall direction on the 4-hour timeframe is promising, but buying immediately at the current price 0.0492 is risky due to the inflated 15-minute overbought condition.
Best scenario and smart entry: don’t buy now—wait for profit-taking to occur, followed by a pullback on the 15-minute timeframe. This will allow the price to retest the dynamic support zones extending between 0.0481 and 0.0489 (where the moving averages converge there).
Risk Management:
Stop Loss (SL): close at 0.045
Take Profits (TP): first 0.0546, then 0.059
#ZcashRises45%WeeklyToHighestSince2016 #USIranTradeTankerStrikesEscalate #SideSwapSuspendsLiquidServices $NVDAB $XRP
1️⃣ 4-hour frame (Medium-term trend: positive and accumulative 📈)
The price managed to stabilize above the major moving averages (EMA 100 and EMA 200) and broke through the 0.0483 levels.
The overall movement shows a positive horizontal accumulation, attempting to break upward to conclude the sideways behavior.
2️⃣ 15-minute frame (Instant trading: bullish overbought ⚠️)
The price surged in a quick, consecutive upward wave from the 0.0469 bottom to touch the immediate peak at 0.0494.
A strong warning signal: the RSI (6) indicator exploded to reach 92.2 levels, and the KDJ indicator is crossing at a very high peak (above 90). This overbought condition tells us technically that the price urgently needs a correction and a temporary drop to calm the indicators.
⚠️ Summary (Entry Plan):
The overall direction on the 4-hour timeframe is promising, but buying immediately at the current price 0.0492 is risky due to the inflated 15-minute overbought condition.
Best scenario and smart entry: don’t buy now—wait for profit-taking to occur, followed by a pullback on the 15-minute timeframe. This will allow the price to retest the dynamic support zones extending between 0.0481 and 0.0489 (where the moving averages converge there).
Risk Management:
Stop Loss (SL): close at 0.045
Take Profits (TP): first 0.0546, then 0.059
#ZcashRises45%WeeklyToHighestSince2016 #USIranTradeTankerStrikesEscalate #SideSwapSuspendsLiquidServices $NVDAB $XRP