🚨 $COLLECT This wave of sharp sell-off isn’t just a normal pullback—it’s more like a collective liquidation of leveraged long positions!
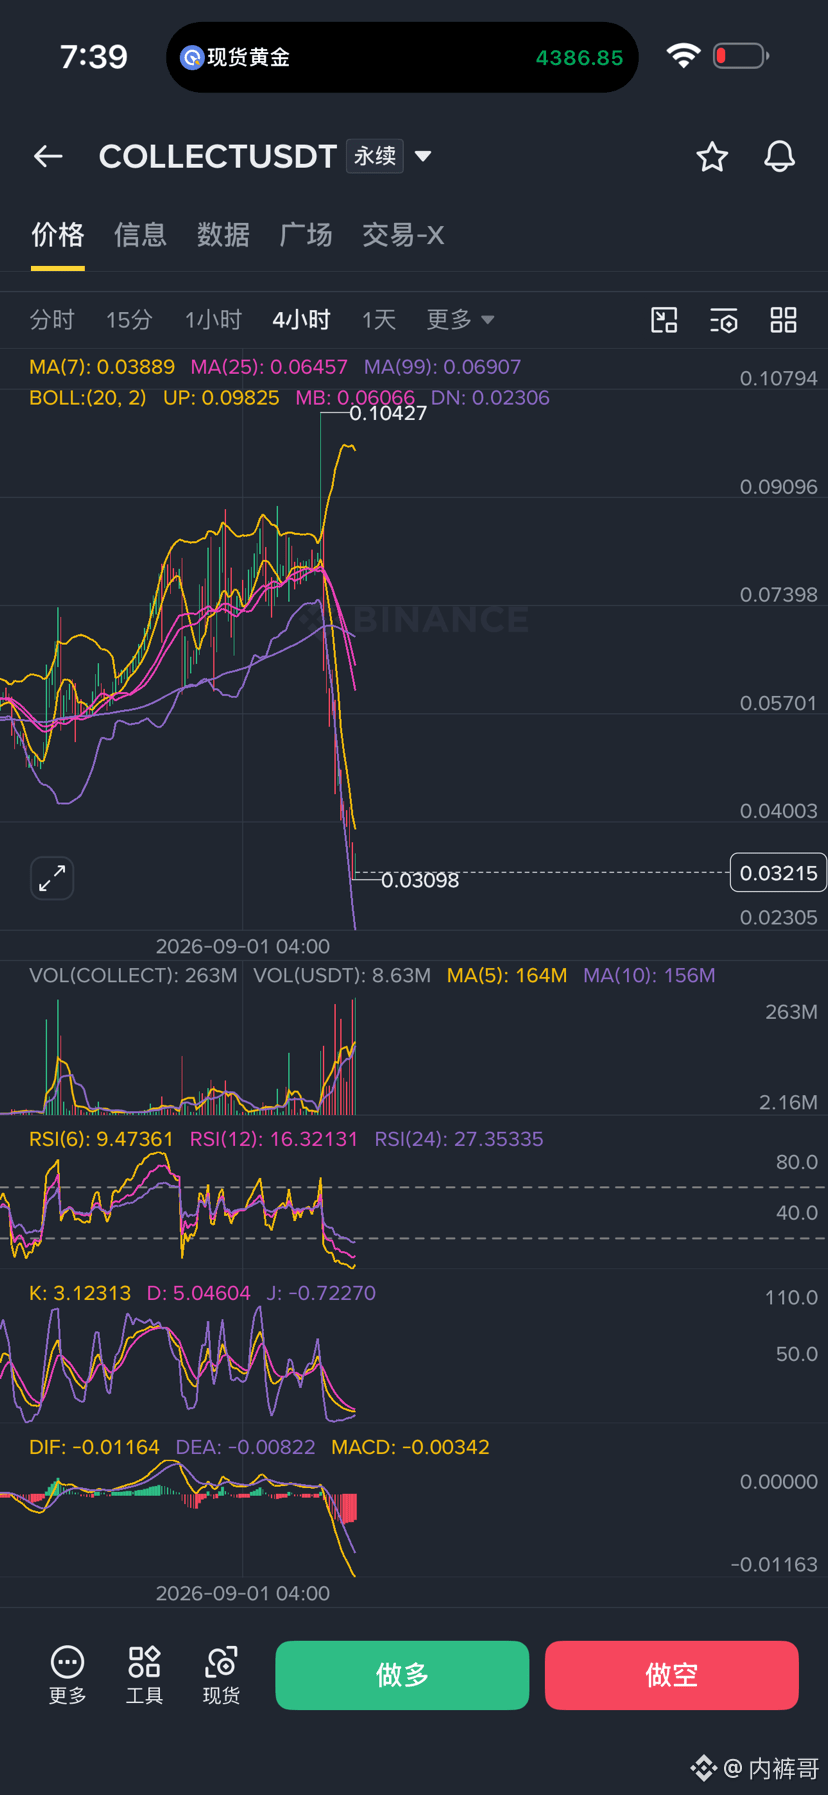
Price was directly smashed from around 0.10 down to 0.032; the 24h drop at one point exceeded 33%, and trading volume surged at the same time.
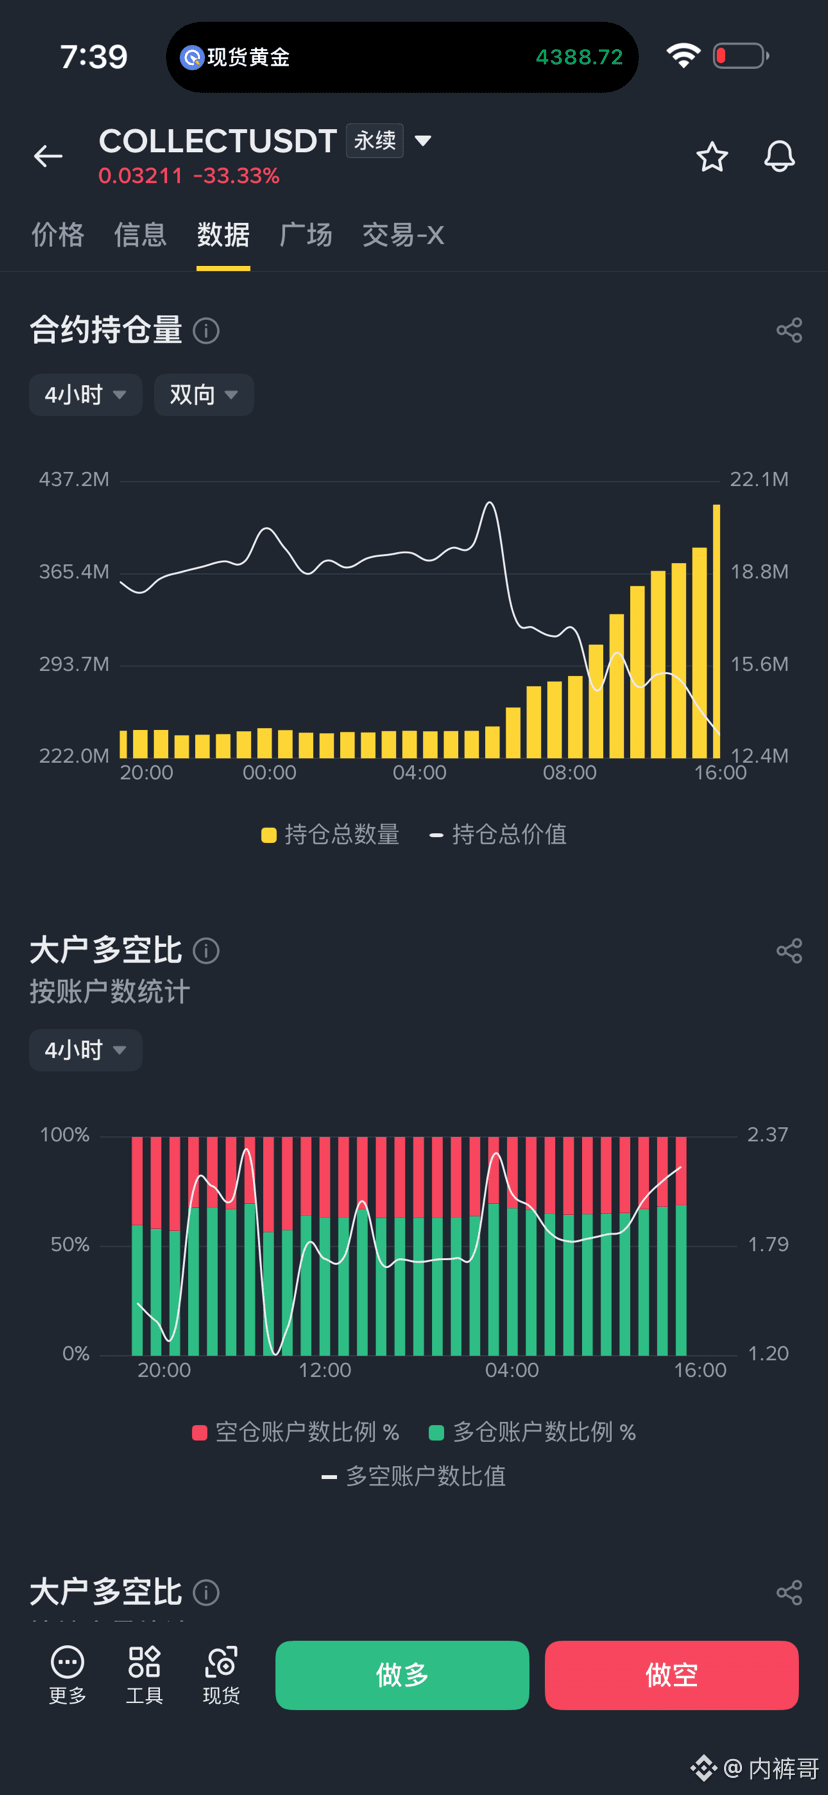
Most importantly: during the crash, the number of open positions actually increased—classic pattern of price falling while positions are added.
High-leverage longs were liquidated, new shorts entered. Liquidation → sell-off → further liquidation—negative feedback loop kicked in immediately.
Even more interesting: the large account long-to-short ratio is actually slightly on the long side, suggesting some funds are starting to catch bids at low levels.
The technicals are also brutal: RSI(6) once plunged into single digits; KDJ and MACD are all in a bearish alignment.
The lower Bollinger Band was directly broken through—on the short term, price has already entered an extreme oversold zone.
So this move looks more like a liquidity crash triggered by futures contract liquidations, not a sudden fundamental collapse.
In the short term, a technical rebound isn’t ruled out. The key is whether it can hold above 0.035–0.040.
If the rebound happens on shrinking volume while OI keeps piling up, be careful—it could be a bull trap, and there may be a second leg of the dip later.
On the other hand, only if volume rises and price reclaims key moving averages, while OI clearly decreases, can we say the liquidation wave has truly ended.
If you already have positions, don’t rush to go all-in and add; if you want to catch the bottom, don’t rush to grab a falling knife—wait for signs of stabilization first.
Brothers, do you think this is the “golden pit” after liquidation, or the waterfall hasn’t finished yet? *Drop your thoughts in the comments👇
#collect $COLLECT
Price was directly smashed from around 0.10 down to 0.032; the 24h drop at one point exceeded 33%, and trading volume surged at the same time.
Most importantly: during the crash, the number of open positions actually increased—classic pattern of price falling while positions are added.
High-leverage longs were liquidated, new shorts entered. Liquidation → sell-off → further liquidation—negative feedback loop kicked in immediately.
Even more interesting: the large account long-to-short ratio is actually slightly on the long side, suggesting some funds are starting to catch bids at low levels.
The technicals are also brutal: RSI(6) once plunged into single digits; KDJ and MACD are all in a bearish alignment.
The lower Bollinger Band was directly broken through—on the short term, price has already entered an extreme oversold zone.
So this move looks more like a liquidity crash triggered by futures contract liquidations, not a sudden fundamental collapse.
In the short term, a technical rebound isn’t ruled out. The key is whether it can hold above 0.035–0.040.
If the rebound happens on shrinking volume while OI keeps piling up, be careful—it could be a bull trap, and there may be a second leg of the dip later.
On the other hand, only if volume rises and price reclaims key moving averages, while OI clearly decreases, can we say the liquidation wave has truly ended.
If you already have positions, don’t rush to go all-in and add; if you want to catch the bottom, don’t rush to grab a falling knife—wait for signs of stabilization first.
Brothers, do you think this is the “golden pit” after liquidation, or the waterfall hasn’t finished yet? *Drop your thoughts in the comments👇
#collect $COLLECT