#ARB🔥🔥🔥
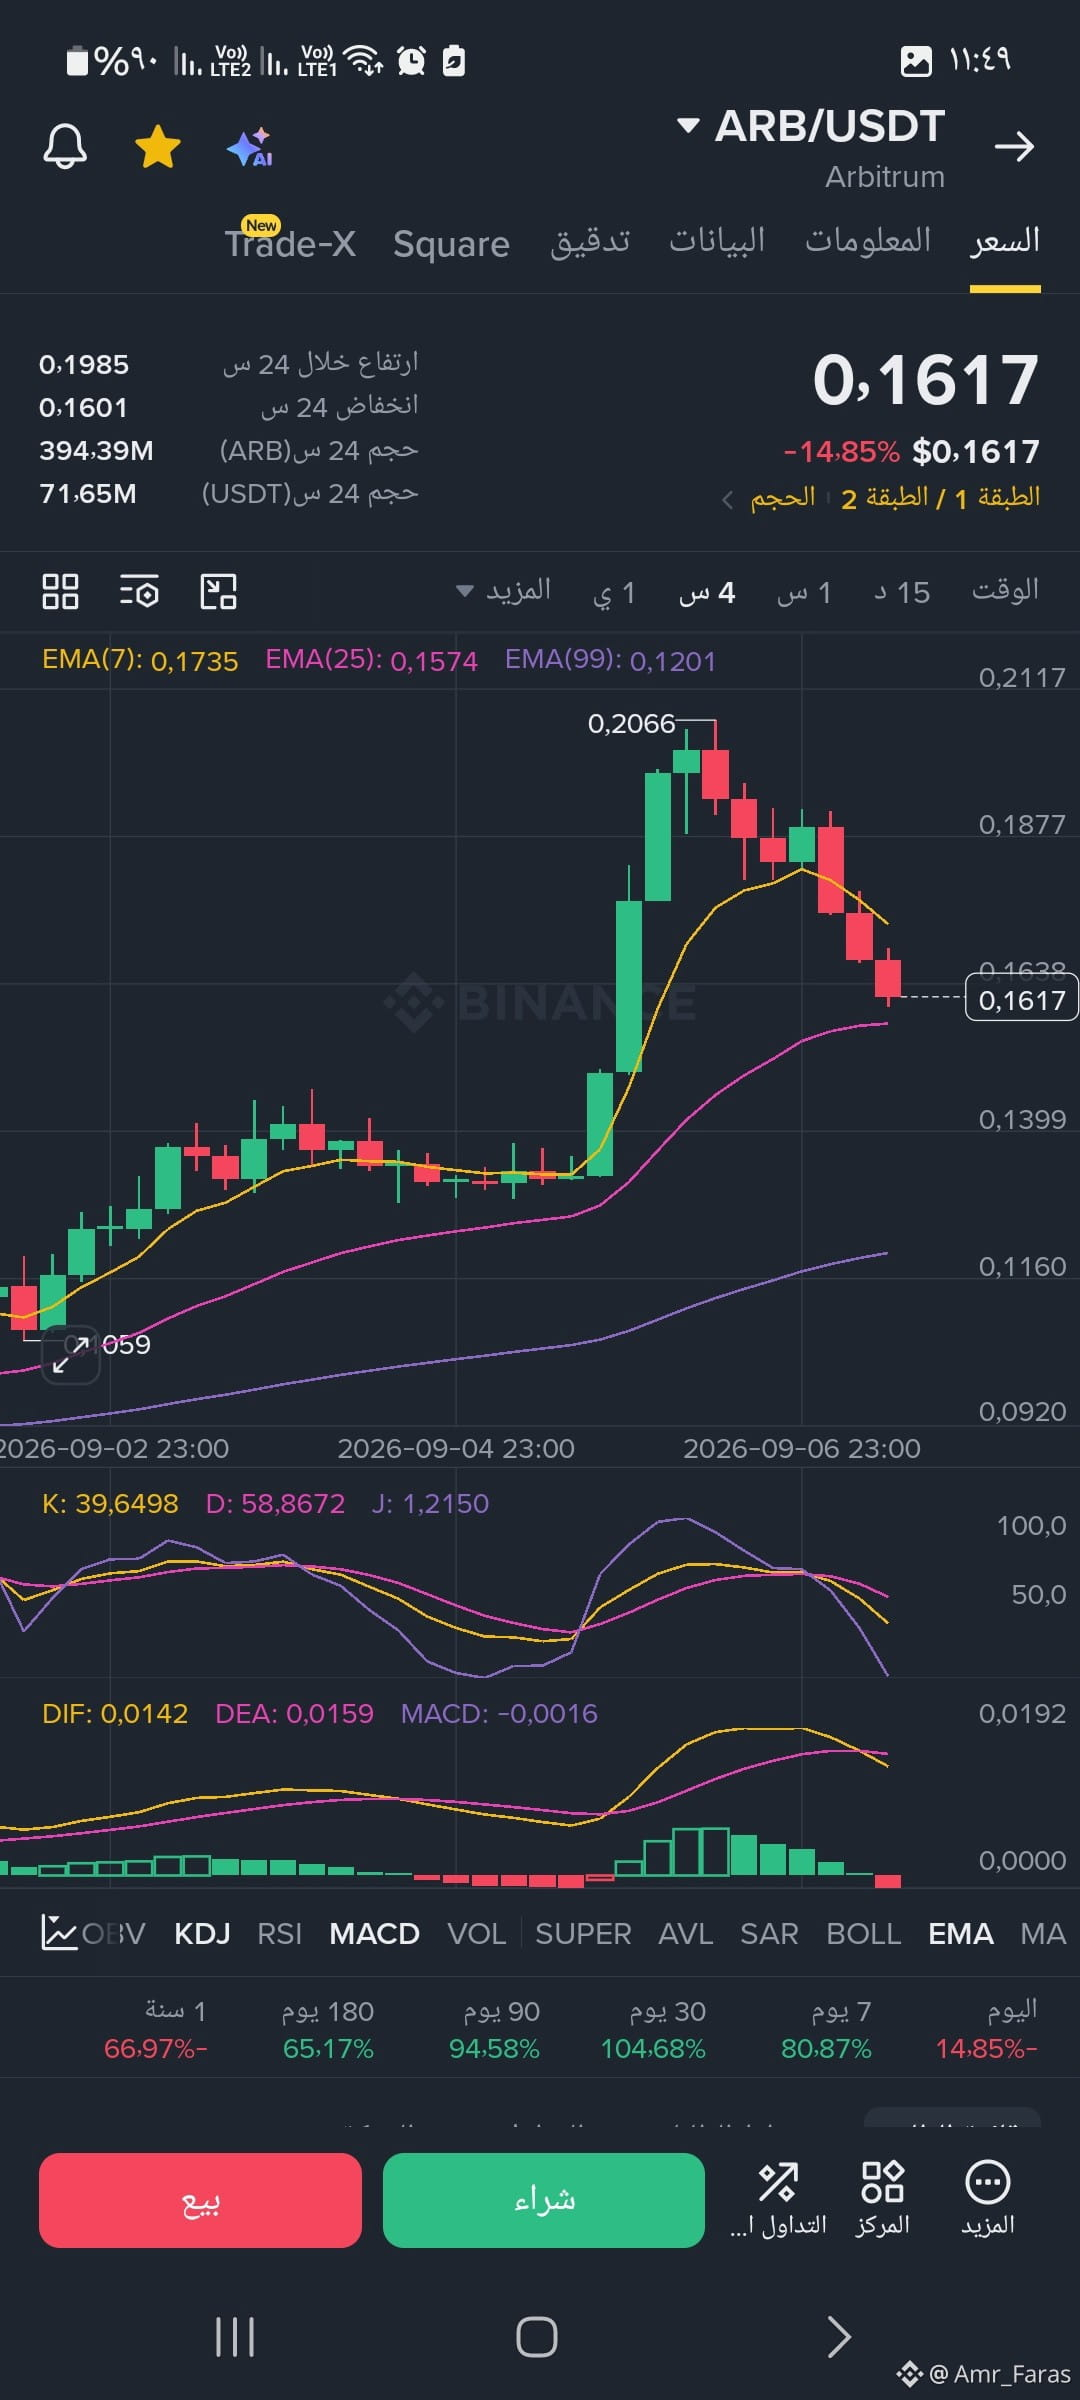
📉 Technical Indicators (Indicators)1. Stochastic Indicator (KDJ)Values: K: 39.64 | D: 58.86 | J: 1.21Analysis: The indicator lines are crossing sharply downward, and the J line is approaching zero (1.21). This reflects strong bearish momentum and suggests that the price is rapidly approaching "oversold" areas.2. MACD IndicatorValues: DIF: 0.0142 | DEA: 0.0159 | MACD: -0.0016Analysis: We observe a negative crossover (Dead Cross) where the blue DIF line has broken below the orange DEA line, and the histogram bars have started turning red below the zero line. This confirms the continuation of selling control in the near term.
💡 Expected Scenarios and Action Plan
⚠️ Scenario 1 (Rebound): Monitor price behavior as it approaches the 0.1570 - 0.1550 levels. If reversal candlesticks (long lower wicks) appear along with improvement in the KDJ indicator, there may be an opportunity to speculate on a temporary bullish rebound.
⚠️ Scenario 2 (Continued Decline): If the price decisively breaks below 0.1550, the next expected stop will be a test of lower accumulation levels near 0.1400.
📉 Technical Indicators (Indicators)1. Stochastic Indicator (KDJ)Values: K: 39.64 | D: 58.86 | J: 1.21Analysis: The indicator lines are crossing sharply downward, and the J line is approaching zero (1.21). This reflects strong bearish momentum and suggests that the price is rapidly approaching "oversold" areas.2. MACD IndicatorValues: DIF: 0.0142 | DEA: 0.0159 | MACD: -0.0016Analysis: We observe a negative crossover (Dead Cross) where the blue DIF line has broken below the orange DEA line, and the histogram bars have started turning red below the zero line. This confirms the continuation of selling control in the near term.
💡 Expected Scenarios and Action Plan
⚠️ Scenario 1 (Rebound): Monitor price behavior as it approaches the 0.1570 - 0.1550 levels. If reversal candlesticks (long lower wicks) appear along with improvement in the KDJ indicator, there may be an opportunity to speculate on a temporary bullish rebound.
⚠️ Scenario 2 (Continued Decline): If the price decisively breaks below 0.1550, the next expected stop will be a test of lower accumulation levels near 0.1400.