
⚠️ BTC Structure Still Leans Bearish Under $83K
$BTC USDT — 1D | Current: $79,535
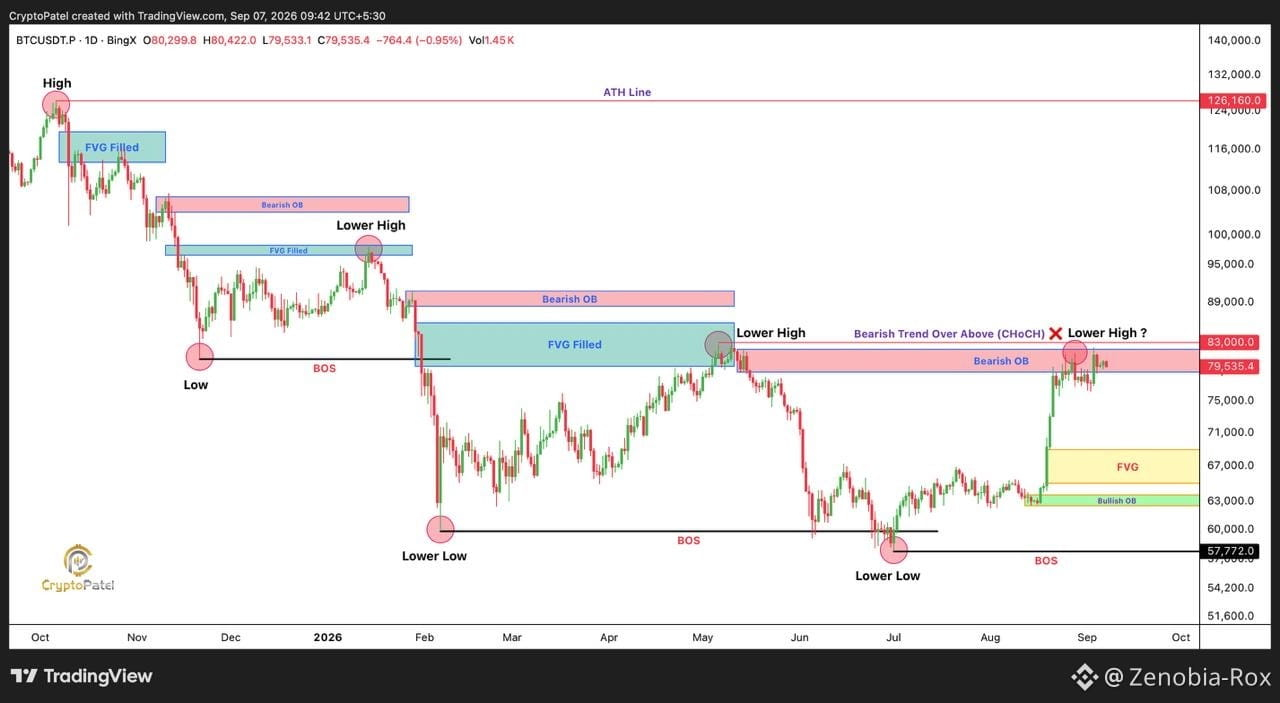
The chart shows Bitcoin trading directly inside a visible bearish order block around the $79K–$82K area, after a strong recovery from the ~$57,772 low. Price has also formed a lower high near $83K, so the broader structure has not yet confirmed a bullish reversal.
Market sentiment: Bearish ⚠️
Confidence: 75% — based strictly on the structure visible on this chart.
🔎 Technical Breakdown$BTC
The key level is $83,000. BTC previously rejected around this lower-high area, and the chart explicitly marks the structure as a bearish trend unless price can reclaim it convincingly.
Current price around $79.5K is sitting inside the bearish OB, making this an important reaction zone.
If sellers regain control, the visible downside areas are:
🎯 TP1: $75,000
🎯 TP2: $71,000
🎯 TP3: $67,000–$68,000 FVG
The chart also shows a bullish OB around $63K, which could become a deeper support area if the selloff extends.
📌 Potential Short Setup
Entry zone: ~$79,000–$82,000
Stop loss: ~$83,500
Invalidation: Daily acceptance above the ~$83K lower-high structure.
Using an illustrative entry near $80K and SL around $83.5K, the approximate R:R is:
TP1 → 1:1.4
TP2 → 1:2.6
TP3 → 1:3.4
I would not chase the short blindly. A rejection from the bearish OB or clear bearish confirmation would make the setup stronger.
If BTC breaks and holds above $83K, this bearish thesis needs to be reconsidered.
Would you trade the rejection here, or wait for BTC to reclaim $83K first?$BTC
#TradingTales #PriceAction #TechnicalAnalysis #BİNANCE #cryptotrading
$BTC USDT — 1D | Current: $79,535
The chart shows Bitcoin trading directly inside a visible bearish order block around the $79K–$82K area, after a strong recovery from the ~$57,772 low. Price has also formed a lower high near $83K, so the broader structure has not yet confirmed a bullish reversal.
Market sentiment: Bearish ⚠️
Confidence: 75% — based strictly on the structure visible on this chart.
🔎 Technical Breakdown$BTC
The key level is $83,000. BTC previously rejected around this lower-high area, and the chart explicitly marks the structure as a bearish trend unless price can reclaim it convincingly.
Current price around $79.5K is sitting inside the bearish OB, making this an important reaction zone.
If sellers regain control, the visible downside areas are:
🎯 TP1: $75,000
🎯 TP2: $71,000
🎯 TP3: $67,000–$68,000 FVG
The chart also shows a bullish OB around $63K, which could become a deeper support area if the selloff extends.
📌 Potential Short Setup
Entry zone: ~$79,000–$82,000
Stop loss: ~$83,500
Invalidation: Daily acceptance above the ~$83K lower-high structure.
Using an illustrative entry near $80K and SL around $83.5K, the approximate R:R is:
TP1 → 1:1.4
TP2 → 1:2.6
TP3 → 1:3.4
I would not chase the short blindly. A rejection from the bearish OB or clear bearish confirmation would make the setup stronger.
If BTC breaks and holds above $83K, this bearish thesis needs to be reconsidered.
Would you trade the rejection here, or wait for BTC to reclaim $83K first?$BTC
#TradingTales #PriceAction #TechnicalAnalysis #BİNANCE #cryptotrading