After BTC surged to around 82,400 on September 21, it began to pull back. The price action on the second trading day is quite similar to January 15, and the weekend market has also been getting weaker.
So now we can use ETF data to do a “citing-the-boat-to-find-the-sword” style comparison.
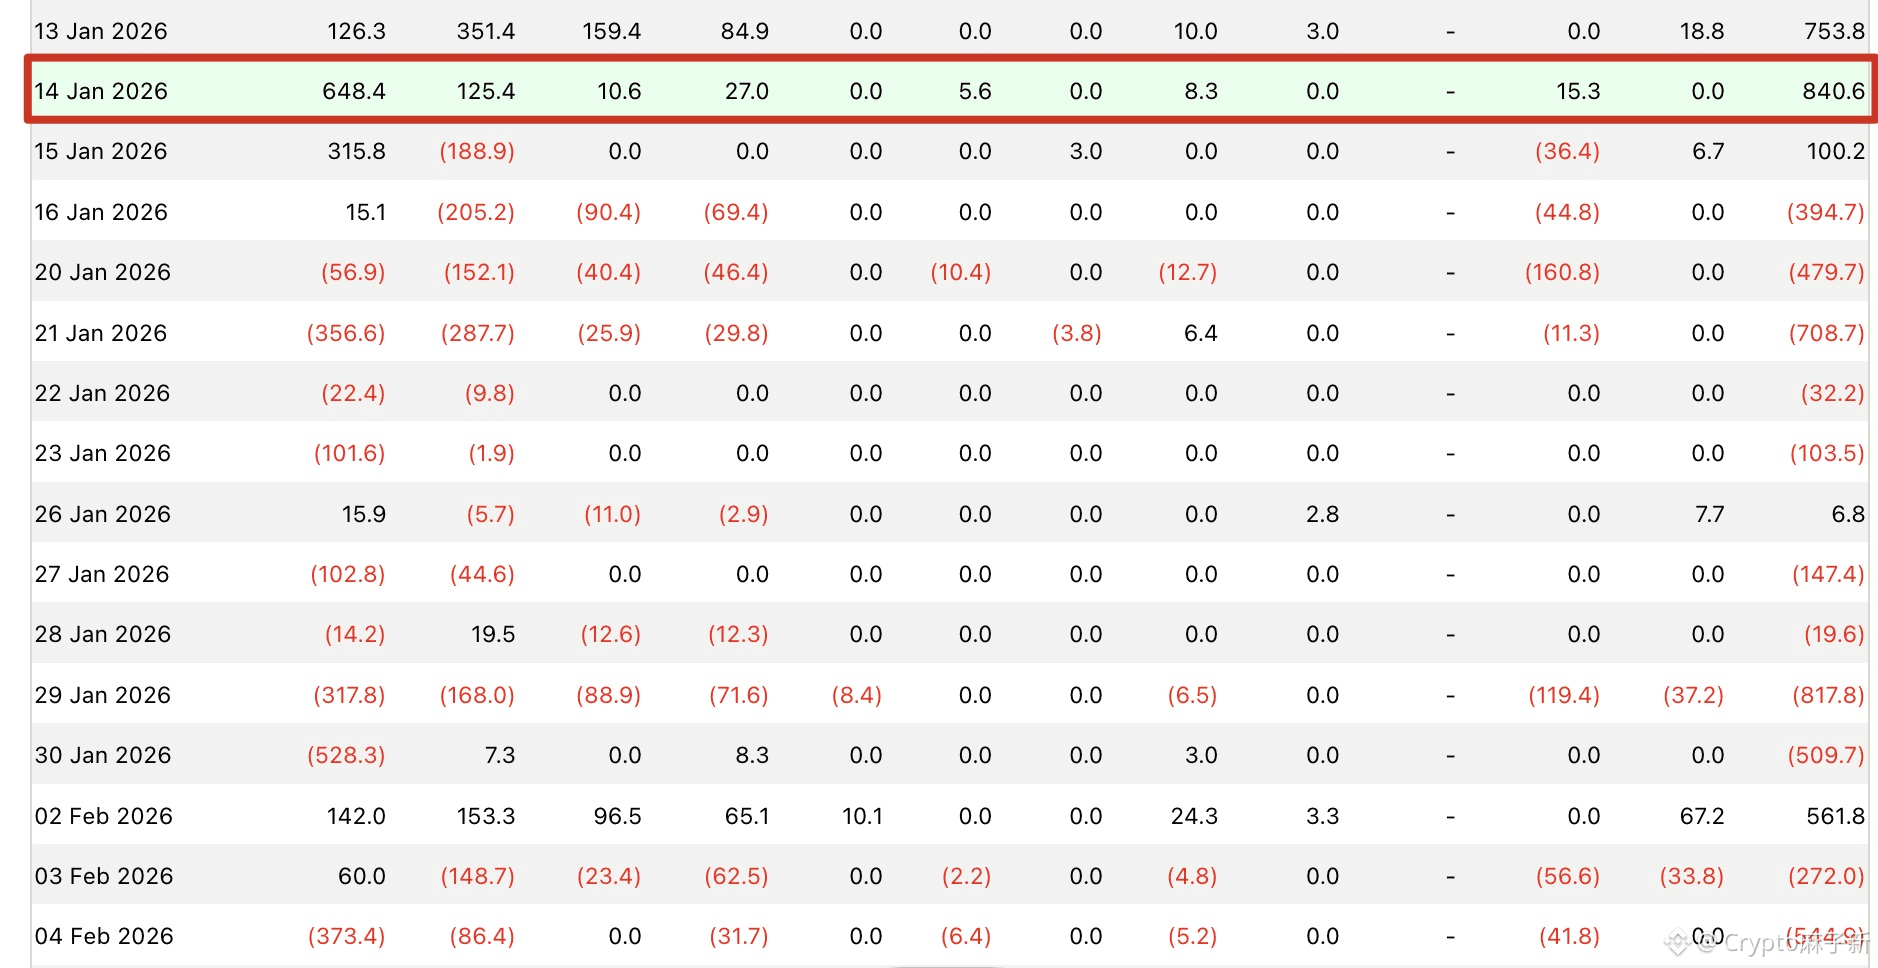
On January 14, BTC ETF net inflows reached $840.6 million, the highest single-day inflow in the first half of the year, but on the 15th it dropped sharply to $100.2 million, on the 16th it turned into net outflows, and then continued to see outflows, with BTC also weakening all the way.
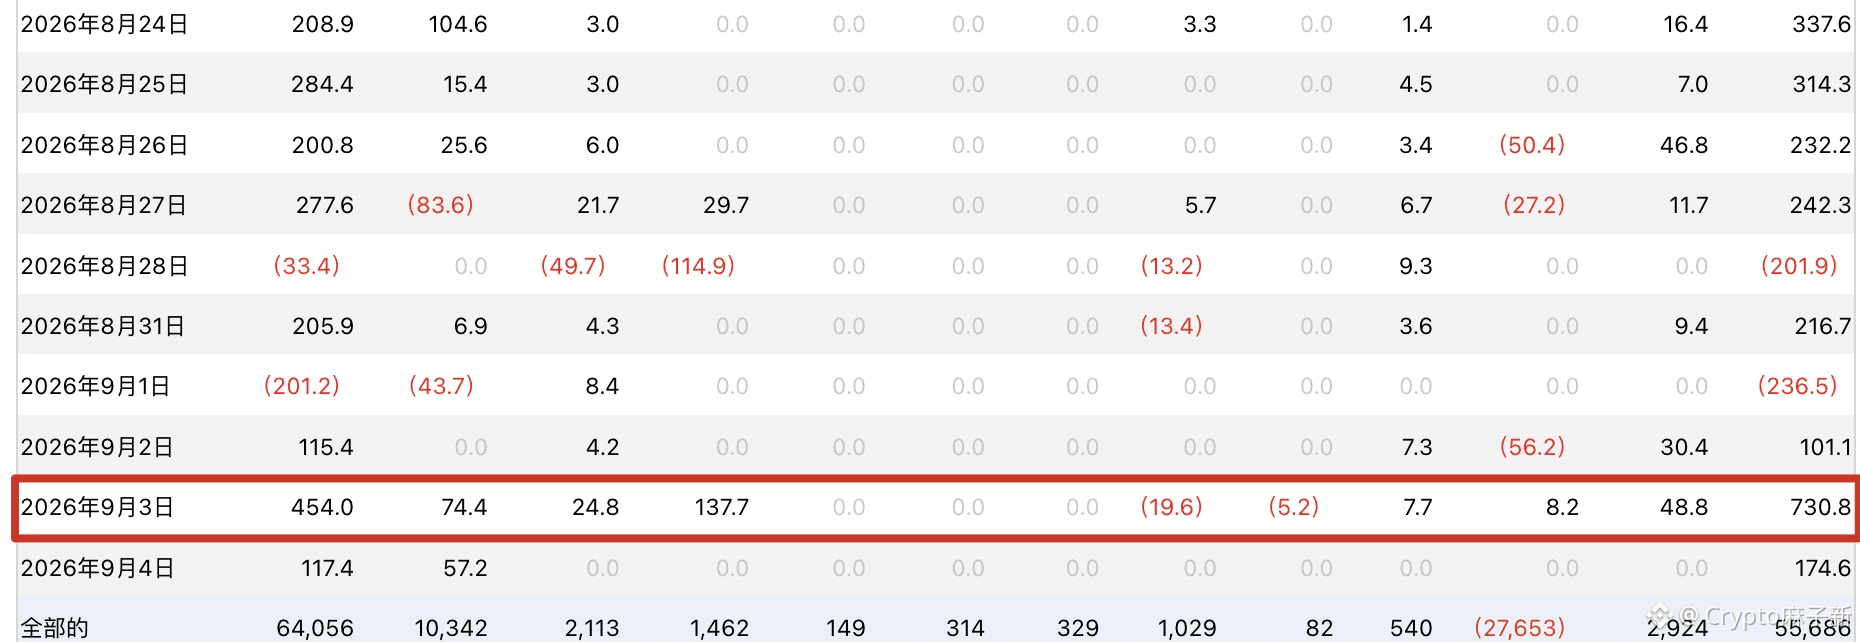
This time is somewhat similar. On September 3, ETF net inflows reached $730.8 million, the highest in the second half of the year and the second highest since January 14, but on September 4 it quickly fell to $174.6 million.
So the ETF data for next Monday and Tuesday will be crucial.
If net inflows keep declining, or even turn into net outflows, it means ETF demand, the main source of buying, is starting to weaken. Then the “citing-the-boat” comparison may hold, and we can refer to the price action after January 14.
Conversely, if inflows return to $300 million to $500 million or even higher, prices will still have support in the short term, and the probability of entering a correction will drop. Simply put, $300 million to $500 million counts as strong inflow; below $300 million is normal inflow; and if even $174.6 million cannot be sustained, then we need to be wary of further weakening in capital flows.
So whether this comparison can work this time depends not only on the candlestick chart; ETF data must also cooperate.
If the comparison fails and ETFs continue to see strong inflows, BTC still has a chance to push toward 82,600 again, or even test 84,200.
But if the comparison succeeds and a correction follows, I think the first stage may still be 15 to 20 days of choppy pullback, after which an accelerated decline cannot be ruled out.
That is the scenario I least want to see.
Because if the January pattern is repeated, the 58,000 to 60,000 support zone may be broken. Once this level gives way, it will not just look bad on price; market confidence in the next trend launch will also be affected.
So for now, don’t rush to guess the top. First watch how ETFs move on Monday and Tuesday. If capital keeps flowing in, the comparison may fail; if capital clearly weakens, then we need to guard against a repeat of January’s script.
So now we can use ETF data to do a “citing-the-boat-to-find-the-sword” style comparison.
On January 14, BTC ETF net inflows reached $840.6 million, the highest single-day inflow in the first half of the year, but on the 15th it dropped sharply to $100.2 million, on the 16th it turned into net outflows, and then continued to see outflows, with BTC also weakening all the way.
This time is somewhat similar. On September 3, ETF net inflows reached $730.8 million, the highest in the second half of the year and the second highest since January 14, but on September 4 it quickly fell to $174.6 million.
So the ETF data for next Monday and Tuesday will be crucial.
If net inflows keep declining, or even turn into net outflows, it means ETF demand, the main source of buying, is starting to weaken. Then the “citing-the-boat” comparison may hold, and we can refer to the price action after January 14.
Conversely, if inflows return to $300 million to $500 million or even higher, prices will still have support in the short term, and the probability of entering a correction will drop. Simply put, $300 million to $500 million counts as strong inflow; below $300 million is normal inflow; and if even $174.6 million cannot be sustained, then we need to be wary of further weakening in capital flows.
So whether this comparison can work this time depends not only on the candlestick chart; ETF data must also cooperate.
If the comparison fails and ETFs continue to see strong inflows, BTC still has a chance to push toward 82,600 again, or even test 84,200.
But if the comparison succeeds and a correction follows, I think the first stage may still be 15 to 20 days of choppy pullback, after which an accelerated decline cannot be ruled out.
That is the scenario I least want to see.
Because if the January pattern is repeated, the 58,000 to 60,000 support zone may be broken. Once this level gives way, it will not just look bad on price; market confidence in the next trend launch will also be affected.
So for now, don’t rush to guess the top. First watch how ETFs move on Monday and Tuesday. If capital keeps flowing in, the comparison may fail; if capital clearly weakens, then we need to guard against a repeat of January’s script.