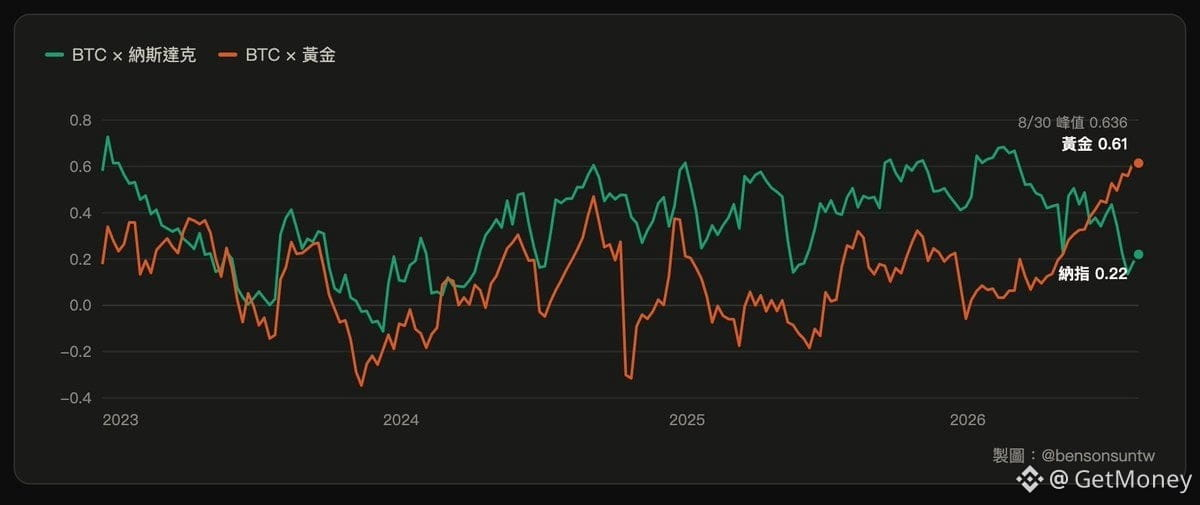
📰 This time, BTC’s move really isn’t quite like the past few years. In the week of August 22, BTC rose 24%, gold rose 5.6% over the same period, while Nasdaq actually fell 2.1%. In other words, BTC did not move together with U.S. stocks; instead, it stood on the same side as gold.
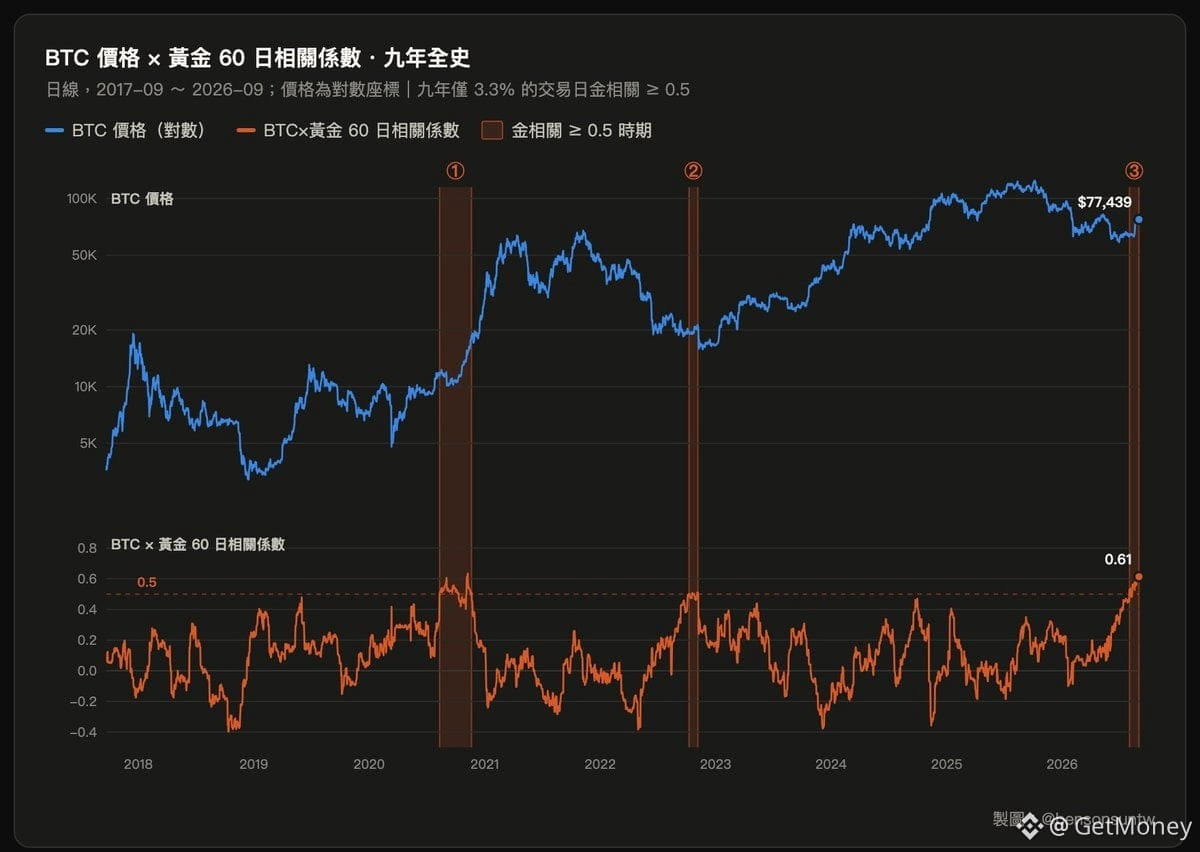
🔥 Since May, the 60-day correlation coefficient between BTC and gold has been close to 0.64, the same as November 2020, while the long-term median is only 0.12. At the same time, the correlation coefficient between BTC and Nasdaq once dropped to 0.13, and later returned to 0.22.
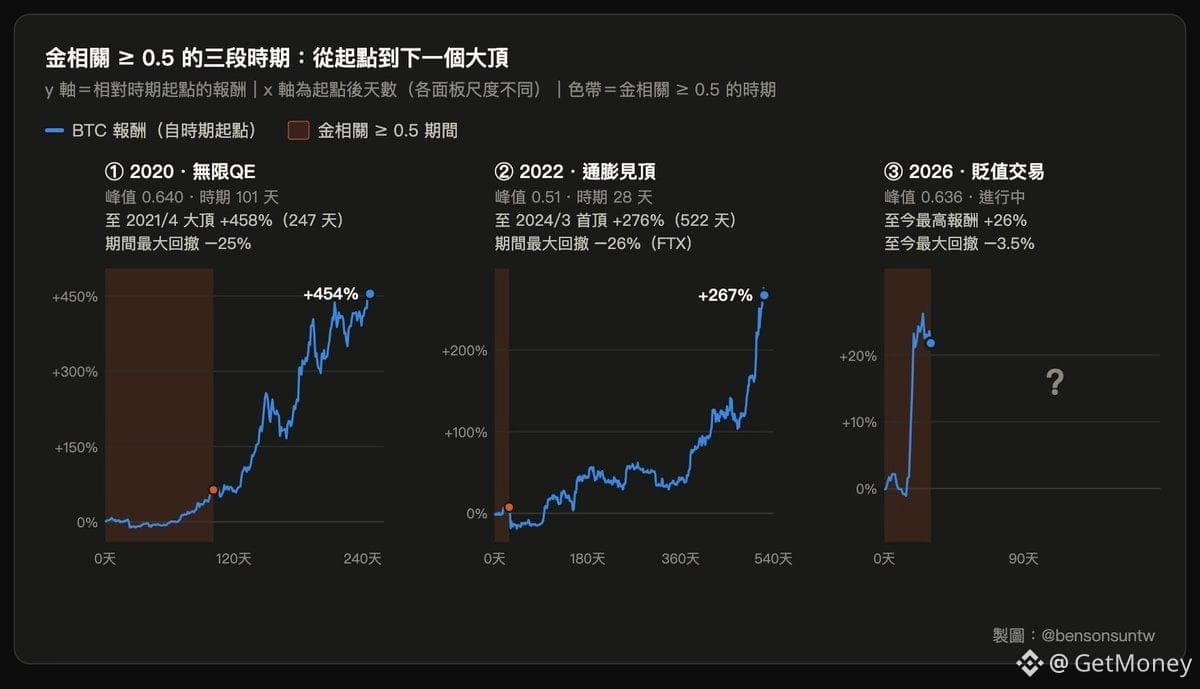
This kind of combination is very rare in history, with only 2.2% of trading days meeting the conditions. Similar phases appeared in August 2020 and October 2022, after which both saw significant gains. Of course, history does not simply repeat itself, and correlation alone cannot be directly used as a buy signal.
💡 Another data point is the Karma Index. It combines nine indicators including liquidity, funding rates, on-chain costs, app rankings, and search interest. A reading below 20 indicates extreme fear. The 60-day average before this rally was only 19.5, showing that the market had indeed been suppressed for quite a long time.
🤔 But the article also mentions that in the past, chasing after a single-week gain of more than 20% led to a median six-month return of only 3.6%. Samples that rose again after a low-sentiment shakeout performed better, though this is still historical statistics and not a guarantee of results. Would you see this as the start of a bull market, or wait for the next pullback confirmation first?
#BTC #比特币 #链上数据 #加密市场
🔥 Since May, the 60-day correlation coefficient between BTC and gold has been close to 0.64, the same as November 2020, while the long-term median is only 0.12. At the same time, the correlation coefficient between BTC and Nasdaq once dropped to 0.13, and later returned to 0.22.
This kind of combination is very rare in history, with only 2.2% of trading days meeting the conditions. Similar phases appeared in August 2020 and October 2022, after which both saw significant gains. Of course, history does not simply repeat itself, and correlation alone cannot be directly used as a buy signal.
💡 Another data point is the Karma Index. It combines nine indicators including liquidity, funding rates, on-chain costs, app rankings, and search interest. A reading below 20 indicates extreme fear. The 60-day average before this rally was only 19.5, showing that the market had indeed been suppressed for quite a long time.
🤔 But the article also mentions that in the past, chasing after a single-week gain of more than 20% led to a median six-month return of only 3.6%. Samples that rose again after a low-sentiment shakeout performed better, though this is still historical statistics and not a guarantee of results. Would you see this as the start of a bull market, or wait for the next pullback confirmation first?
#BTC #比特币 #链上数据 #加密市场