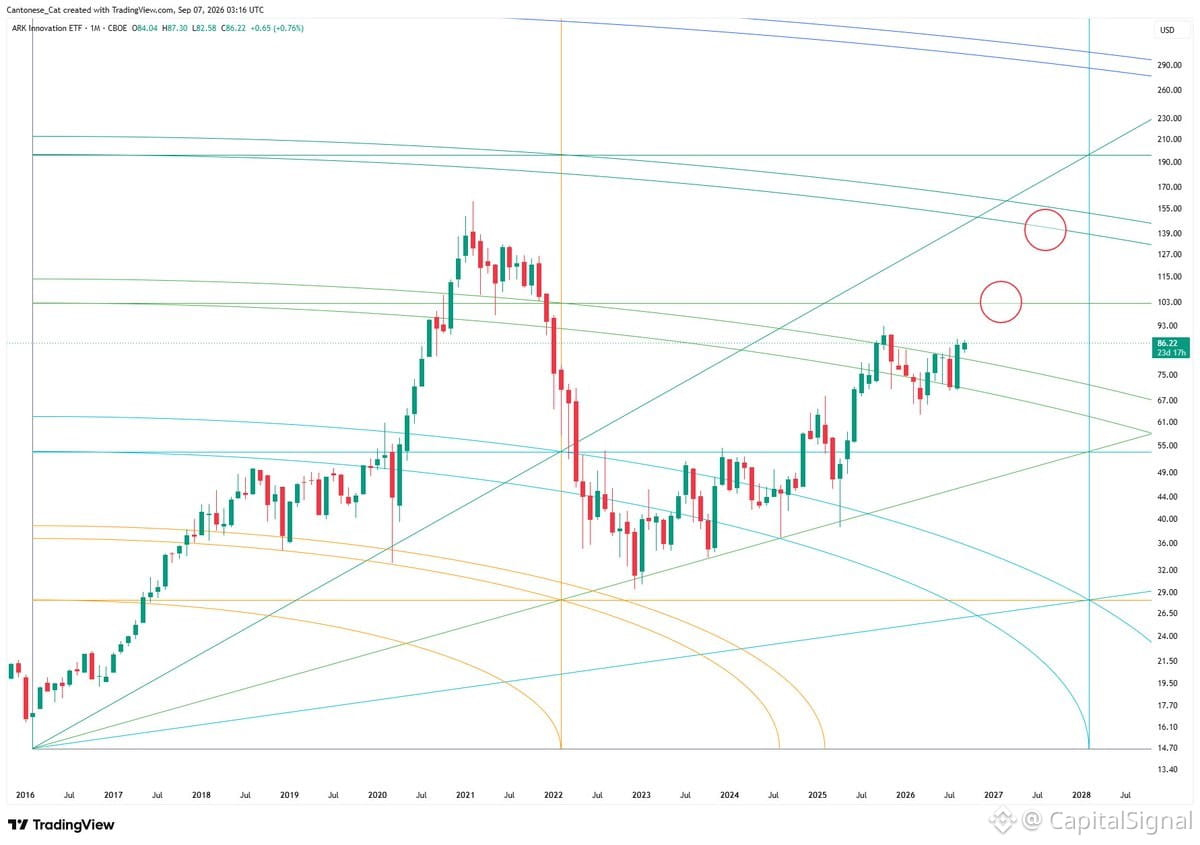
$ARKK monthly chart showing Gann square 360/1 analysis. Technical setup suggests key inflection point approaching. Watching for price action around these geometric levels — Gann squares often mark major support/resistance zones where institutional flows shift. If you're trading $ARKK or any of its top holdings (Tesla, Coinbase, Roku, etc.), this could signal a meaningful rotation or breakout setup. Keep an eye on volume confirmation and whether innovation names can hold these technical anchors amid macro volatility.

Post
Disclaimer: Includes third-party opinions. No advice. Binance AI may be used without guarantee. See T&Cs.