$FLOCK 🚀 $FLOCK surged strongly by 20%! Where will it go next?
🔥 FLOCKUSDT 4-hour chart in-depth technical analysis
1️⃣ Price action and key levels
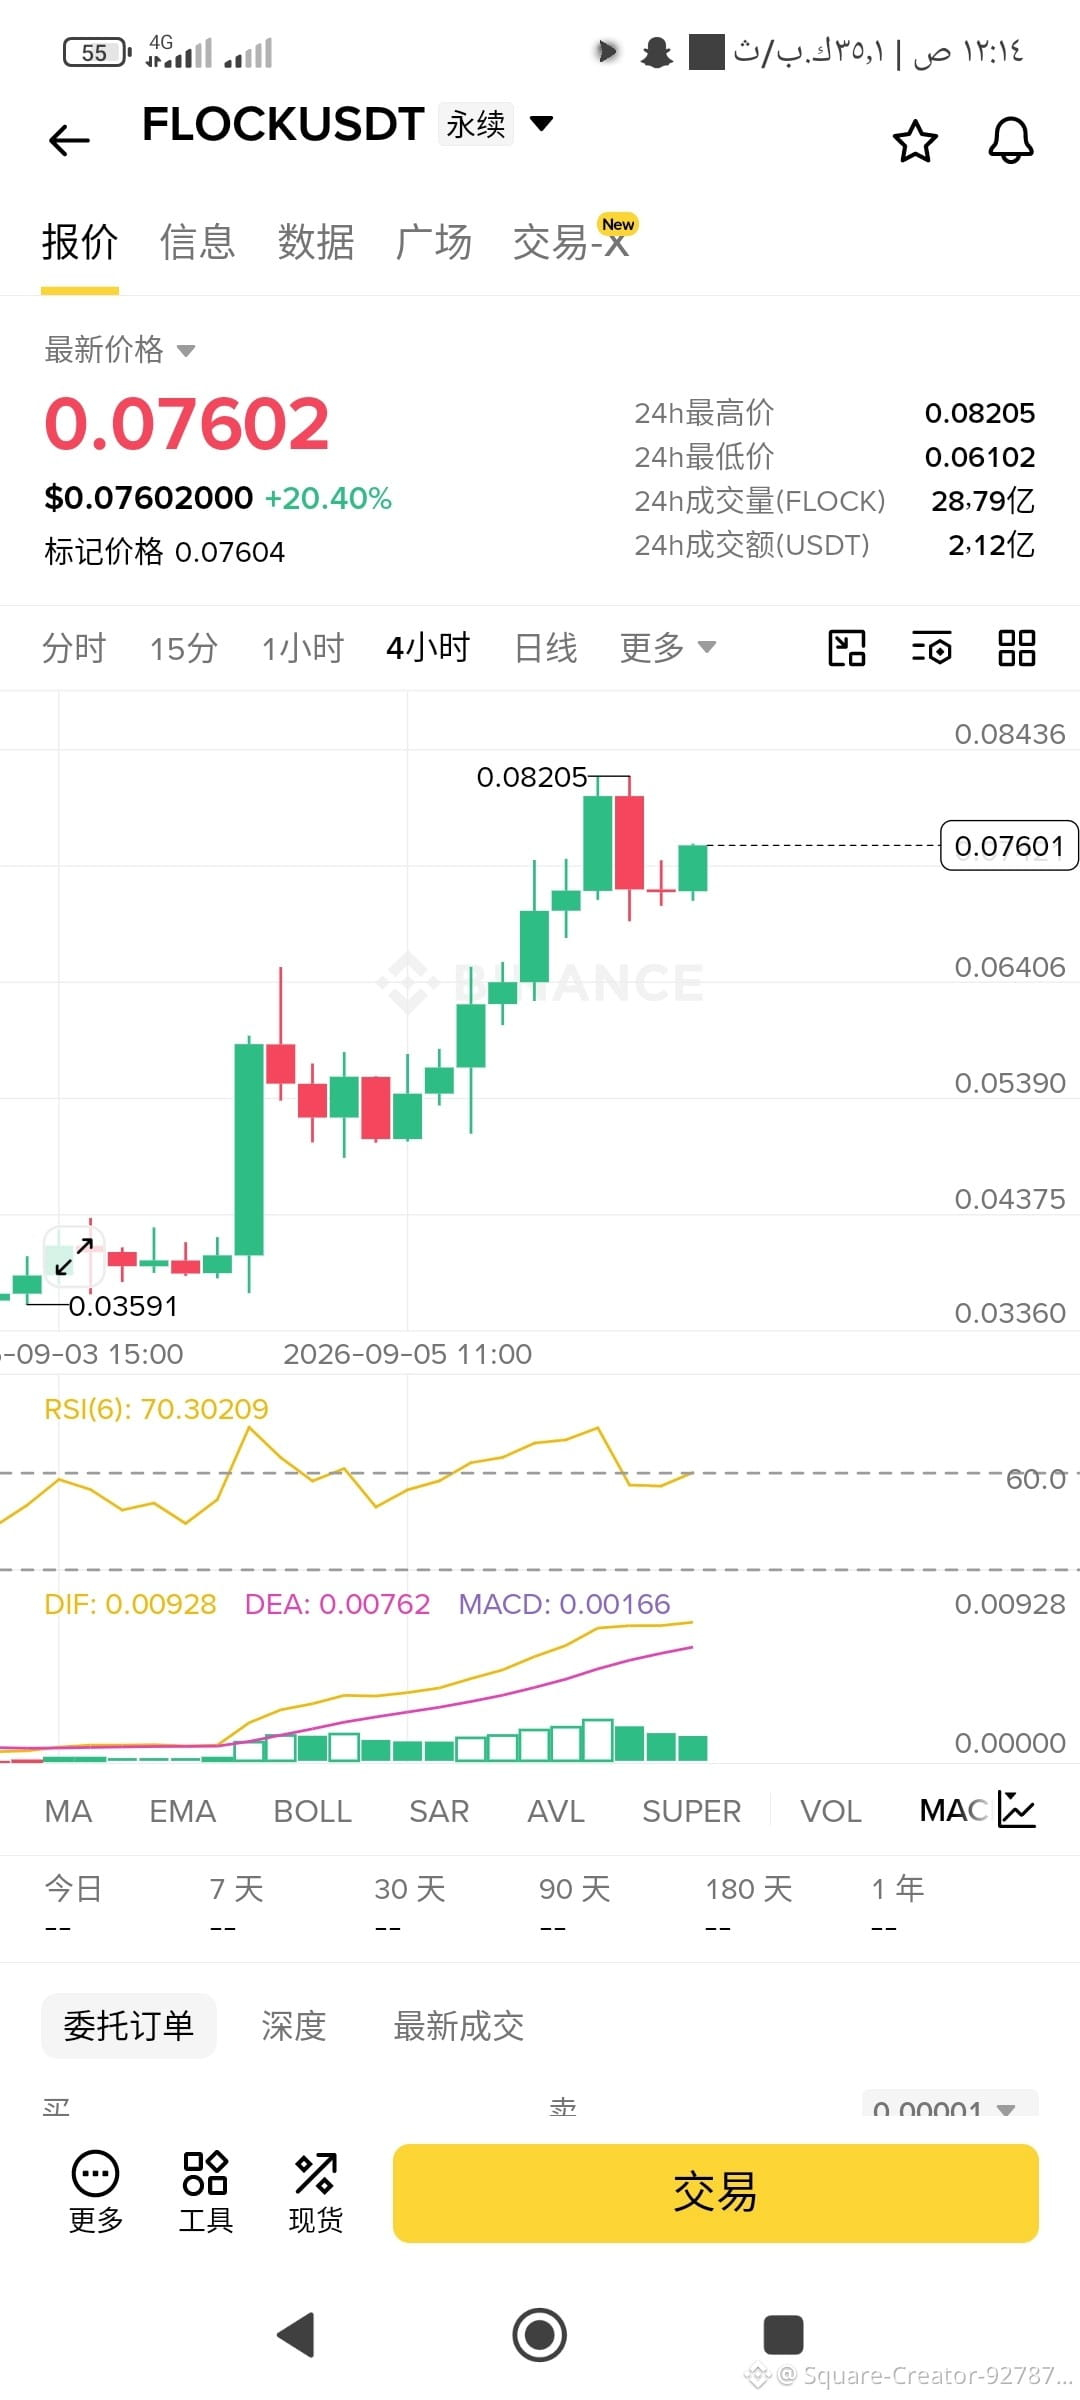
Latest price: 0.07602 (24-hour increase +20.40%)
Recent high (resistance): 0.08205
Pullback support: 0.06406 / 0.05390
After bottoming out at 0.03591, the price saw an explosive rally and is now encountering resistance near 0.08205, entering a brief high-level consolidation.
2️⃣ Indicator signals
RSI (6): Currently at 70.30, in the overbought zone, suggesting a short-term need for consolidation pullback or absorption of profit-taking.
MACD: DIF (0.00928) remains above DEA (0.00762), with bullish histogram bars continuing to print, indicating that short- to medium-term bullish momentum still dominates.
💡 Trading strategy suggestion
Bullish focus: If it can effectively break through and hold above 0.08205, it may start a new upward wave; if a pullback occurs, watch for support confirmation around 0.06400 before considering entry.
Risk warning: The RSI is at a high level, so chasing the price higher should be done with caution. It is recommended to set stop-losses strictly!
👇 What do you think?
Do you think $FLOCK
#俄乌同时宣布停火3天 #Flock will directly break through 0.08205 and hit a new high, or will it pull back first to build momentum? Welcome to share your thoughts in the comments!
#Cryptocurrency #TechnicalAnalysis #BinanceSquare #Trading Signals
🔥 FLOCKUSDT 4-hour chart in-depth technical analysis
1️⃣ Price action and key levels
Latest price: 0.07602 (24-hour increase +20.40%)
Recent high (resistance): 0.08205
Pullback support: 0.06406 / 0.05390
After bottoming out at 0.03591, the price saw an explosive rally and is now encountering resistance near 0.08205, entering a brief high-level consolidation.
2️⃣ Indicator signals
RSI (6): Currently at 70.30, in the overbought zone, suggesting a short-term need for consolidation pullback or absorption of profit-taking.
MACD: DIF (0.00928) remains above DEA (0.00762), with bullish histogram bars continuing to print, indicating that short- to medium-term bullish momentum still dominates.
💡 Trading strategy suggestion
Bullish focus: If it can effectively break through and hold above 0.08205, it may start a new upward wave; if a pullback occurs, watch for support confirmation around 0.06400 before considering entry.
Risk warning: The RSI is at a high level, so chasing the price higher should be done with caution. It is recommended to set stop-losses strictly!
👇 What do you think?
Do you think $FLOCK
#俄乌同时宣布停火3天 #Flock will directly break through 0.08205 and hit a new high, or will it pull back first to build momentum? Welcome to share your thoughts in the comments!
#Cryptocurrency #TechnicalAnalysis #BinanceSquare #Trading Signals