Bitcoin is standing on a powder keg, and the question is not where the price is, but where the liquidity that could explode is
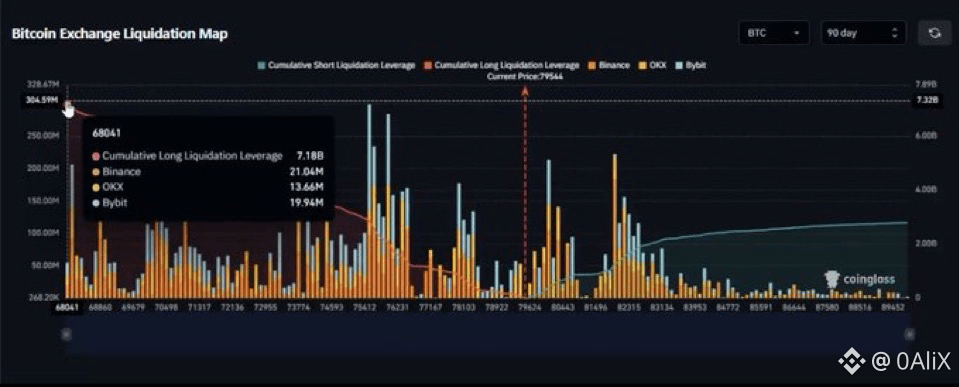
The 90-day liquidation map shows that the current area around $79.5K sits between large clusters of leveraged positions
🔴 Below the price, accumulated Long liquidations appear, and as it moves down toward the $75K–$77K zones, the visible liquidity density on the map increases
🟢 Above the price, there is a clear cluster of Short liquidations, especially as it approaches the $80K–$82K area, followed by additional liquidity at higher levels
In short, any strong move from the current area could start by pulling liquidity from one side, and if the move continues, it may accelerate due to the successive liquidation of leveraged positions
But the liquidation map does not predict direction on its own; it only shows where potential liquidation levels are concentrated, not where the price will necessarily go
⚠️ Educational analysis only, not financial advice to buy or sell
$BTC $BNB
#btc #crypto
The 90-day liquidation map shows that the current area around $79.5K sits between large clusters of leveraged positions
🔴 Below the price, accumulated Long liquidations appear, and as it moves down toward the $75K–$77K zones, the visible liquidity density on the map increases
🟢 Above the price, there is a clear cluster of Short liquidations, especially as it approaches the $80K–$82K area, followed by additional liquidity at higher levels
In short, any strong move from the current area could start by pulling liquidity from one side, and if the move continues, it may accelerate due to the successive liquidation of leveraged positions
But the liquidation map does not predict direction on its own; it only shows where potential liquidation levels are concentrated, not where the price will necessarily go
⚠️ Educational analysis only, not financial advice to buy or sell
$BTC $BNB
#btc #crypto