Trying to guess where the bottom of a drop is is the favorite sport of beginners, and the one that burns the most accounts. When the chart shows weakness as clear as that of $AKE , professionals do not look for miracle bounces; we ride with gravity.
$AKE - 🔴 SHORT - Conf 83%
Trading Plan:
Entry: 0.01388000 – 0.01395150
SL: 0.01439828
TP1: 0.01373624
TP2: 0.01308944
TP3: 0.01250254
The technical logic behind the trade:
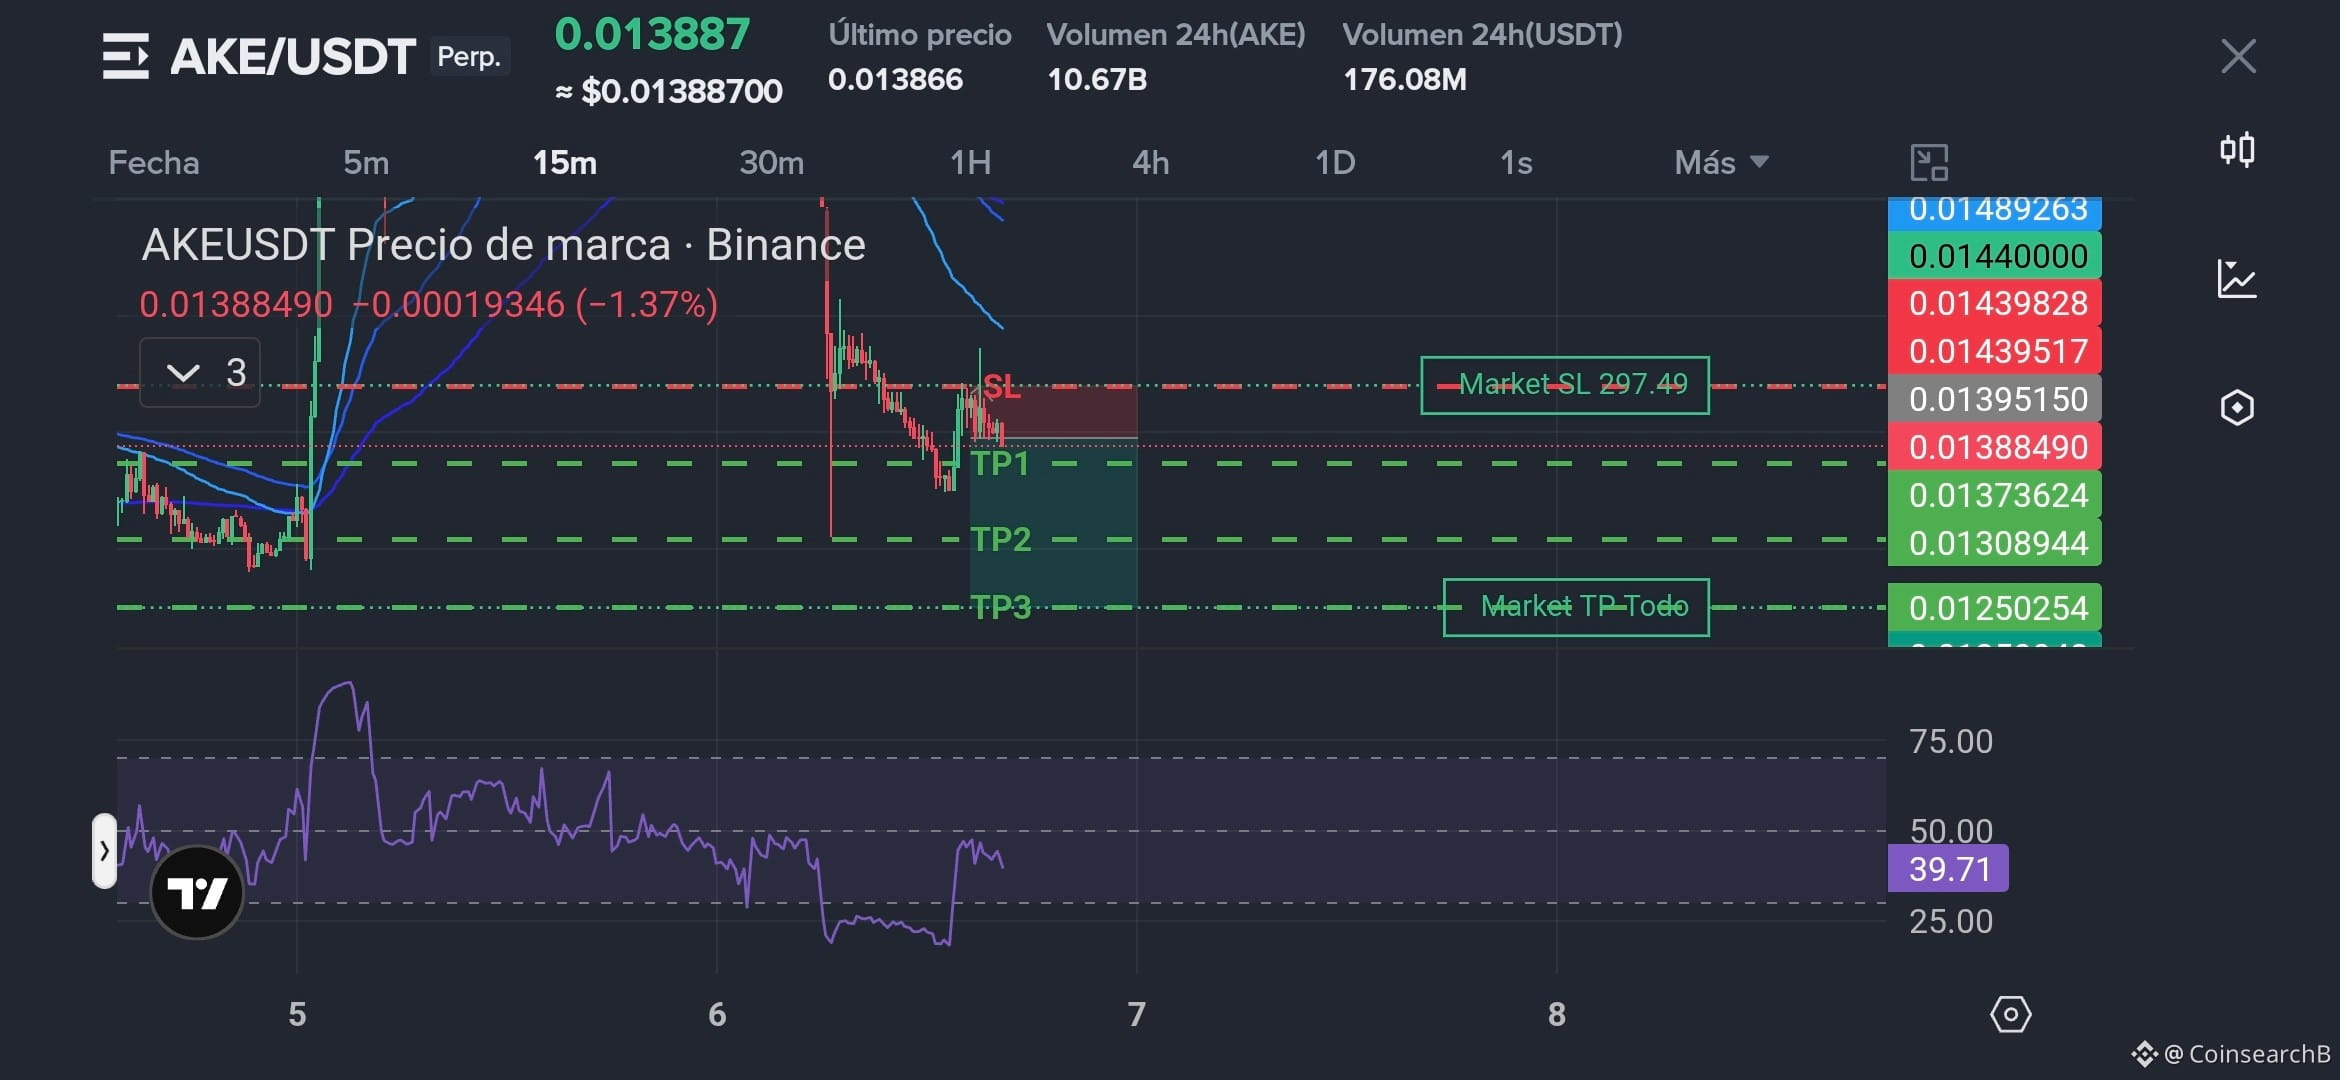
Bearish breakdown and consolidation: If we look at the 15m chart, the asset suffered a brutal sell-off that broke the entire previous bullish structure. Now, instead of recovering in a "V", the price is consolidating flat and weak below resistance. This is a typical bearish flag formation or a pause before another sharp move down.
Momentum in favor of the bears: The RSI is at 39.71. It clearly shows us that sentiment is bearish, but the most important thing is that the indicator is not in extreme oversold territory. We have a perfect room to move ("full tank" to the downside) to go after our targets without a strong bounce scaring us off.
Asymmetric Risk Management: By positioning ourselves in this rejection zone (near 0.01395), our Stop Loss is logically protected above the last bounce attempt and the structural resistance (0.01439). We risk little for a huge downside potential.
Trade Development: TP1 serves to take profit quickly once it breaks local lows. From there, we secure the trade at breakeven and let the position run risk-free toward TP2 and TP3 (0.01250), looking for the full extension of the bearish move.
With this price action, are you the type who tries to "catch the falling knife" by betting on a long bounce, or do you prefer to play it safe and trade in favor of the bearish trend? Leave your strategy in the comments! 👇
Click here to trade 👇
$AKE - 🔴 SHORT - Conf 83%
Trading Plan:
Entry: 0.01388000 – 0.01395150
SL: 0.01439828
TP1: 0.01373624
TP2: 0.01308944
TP3: 0.01250254
The technical logic behind the trade:
Bearish breakdown and consolidation: If we look at the 15m chart, the asset suffered a brutal sell-off that broke the entire previous bullish structure. Now, instead of recovering in a "V", the price is consolidating flat and weak below resistance. This is a typical bearish flag formation or a pause before another sharp move down.
Momentum in favor of the bears: The RSI is at 39.71. It clearly shows us that sentiment is bearish, but the most important thing is that the indicator is not in extreme oversold territory. We have a perfect room to move ("full tank" to the downside) to go after our targets without a strong bounce scaring us off.
Asymmetric Risk Management: By positioning ourselves in this rejection zone (near 0.01395), our Stop Loss is logically protected above the last bounce attempt and the structural resistance (0.01439). We risk little for a huge downside potential.
Trade Development: TP1 serves to take profit quickly once it breaks local lows. From there, we secure the trade at breakeven and let the position run risk-free toward TP2 and TP3 (0.01250), looking for the full extension of the bearish move.
With this price action, are you the type who tries to "catch the falling knife" by betting on a long bounce, or do you prefer to play it safe and trade in favor of the bearish trend? Leave your strategy in the comments! 👇
Click here to trade 👇