

When most people look at short-term fluctuations, despair takes over because they lack a long-term vision. The secret is to zoom out.
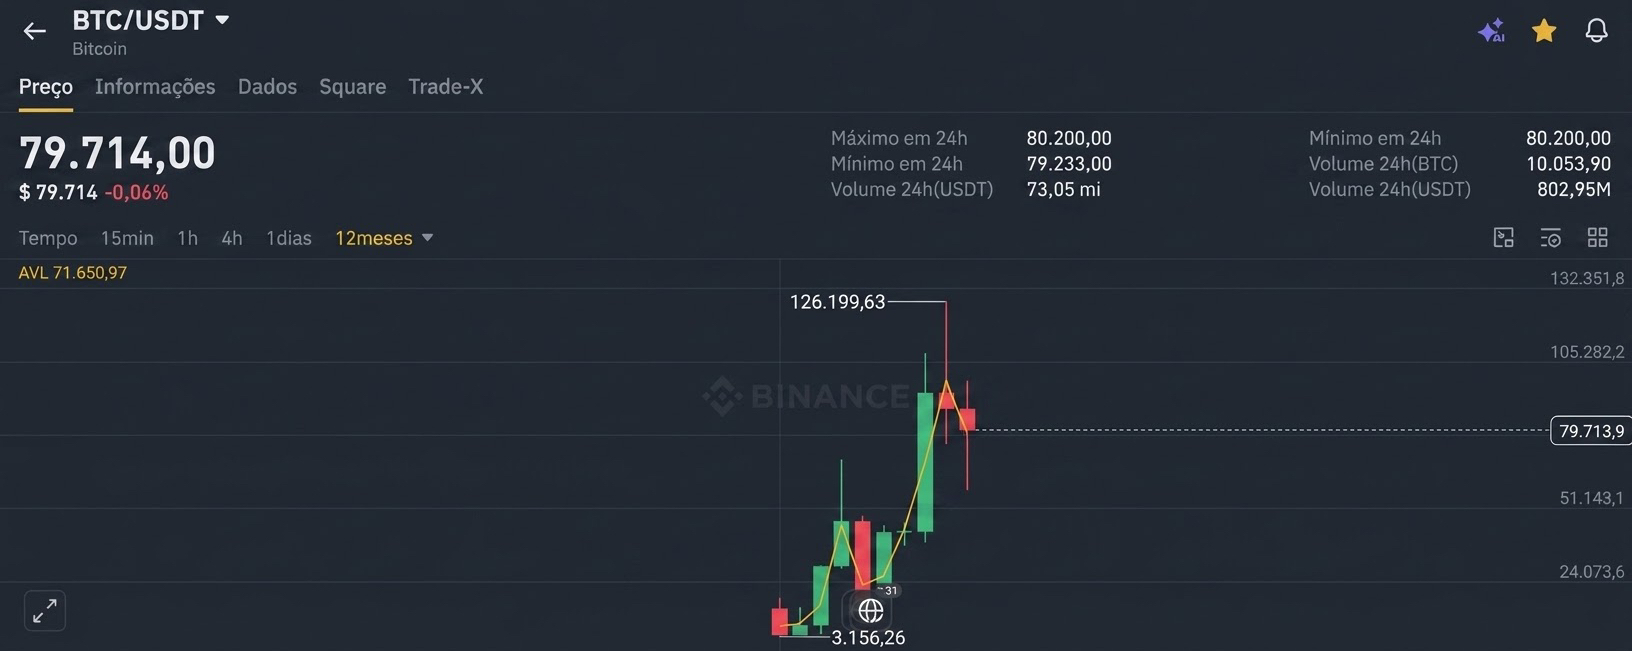
Looking at this chart on the 12-month timeframe leaves a stark, naked truth on the screen: Bitcoin has never been in decline, but rather gathering strength and building higher steps.
What the market calls a "collapse" is just the noise of smaller charts misleading those who do not understand the asset's structure.
What happens in practice is not a structural collapse, but rather a natural repricing and a continuous test of liquidity.
Each annual candle that forms tells the story of an asset that rose from negligible lows to consolidate near US$80,000, even after it sought the all-time high at US$126,199.
Aggressive pullbacks are part of Bitcoin’s DNA: to flush out weak hands, transfer capital to patient institutional hands, and build solid foundations before the next jump.
While the crowd panics at red candles and spot corrections, those who understand the cycle see only price compression and maturation.
Bitcoin doesn’t fall; it breathes, pulls back to find support, and prepares for the next expansion cycle. The annual chart timeline doesn’t lie: the primary trend is still an unrelenting upward line.
