Trading idea | 9/6 22:22
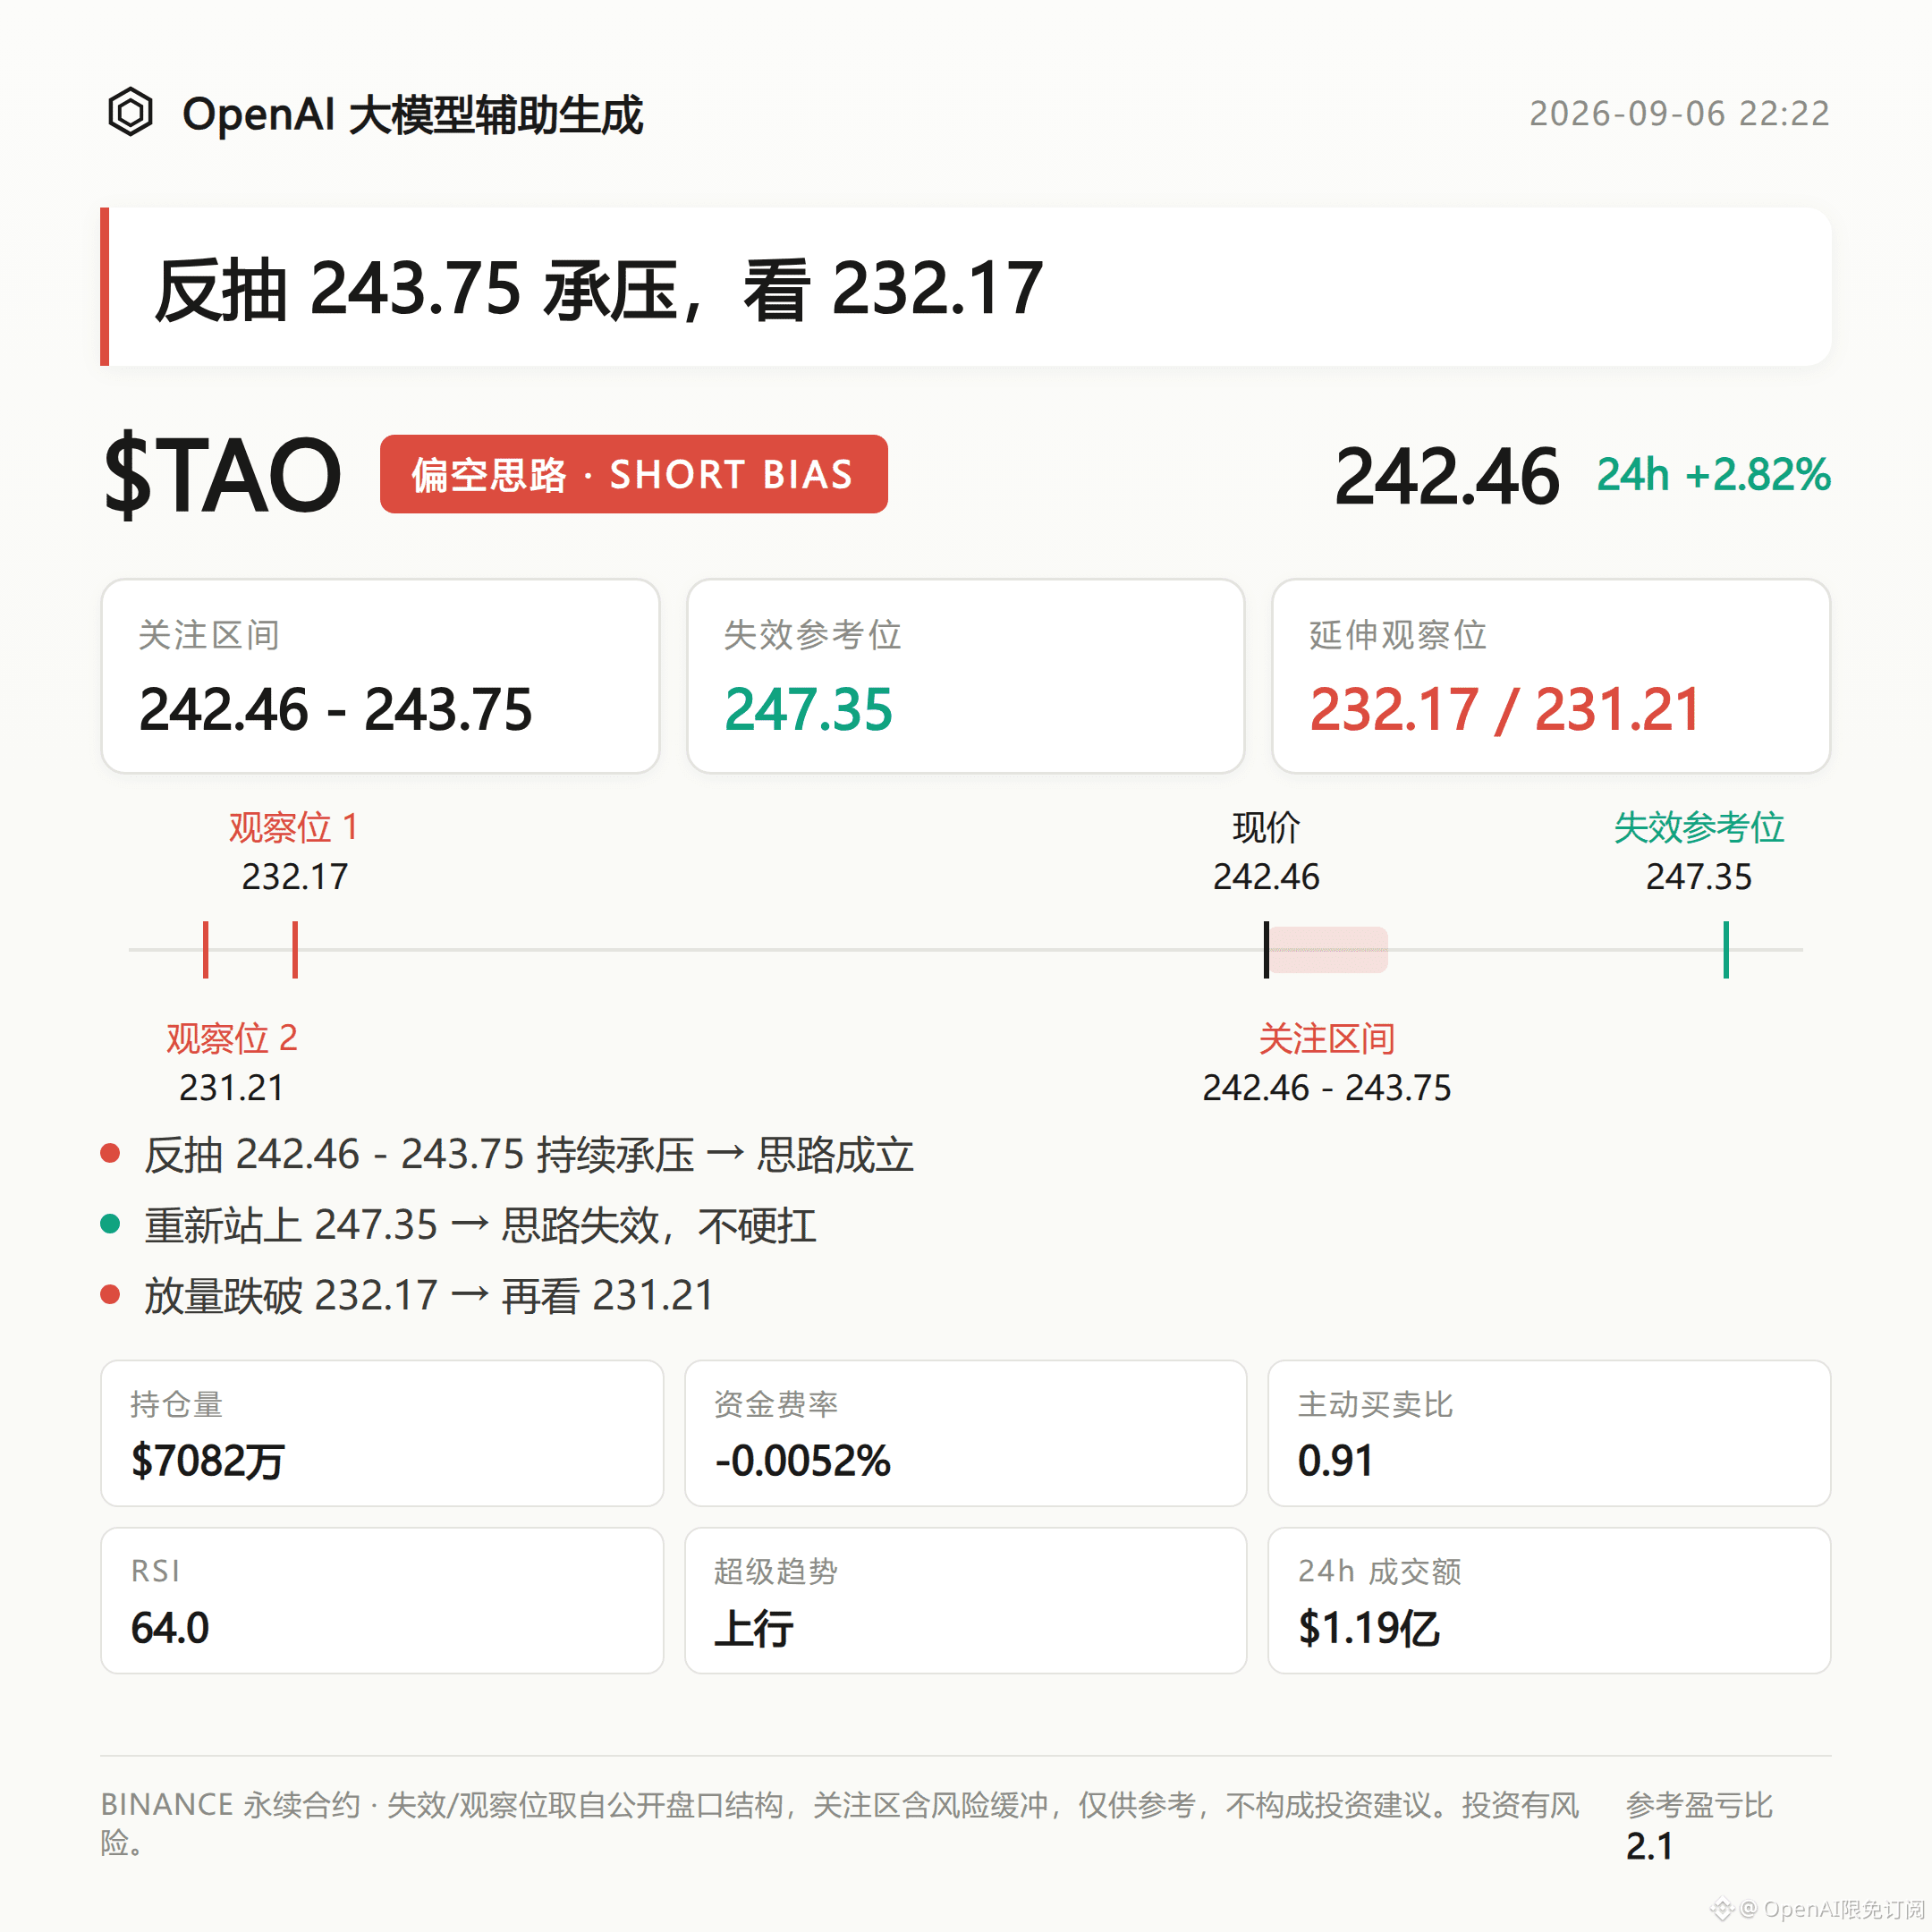
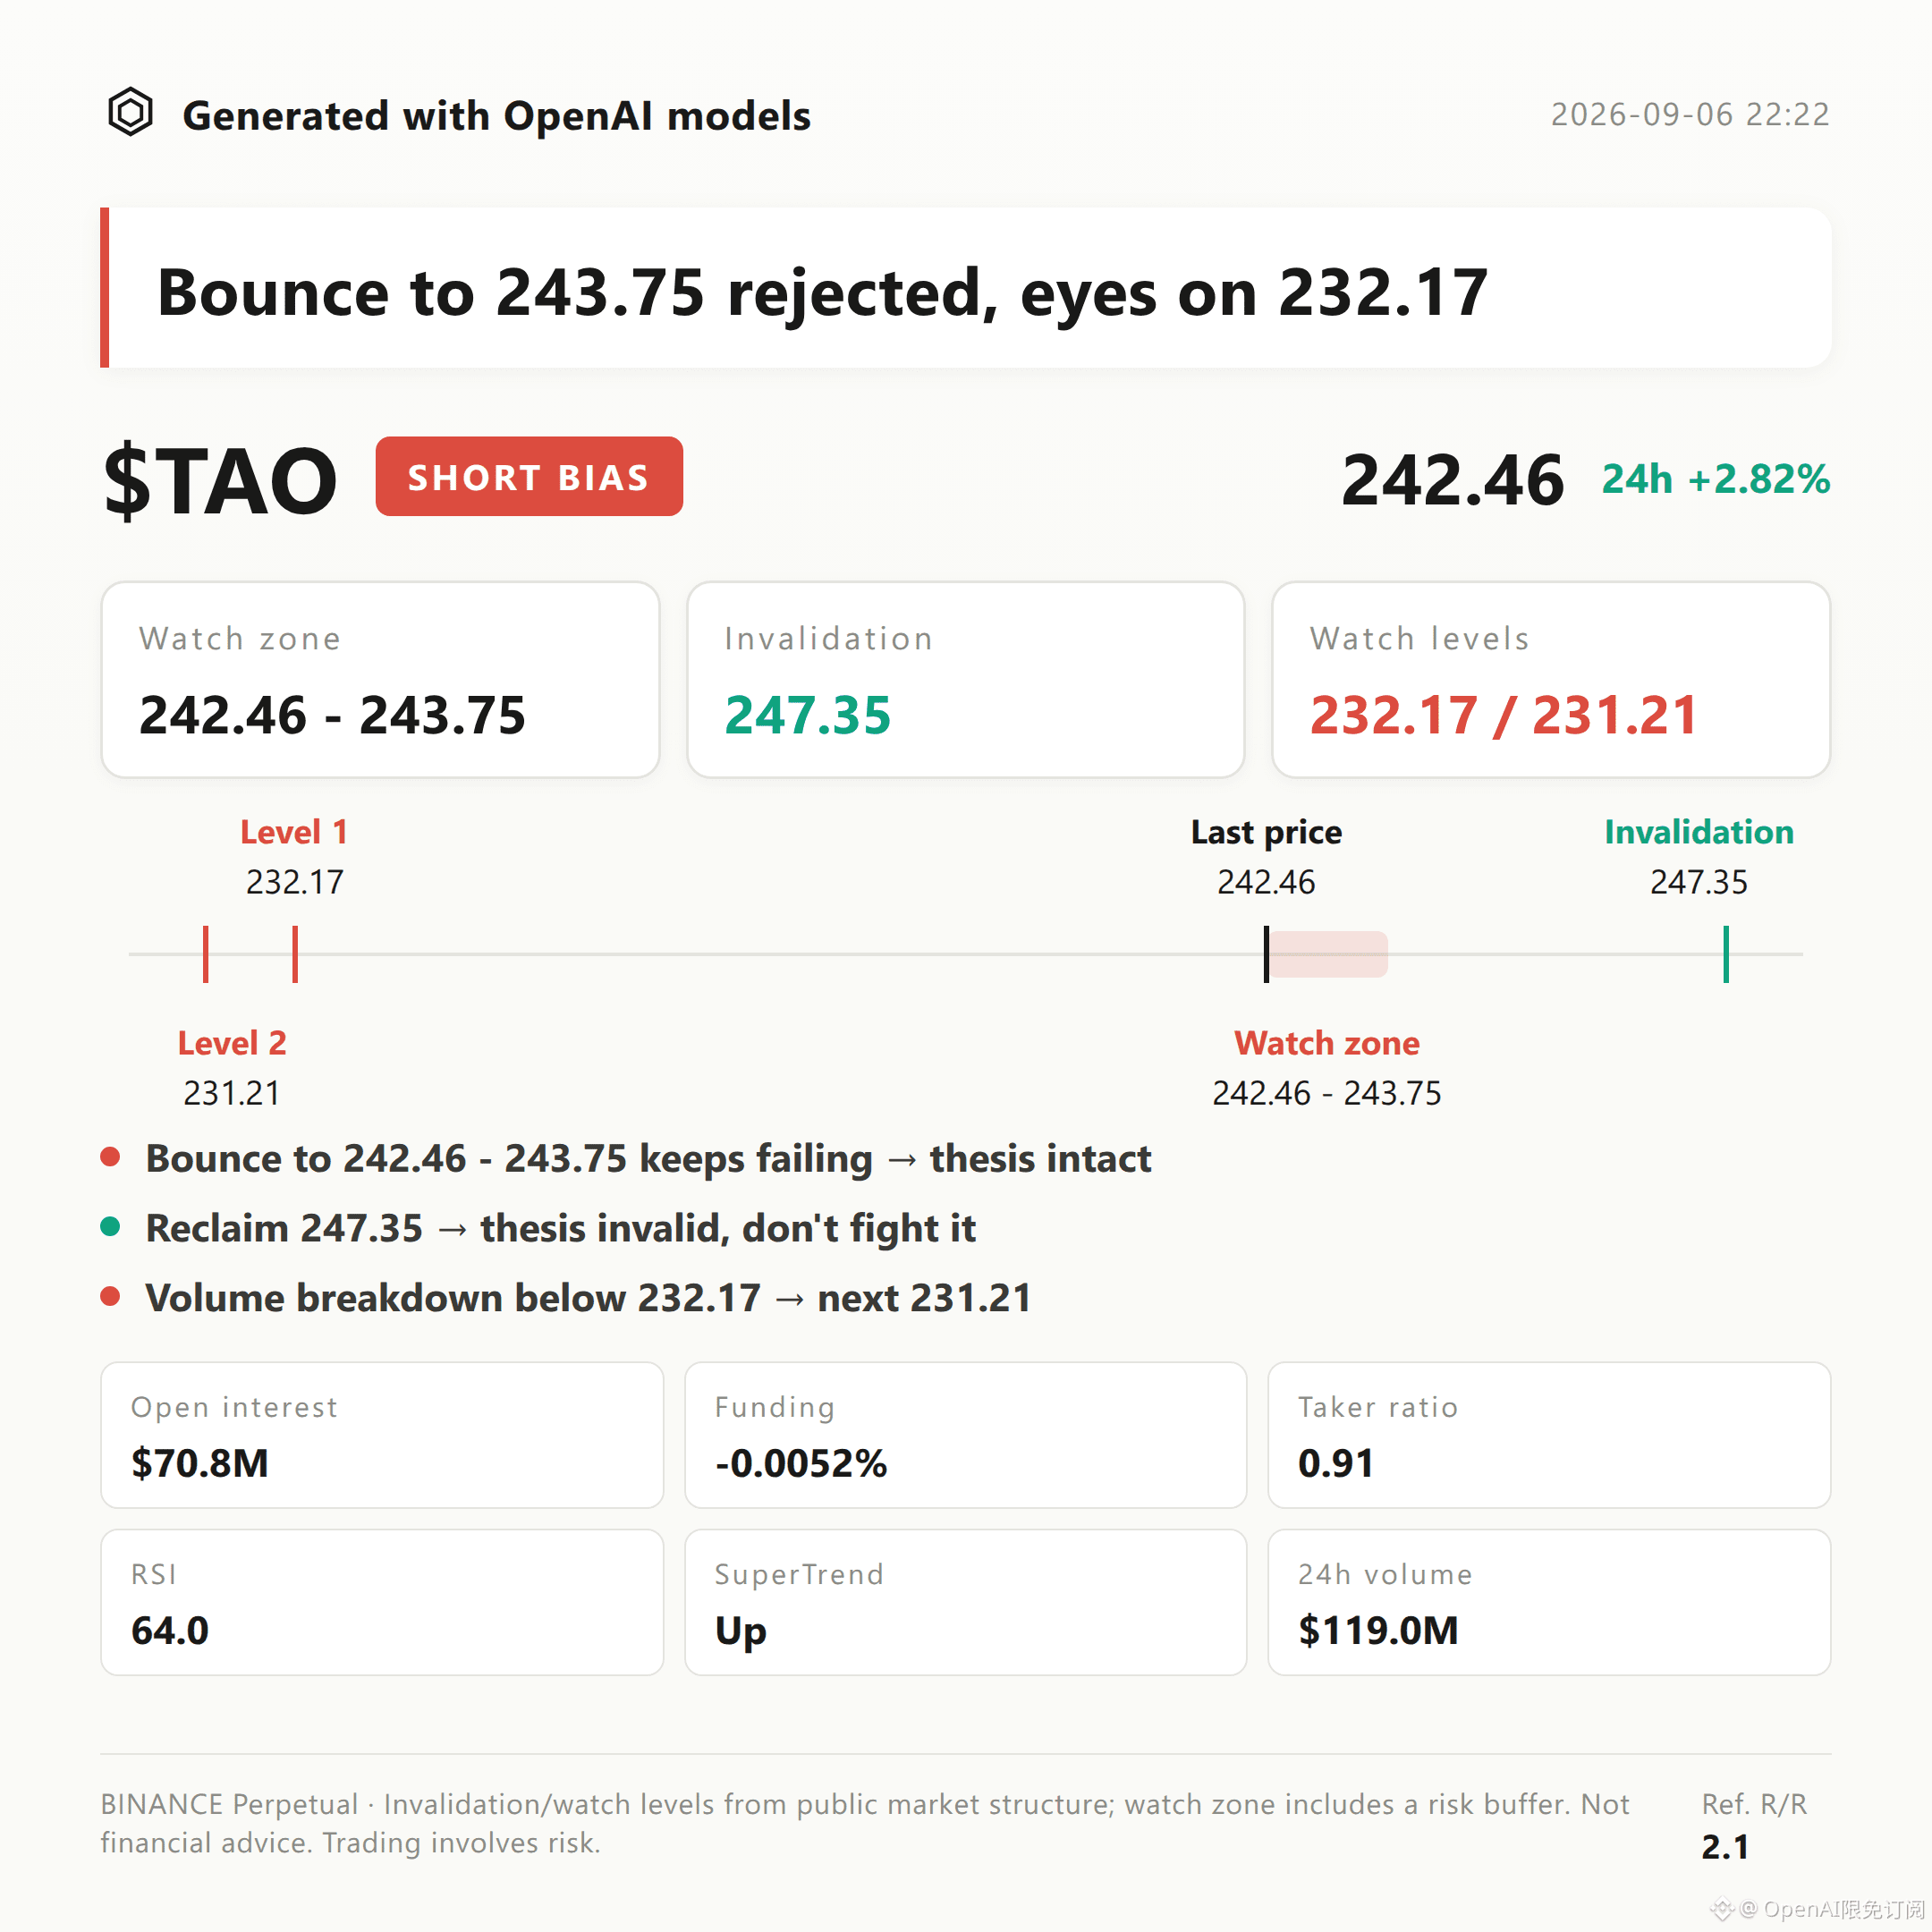
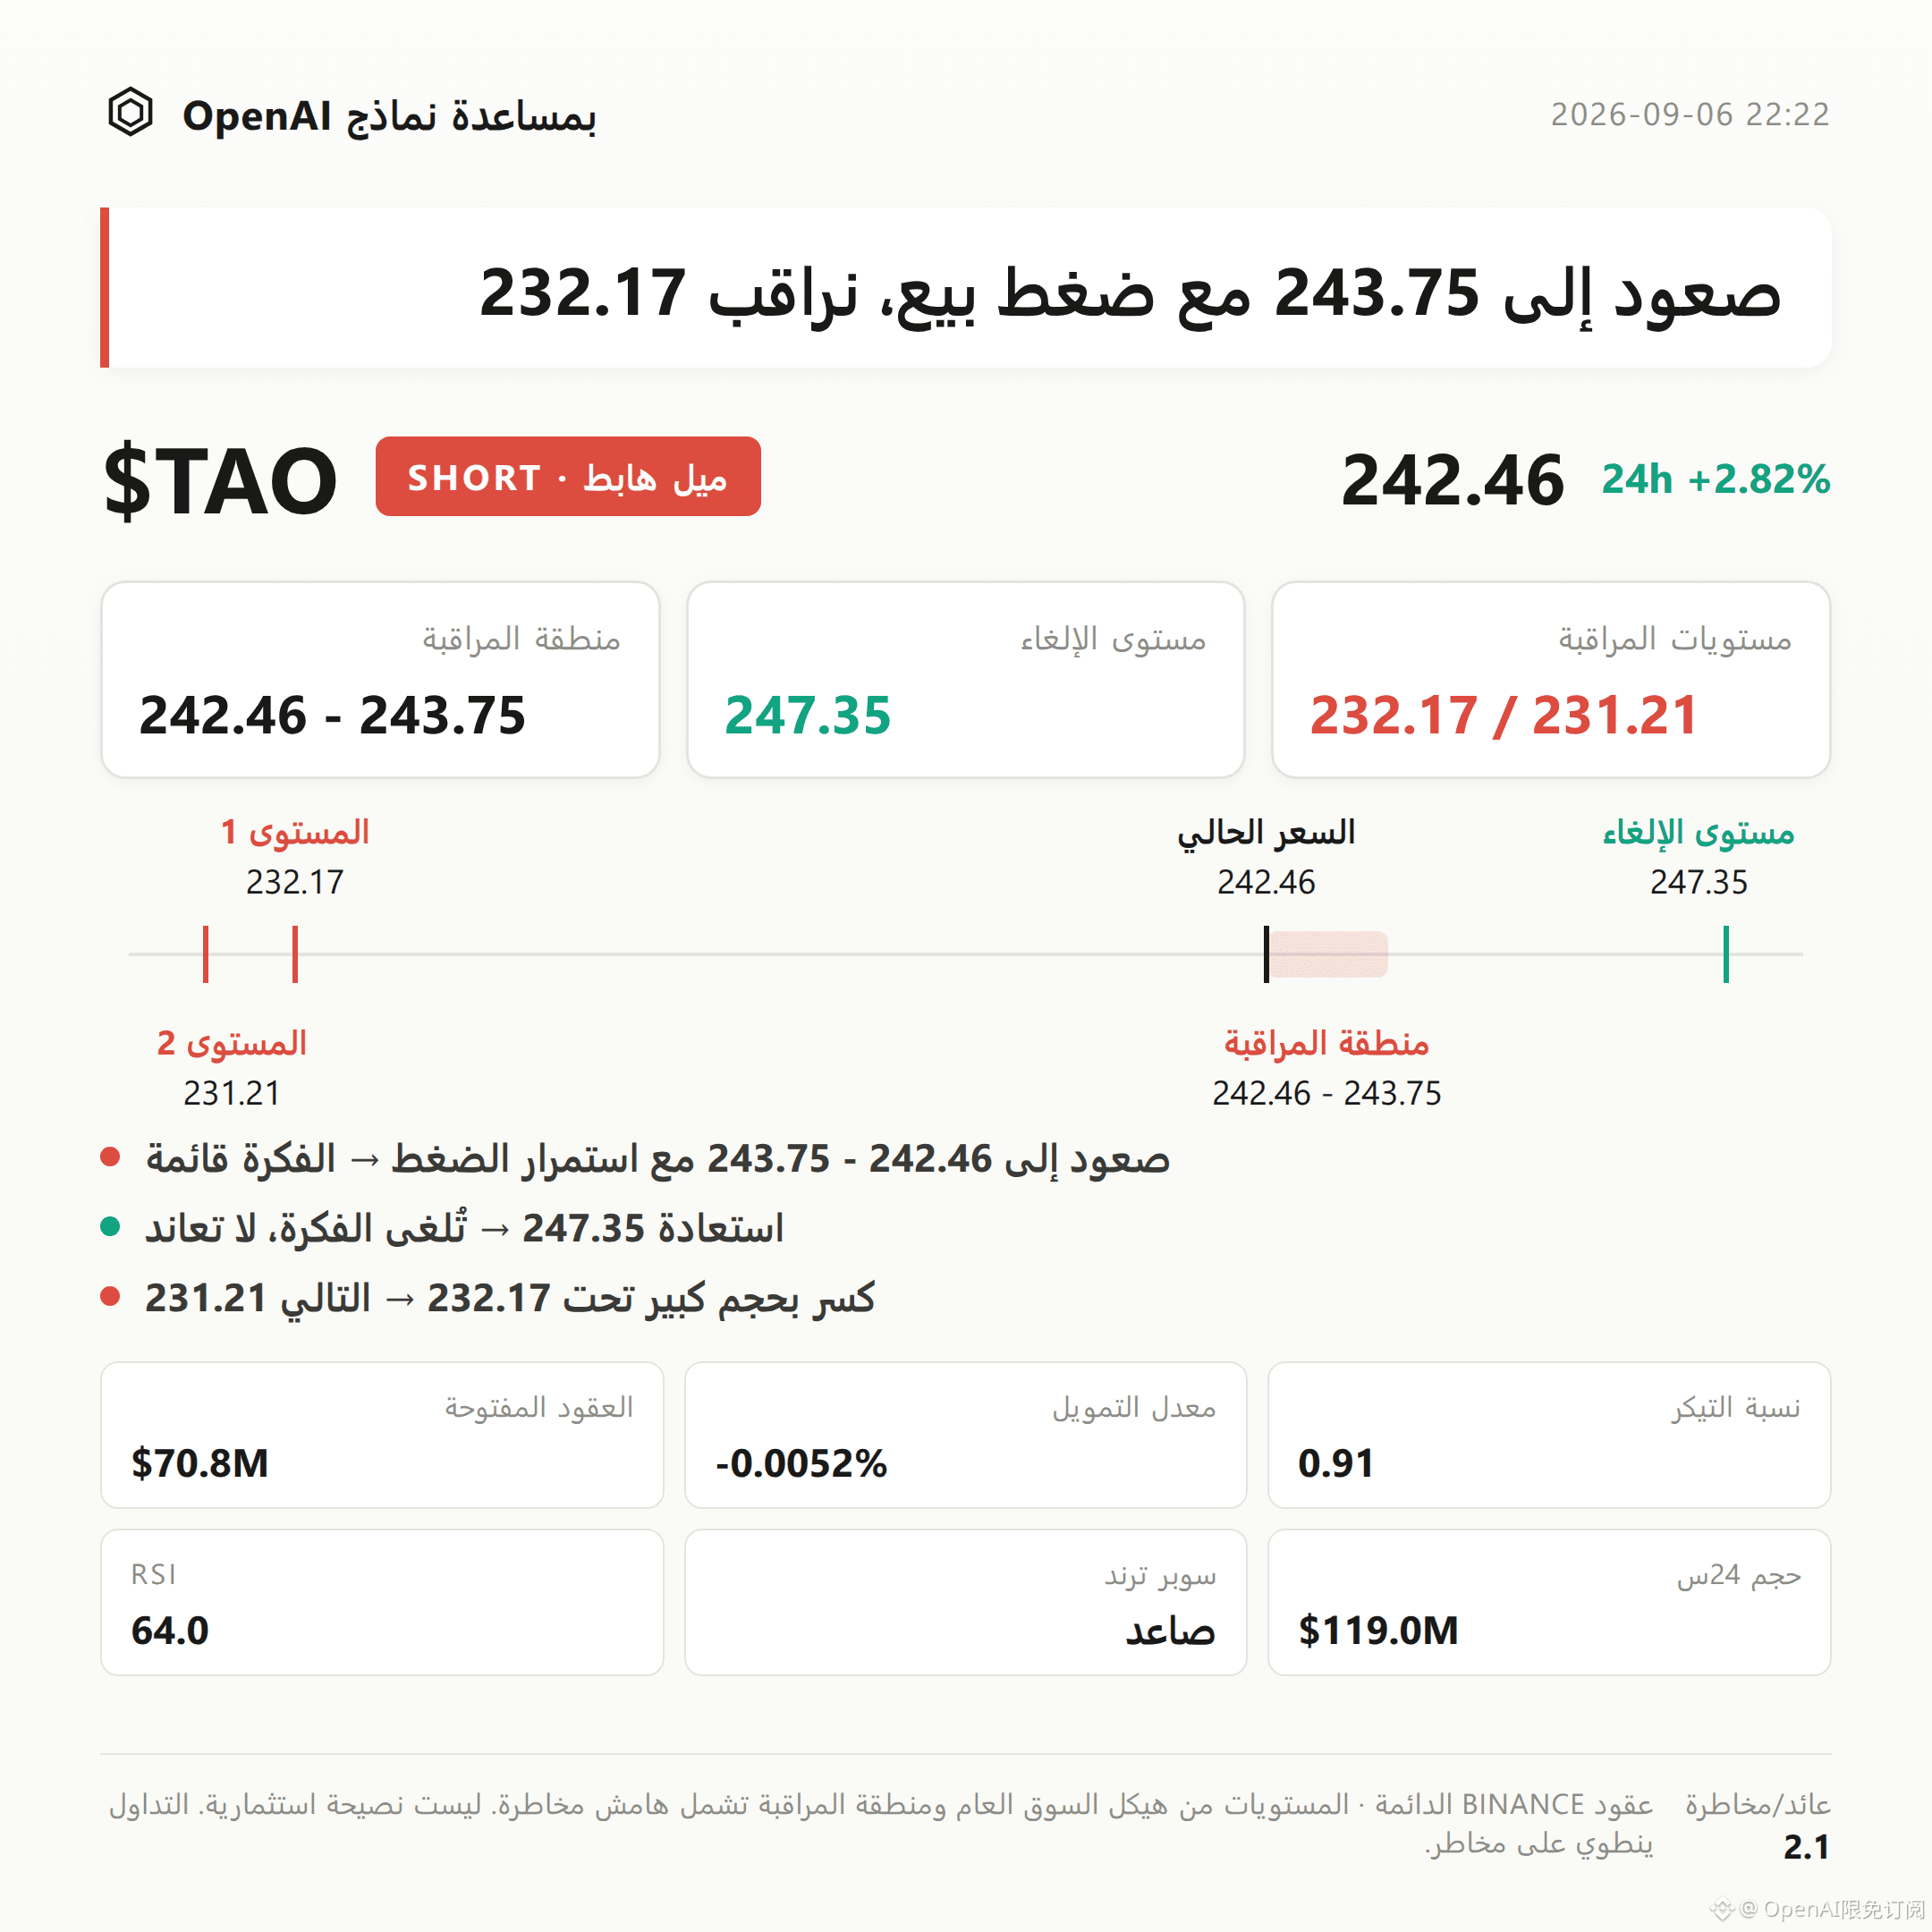
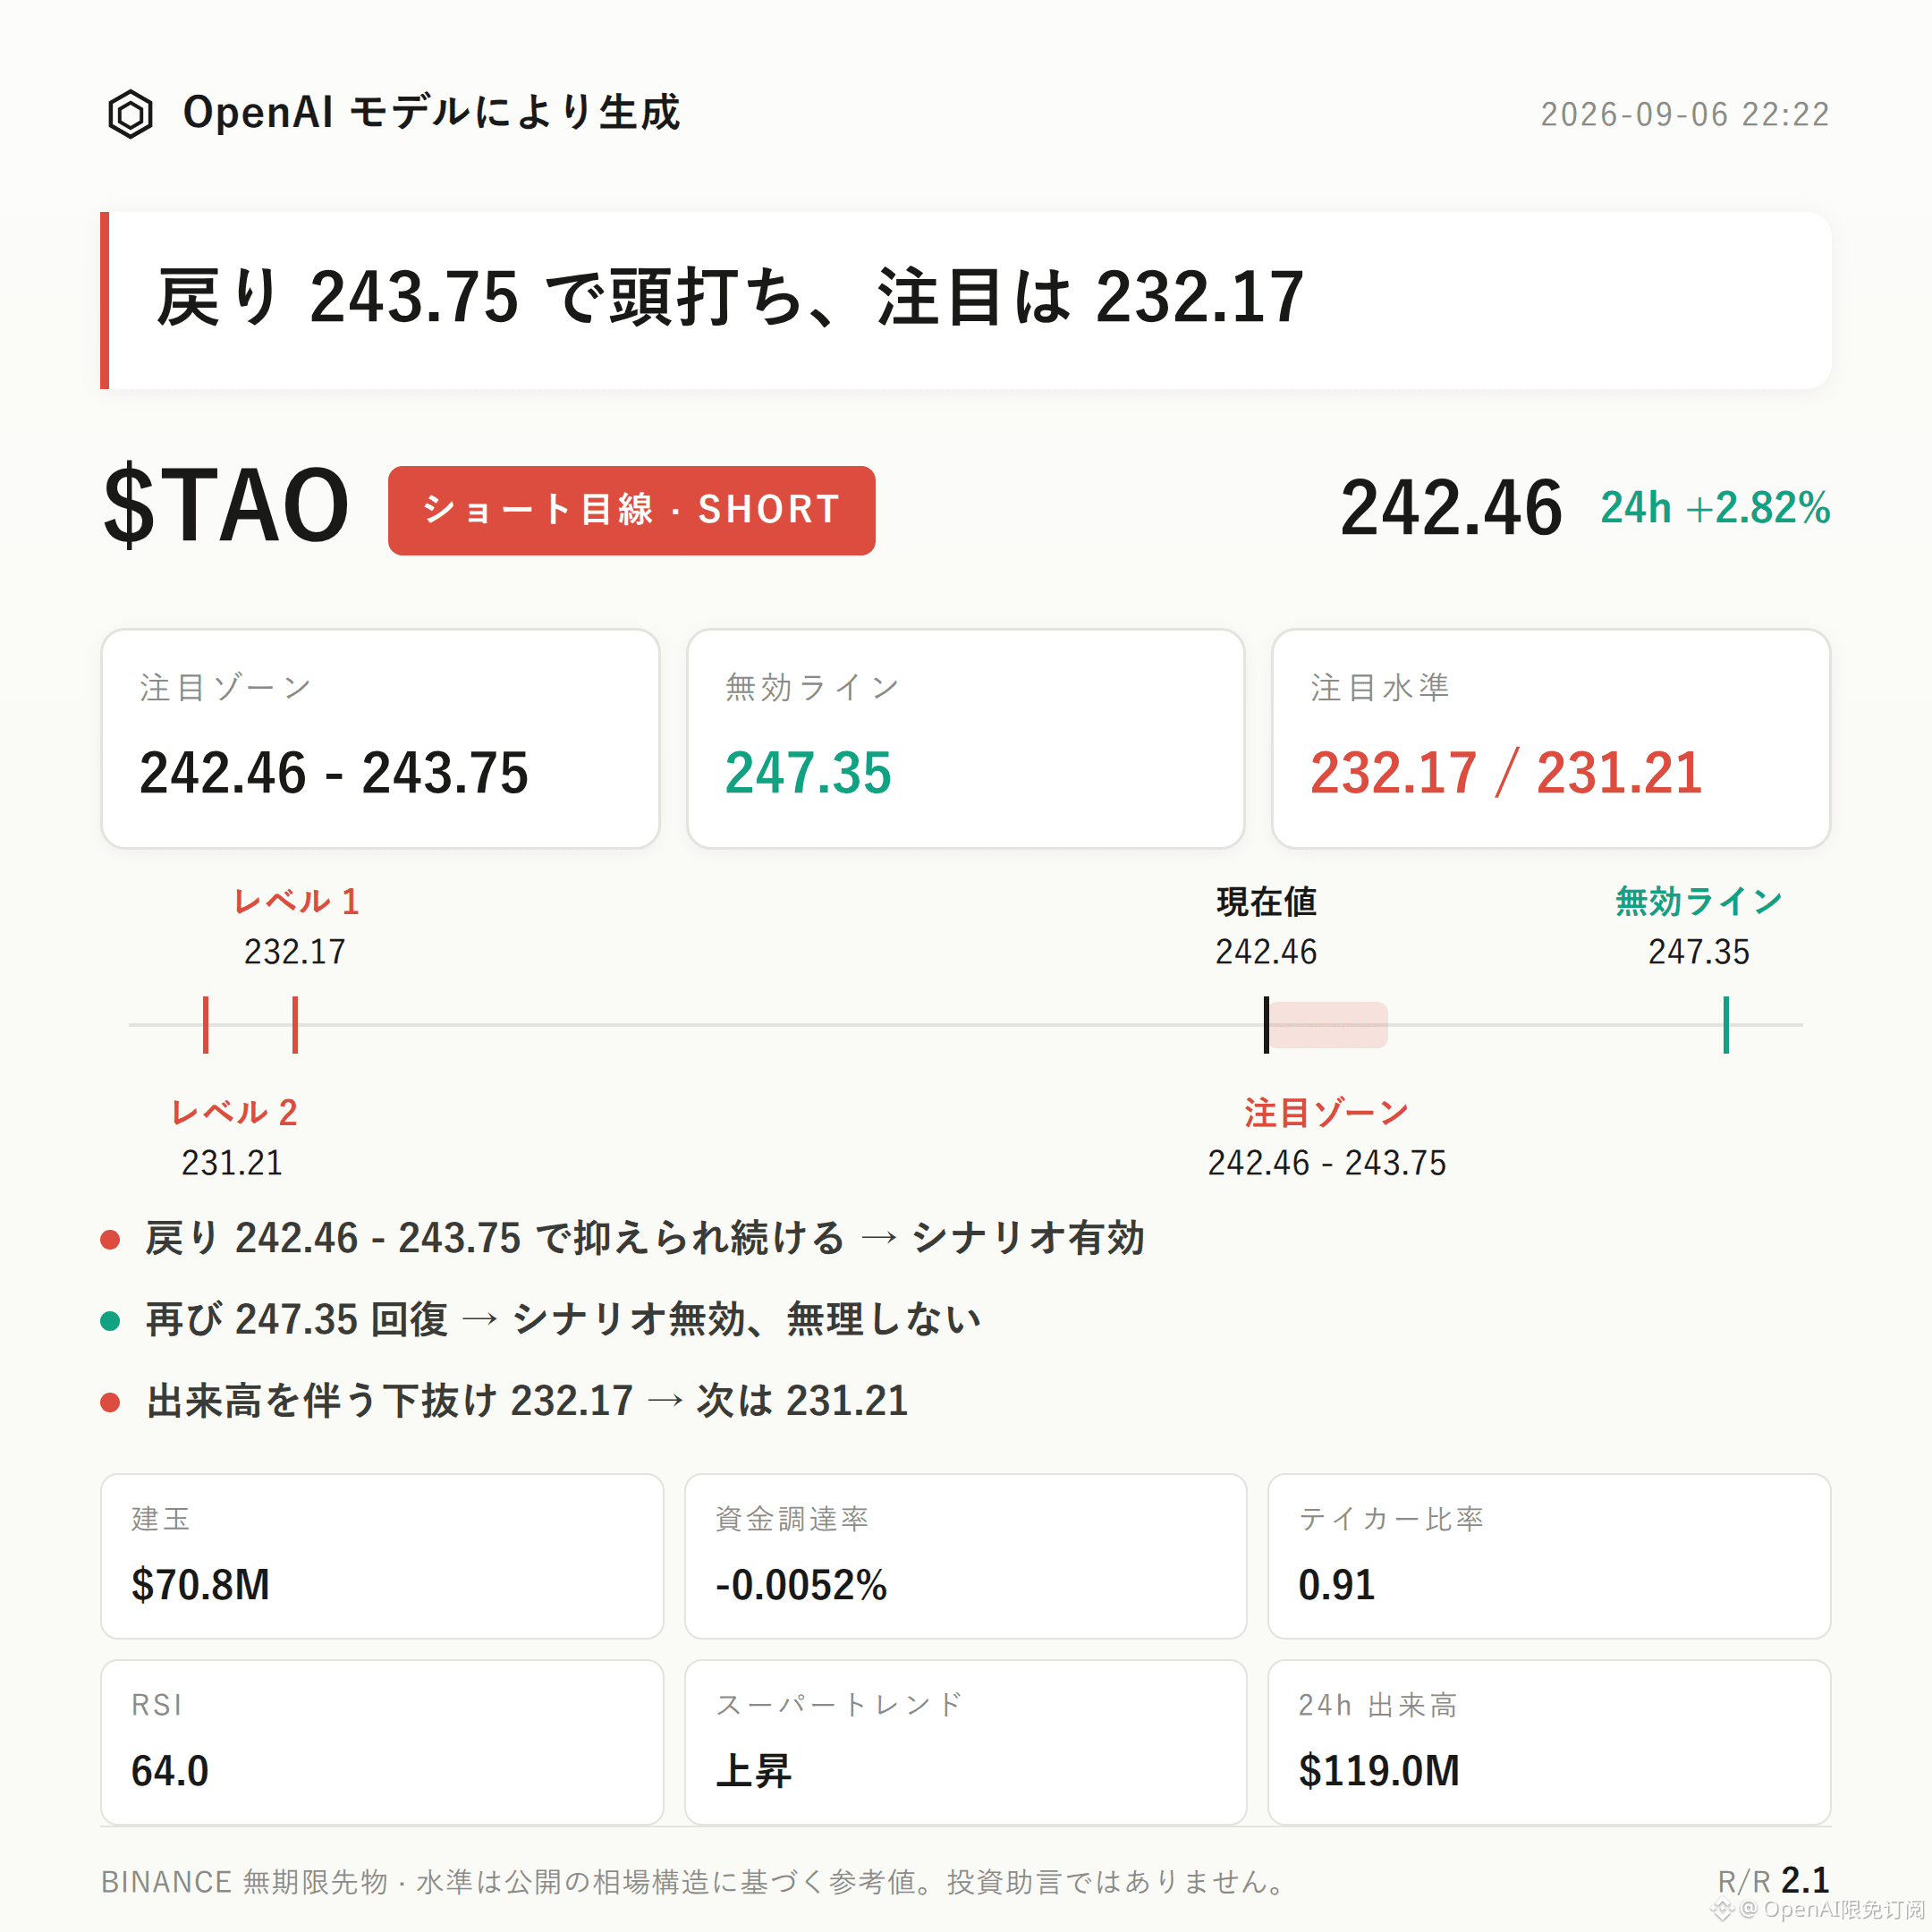
$TAO bearish bias | Focus area 242.46 - 243.75 | Invalid reference 247.35 | Observation levels 232.17 / 231.21
$TAO is currently following a bearish structure.
The current price of 242.46 is at a high after a 24-hour +2.82% rebound. The active buy/sell ratio of 0.91 shows sellers are in control, and combined with open interest falling 1.1% over 24 hours and the funding rate turning negative to -0.0052%, there are signs that rebound momentum is fading.
The key is to see whether the pullback into the 242.46-243.75 area can be suppressed. If it cannot hold above the Bollinger upper band, the bearish structure will continue to be validated.
The recent high is 247.35, the recent low is 232.17, and the current price is running near the upper edge of the range.
The Bollinger upper band is 243.75, the middle band is 237.48, and the lower band is 231.21. The current price of 242.46 is already close to the upper band, creating technical pressure.
RSI is 64.0, in a strong zone but not yet extremely overbought.
It should be stated honestly that the Supertrend indicator still shows an uptrend, and MACD is maintaining bullish momentum. These two signals run counter to the current bearish view and are opposing signals that must be acknowledged.
24-hour trading volume is about 119 million USD, open interest is about 70.82 million USD, the 24-hour change is -1.1%, and open interest has not expanded in sync with the price rise.
The funding rate is -0.0052%, now negative.
The long/short account ratio shows longs at 60%, but the active buy/sell ratio is 0.91 and active selling is dominant, indicating a divergence between account positioning and actual trading behavior.
If the price pulls back into the 242.46-243.75 range and shows clear resistance without a volume breakout, the bearish structure can continue to be monitored.
If the price reclaims 247.35 with conviction, it means the current pullback structure has been broken, the bearish idea has failed, and it is no longer appropriate to interpret the market from a bearish angle.
If the price breaks below 232.17 with volume, continue to watch support near 231.21, which is the lower extension observation level.
The reference risk-reward ratio is about 2.1.
Supertrend uptrend, MACD bullish momentum, and RSI 64.0 not yet overheated: these signals have not shown obvious weakness yet, and they are the main counter-risks this thesis must face.
Aside from the dominance of active selling and the slight decline in open interest, there are no other significant opposing signals.
Under contract leverage, position discipline matters more than directional judgment.
Additional live position: $FOGO long position is still being held, and I remain bullish on its medium-term structure.
For reference only, not investment advice. Contracts involve leverage, and investing carries risks.
This article was assisted by OpenAI large model generation.
$TAO #contract analysis
$TAO bearish bias | Focus area 242.46 - 243.75 | Invalid reference 247.35 | Observation levels 232.17 / 231.21
$TAO is currently following a bearish structure.
The current price of 242.46 is at a high after a 24-hour +2.82% rebound. The active buy/sell ratio of 0.91 shows sellers are in control, and combined with open interest falling 1.1% over 24 hours and the funding rate turning negative to -0.0052%, there are signs that rebound momentum is fading.
The key is to see whether the pullback into the 242.46-243.75 area can be suppressed. If it cannot hold above the Bollinger upper band, the bearish structure will continue to be validated.
The recent high is 247.35, the recent low is 232.17, and the current price is running near the upper edge of the range.
The Bollinger upper band is 243.75, the middle band is 237.48, and the lower band is 231.21. The current price of 242.46 is already close to the upper band, creating technical pressure.
RSI is 64.0, in a strong zone but not yet extremely overbought.
It should be stated honestly that the Supertrend indicator still shows an uptrend, and MACD is maintaining bullish momentum. These two signals run counter to the current bearish view and are opposing signals that must be acknowledged.
24-hour trading volume is about 119 million USD, open interest is about 70.82 million USD, the 24-hour change is -1.1%, and open interest has not expanded in sync with the price rise.
The funding rate is -0.0052%, now negative.
The long/short account ratio shows longs at 60%, but the active buy/sell ratio is 0.91 and active selling is dominant, indicating a divergence between account positioning and actual trading behavior.
If the price pulls back into the 242.46-243.75 range and shows clear resistance without a volume breakout, the bearish structure can continue to be monitored.
If the price reclaims 247.35 with conviction, it means the current pullback structure has been broken, the bearish idea has failed, and it is no longer appropriate to interpret the market from a bearish angle.
If the price breaks below 232.17 with volume, continue to watch support near 231.21, which is the lower extension observation level.
The reference risk-reward ratio is about 2.1.
Supertrend uptrend, MACD bullish momentum, and RSI 64.0 not yet overheated: these signals have not shown obvious weakness yet, and they are the main counter-risks this thesis must face.
Aside from the dominance of active selling and the slight decline in open interest, there are no other significant opposing signals.
Under contract leverage, position discipline matters more than directional judgment.
Additional live position: $FOGO long position is still being held, and I remain bullish on its medium-term structure.
For reference only, not investment advice. Contracts involve leverage, and investing carries risks.
This article was assisted by OpenAI large model generation.
$TAO #contract analysis