❗️IN CONTINUATION OF THE MORNING POST
This morning we looked at the long-term picture of altcoin relative strength. Now I’ll show another important confirmation.
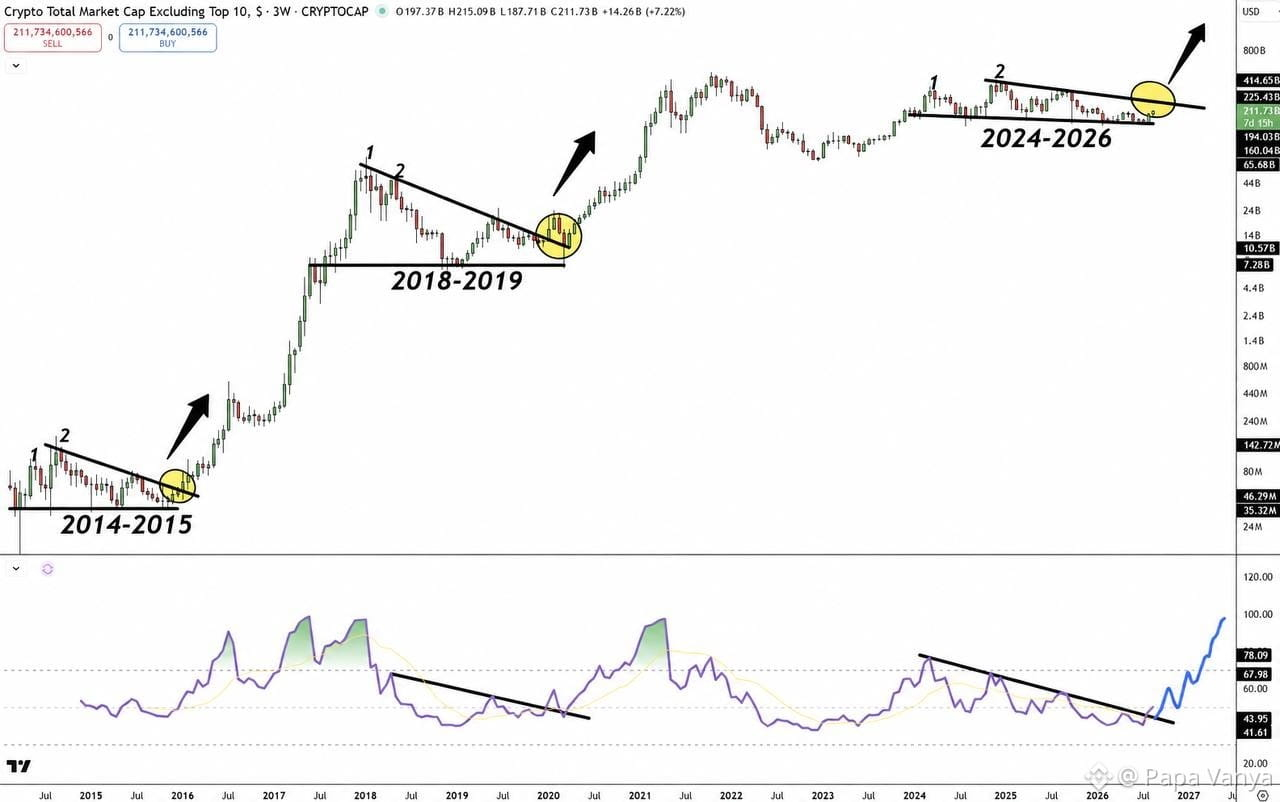
Before the strongest moves of 2017 and 2021, the market formed a similar accumulation structure.
Right now, RSI has already broken above a multi-year descending trendline, while the chart itself is only just preparing to confirm this move.
First, a breakout on RSI. Then, a breakout on the chart itself.
That is exactly how the previous major cycles began.
Just watch. 👀$BTC $XRP $ETH
This morning we looked at the long-term picture of altcoin relative strength. Now I’ll show another important confirmation.
Before the strongest moves of 2017 and 2021, the market formed a similar accumulation structure.
Right now, RSI has already broken above a multi-year descending trendline, while the chart itself is only just preparing to confirm this move.
First, a breakout on RSI. Then, a breakout on the chart itself.
That is exactly how the previous major cycles began.
Just watch. 👀$BTC $XRP $ETH