3 cryptocurrencies’ 30-minute and 4-hour MACD both formed golden crosses with increased volume, bullish trend is confirmed 🔥
════════════════════
🔴 $Q 30-minute bullish signal
⚠️ Technicals: The 4-hour chart is biased bullish overall, so trade in line with the daily trend. On the 30-minute chart, the 5-day moving average has just crossed above the 8-day moving average, KDJ has formed a golden cross without being overbought yet, and trading volume has increased 4.8 times. Multiple timeframes are resonating together, so short-term entry is possible.
════════════════════
🔴 $FF 30-minute bullish signal
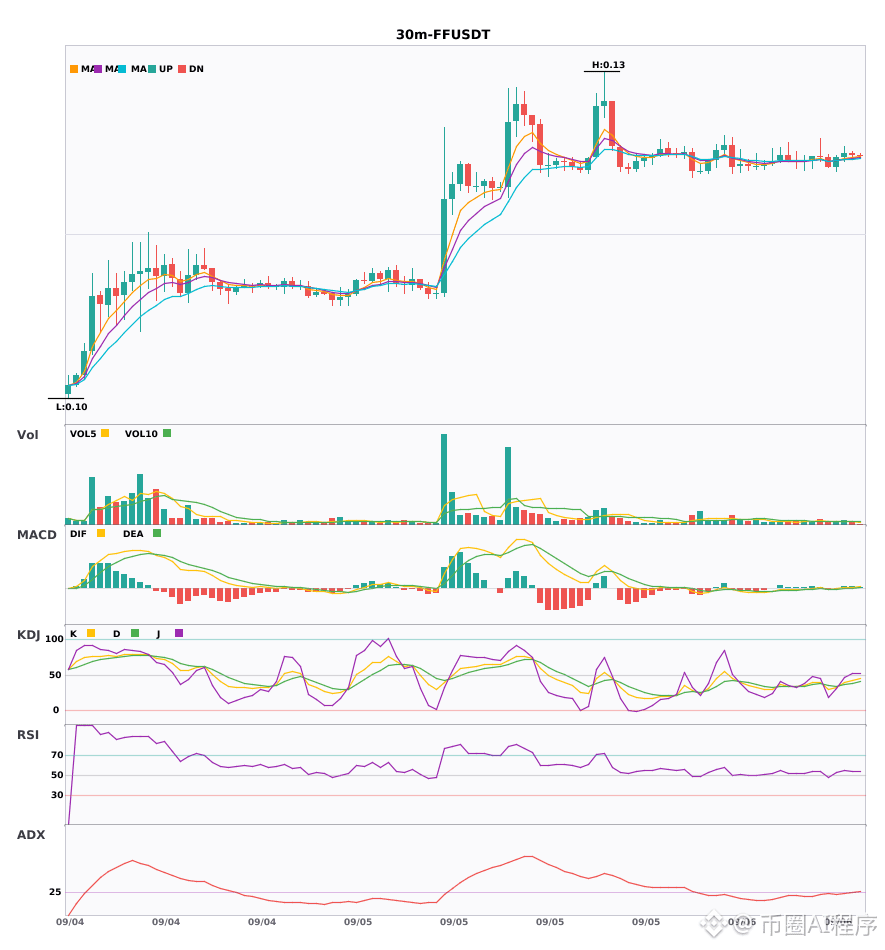
⚠️ Technicals: The 4-hour and 30-minute timeframes are both trending bullish. On the 30-minute chart, after the MACD golden cross, the red histogram has expanded, moving averages are aligned in a bullish formation and spreading upward, KDJ has just formed a golden cross and is still at a low level without being overbought, and volume is supportive. Look for long opportunities.
════════════════════
🔴 $WIF 30-minute bullish signal
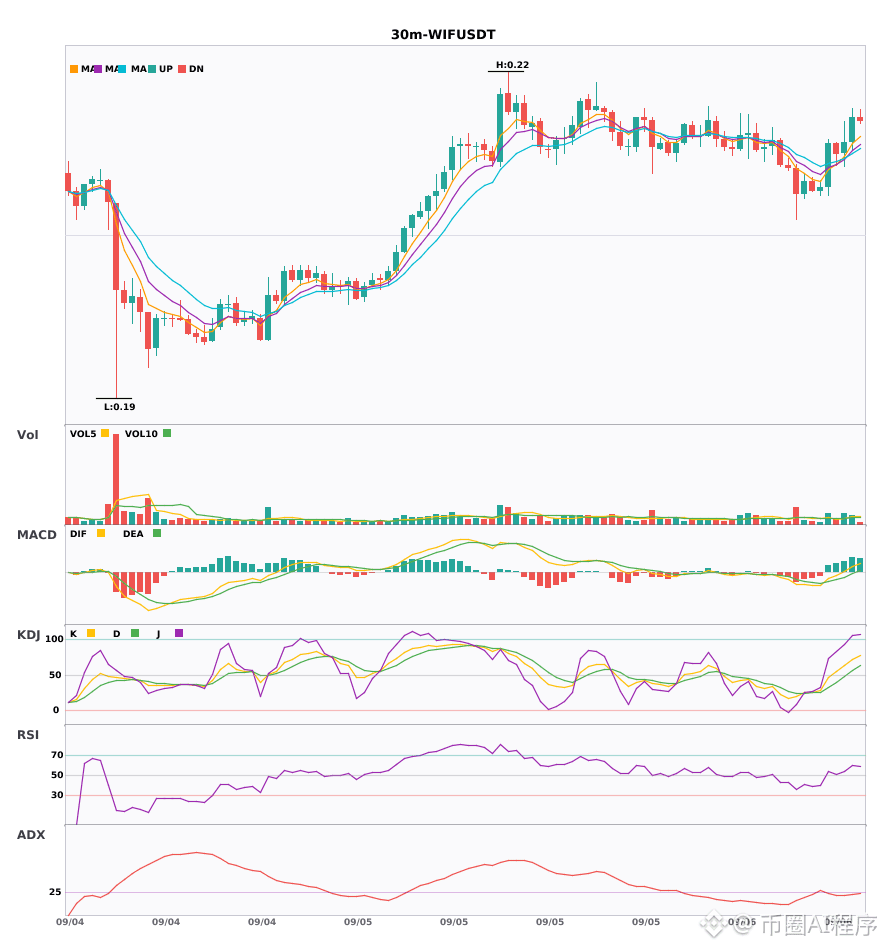
⚠️ Technicals: The 4-hour chart is broadly bullish, and on the 30-minute chart the MACD has formed a golden cross with a longer red histogram. The 5, 8, and 13 moving averages have just aligned in a bullish formation, and the K line in KDJ is strengthening above the D line but has not reached overbought levels yet. Trading volume has also increased, so multiple timeframes are resonating bullishly.
════════════════════
🔔 Follow to get the first-hand market moves 🔔
#多周期共振 #Q #FF #WIF
📌 When trading, pay attention to whether the candlestick pattern matches
════════════════════
🔴 $Q 30-minute bullish signal
⚠️ Technicals: The 4-hour chart is biased bullish overall, so trade in line with the daily trend. On the 30-minute chart, the 5-day moving average has just crossed above the 8-day moving average, KDJ has formed a golden cross without being overbought yet, and trading volume has increased 4.8 times. Multiple timeframes are resonating together, so short-term entry is possible.
════════════════════
🔴 $FF 30-minute bullish signal
⚠️ Technicals: The 4-hour and 30-minute timeframes are both trending bullish. On the 30-minute chart, after the MACD golden cross, the red histogram has expanded, moving averages are aligned in a bullish formation and spreading upward, KDJ has just formed a golden cross and is still at a low level without being overbought, and volume is supportive. Look for long opportunities.
════════════════════
🔴 $WIF 30-minute bullish signal
⚠️ Technicals: The 4-hour chart is broadly bullish, and on the 30-minute chart the MACD has formed a golden cross with a longer red histogram. The 5, 8, and 13 moving averages have just aligned in a bullish formation, and the K line in KDJ is strengthening above the D line but has not reached overbought levels yet. Trading volume has also increased, so multiple timeframes are resonating bullishly.
════════════════════
🔔 Follow to get the first-hand market moves 🔔
#多周期共振 #Q #FF #WIF
📌 When trading, pay attention to whether the candlestick pattern matches