Trading idea | 9/6 18:21
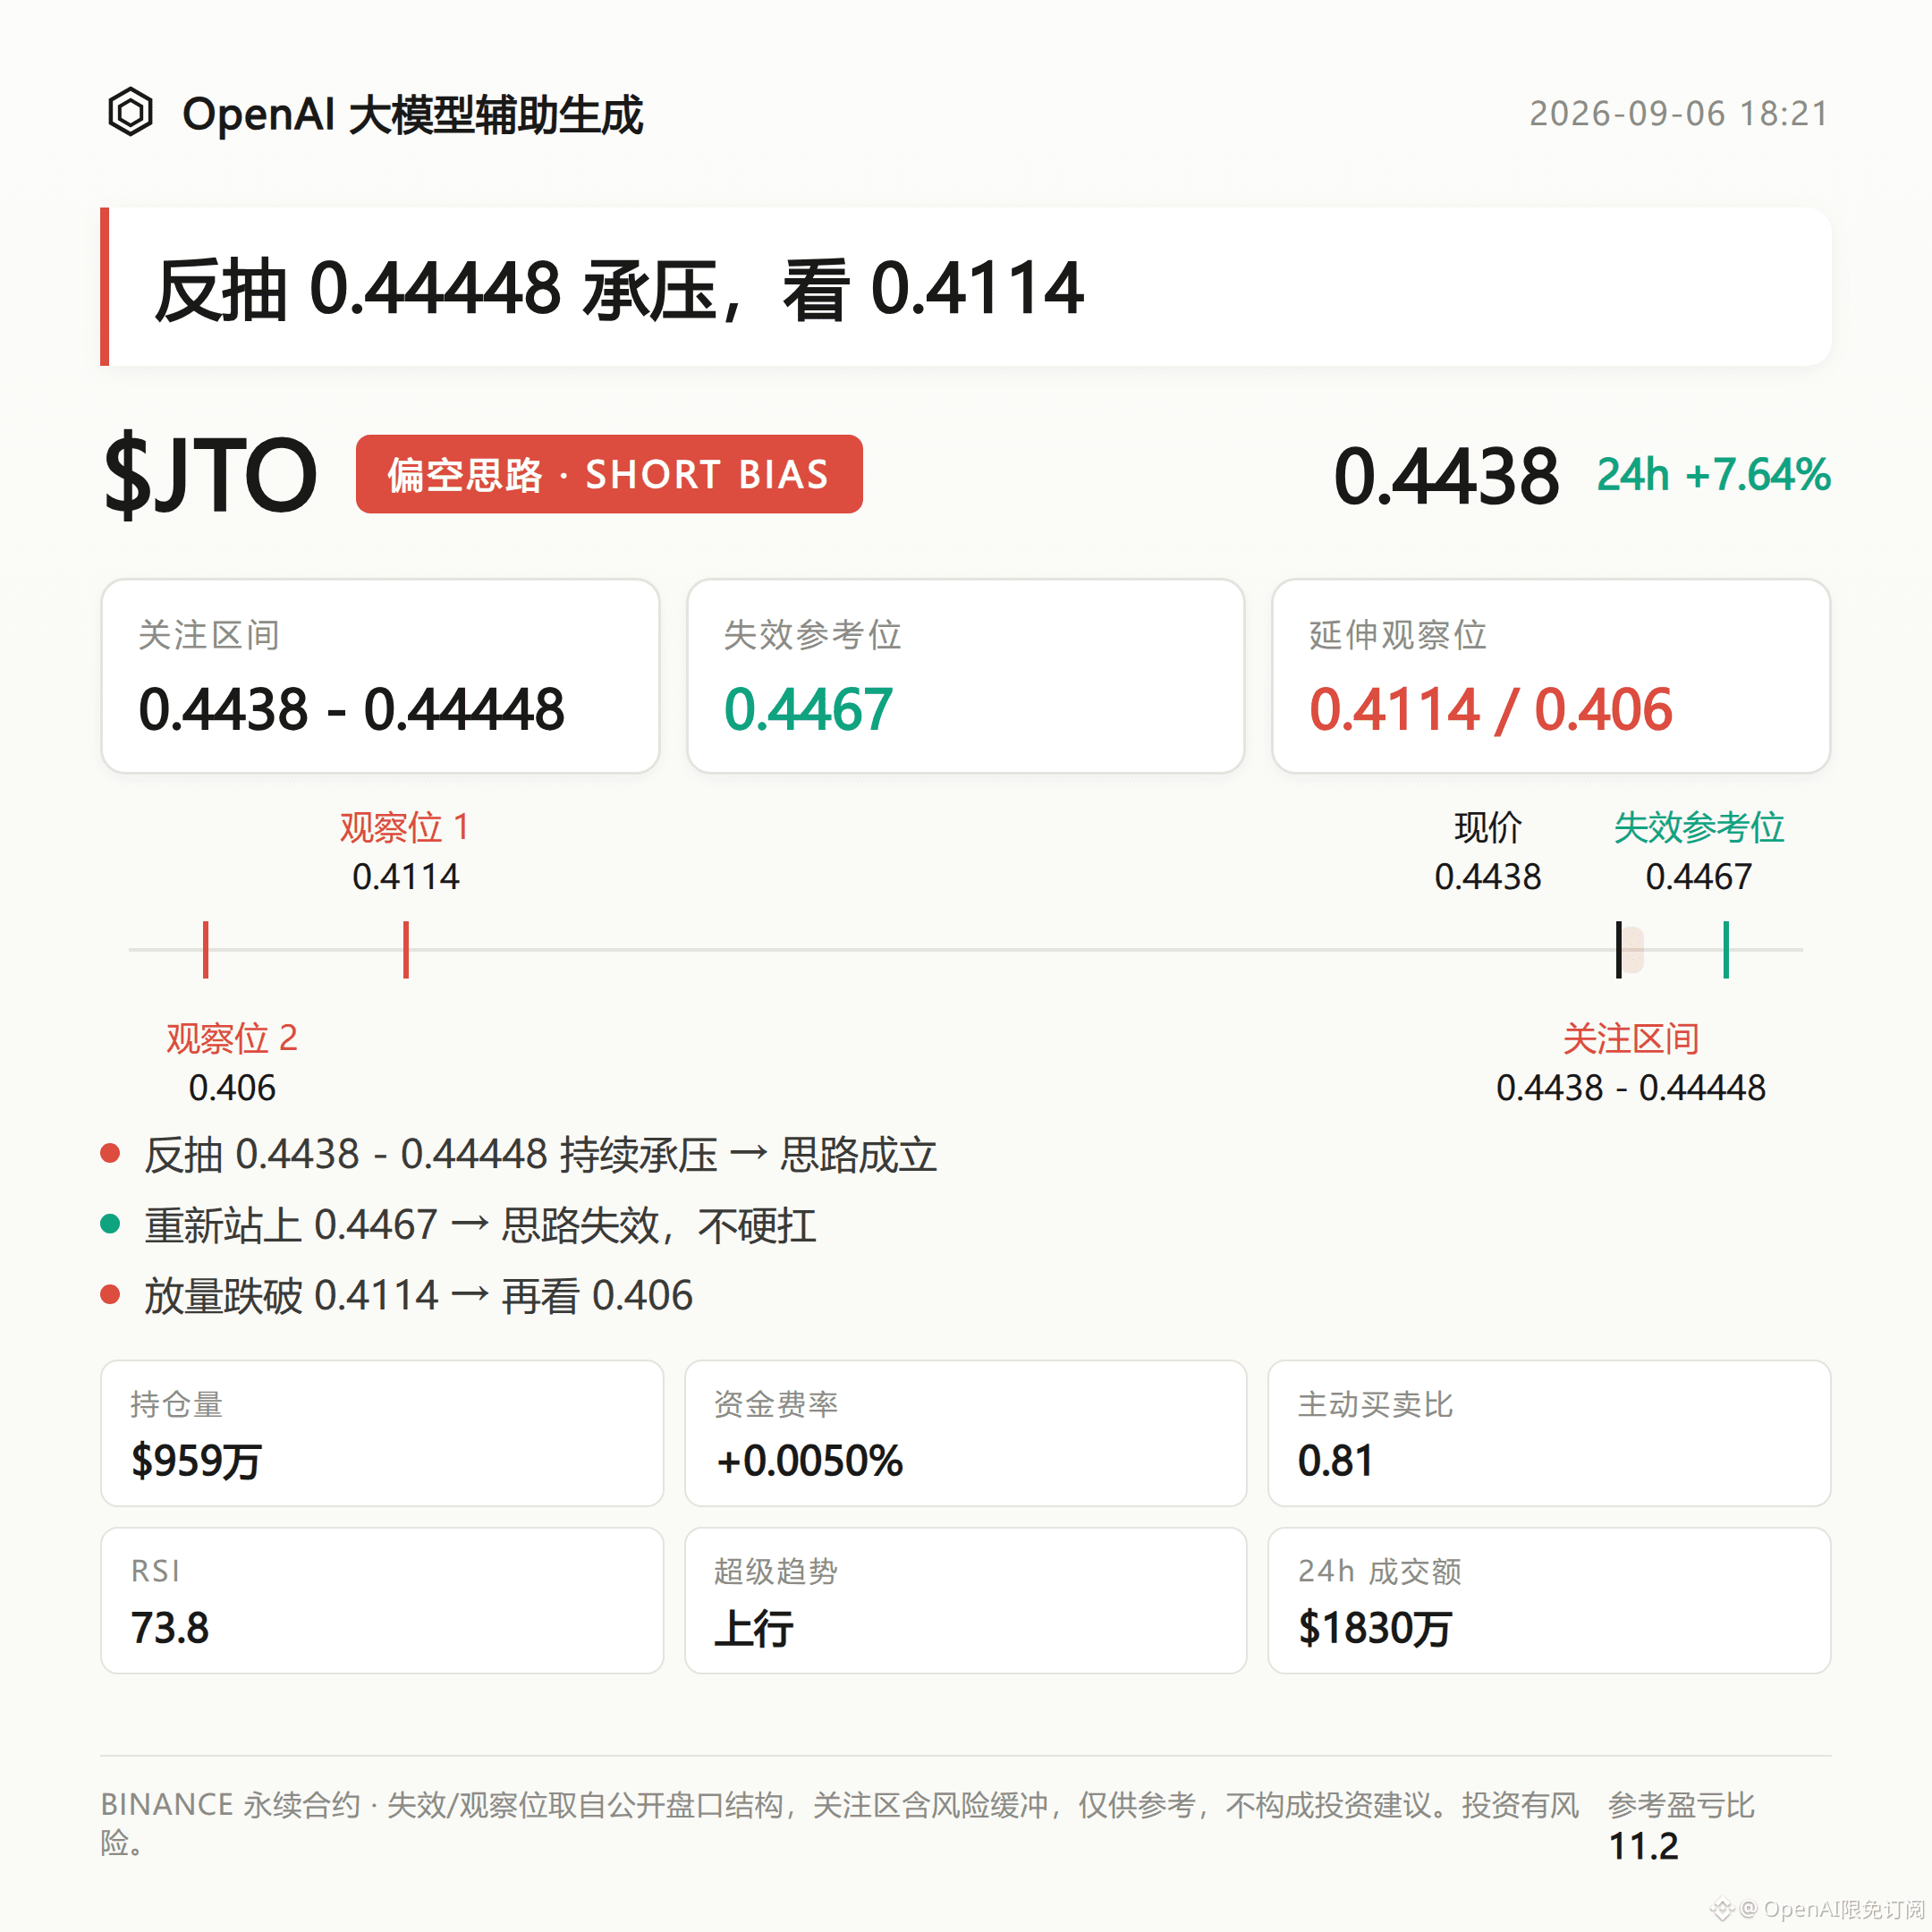
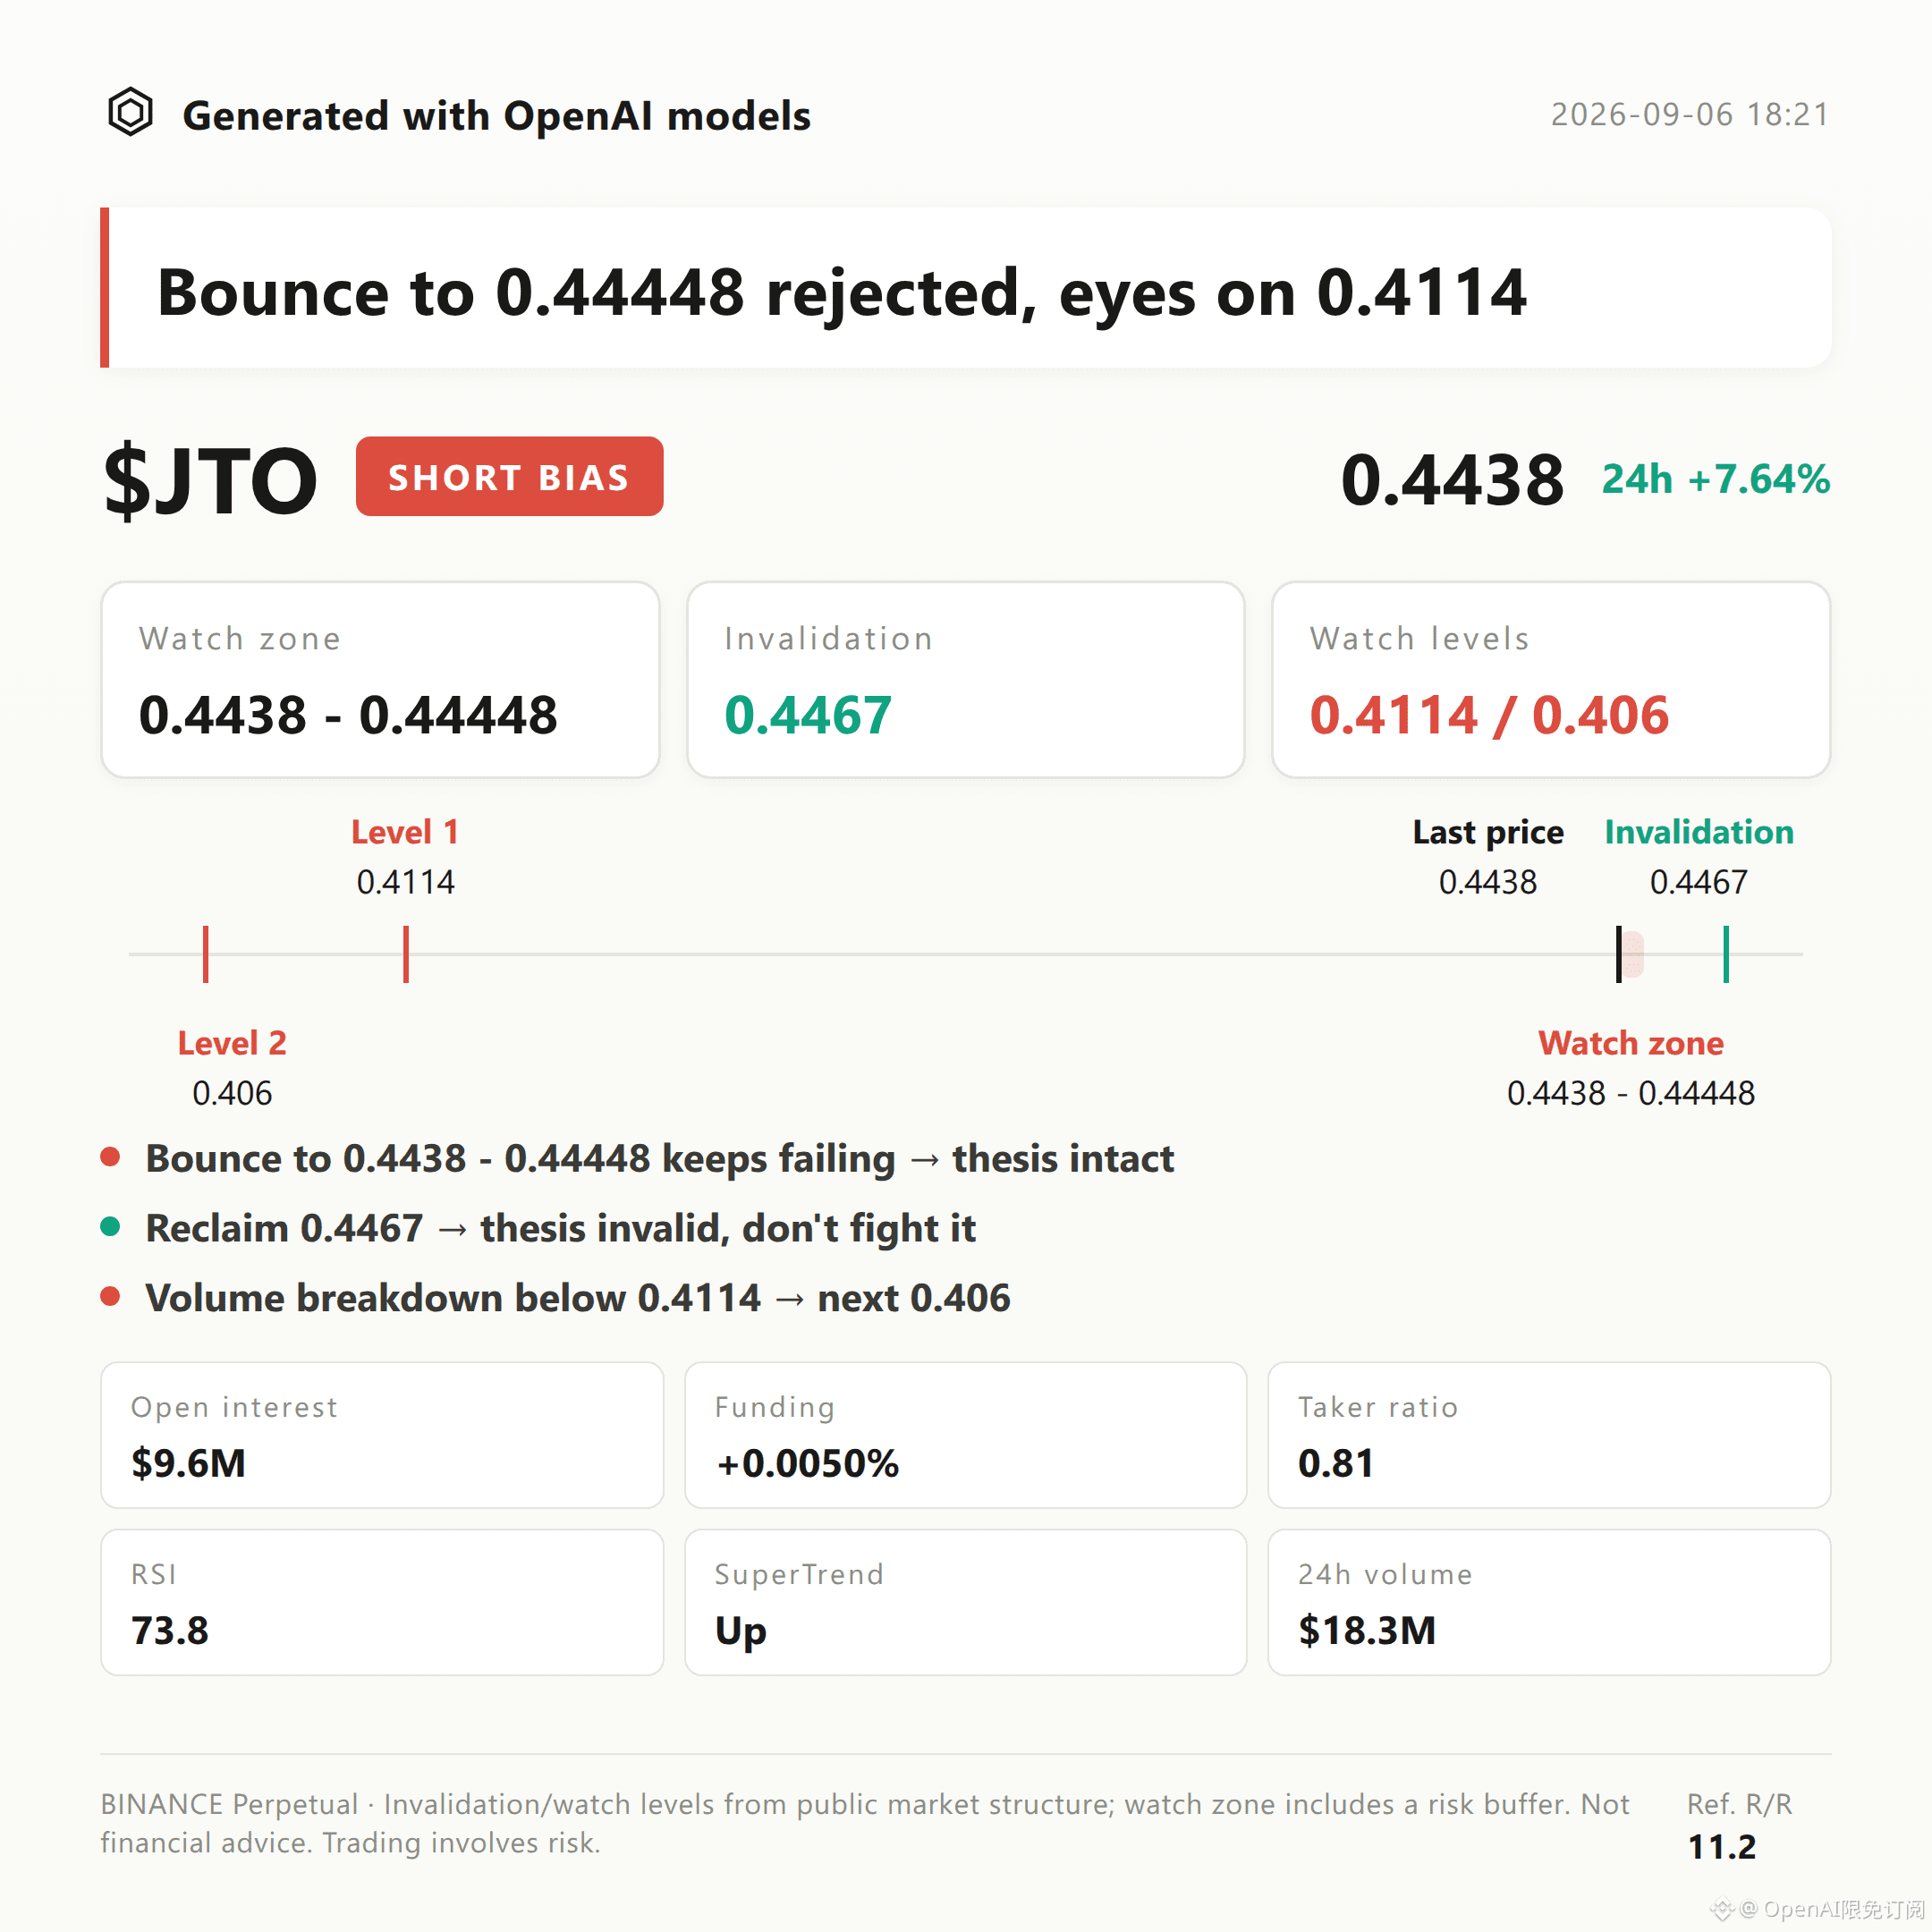
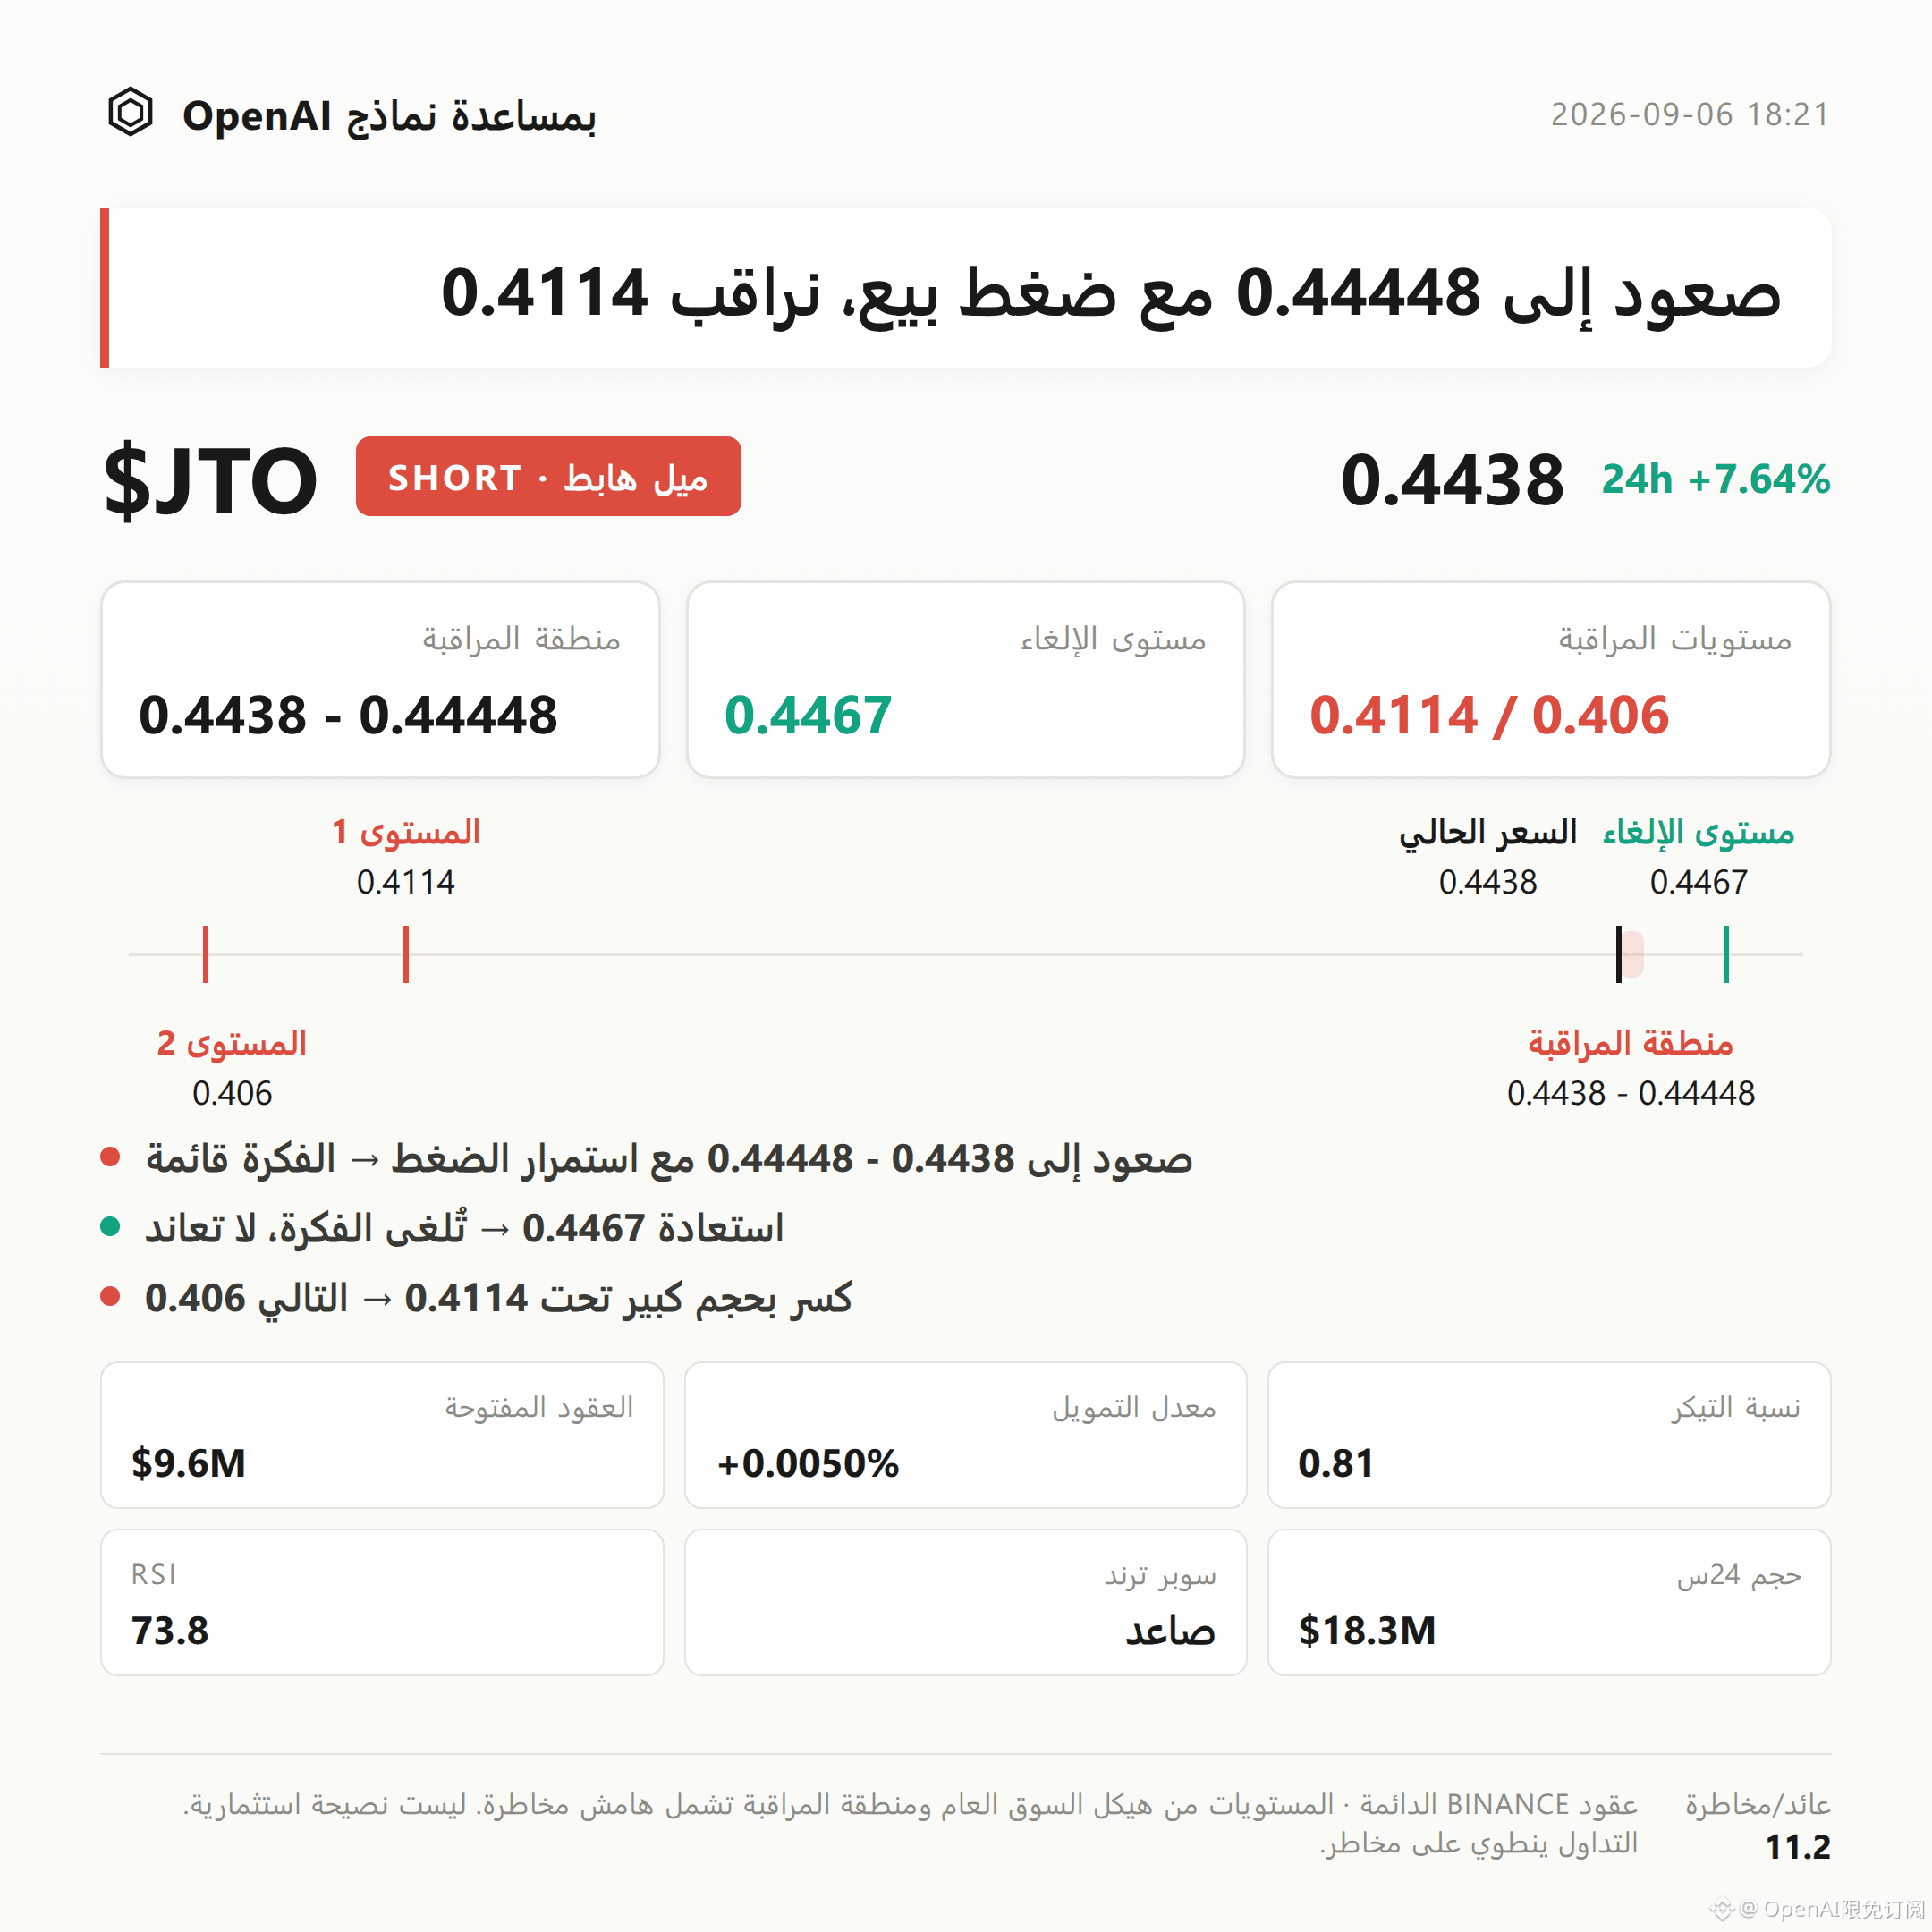
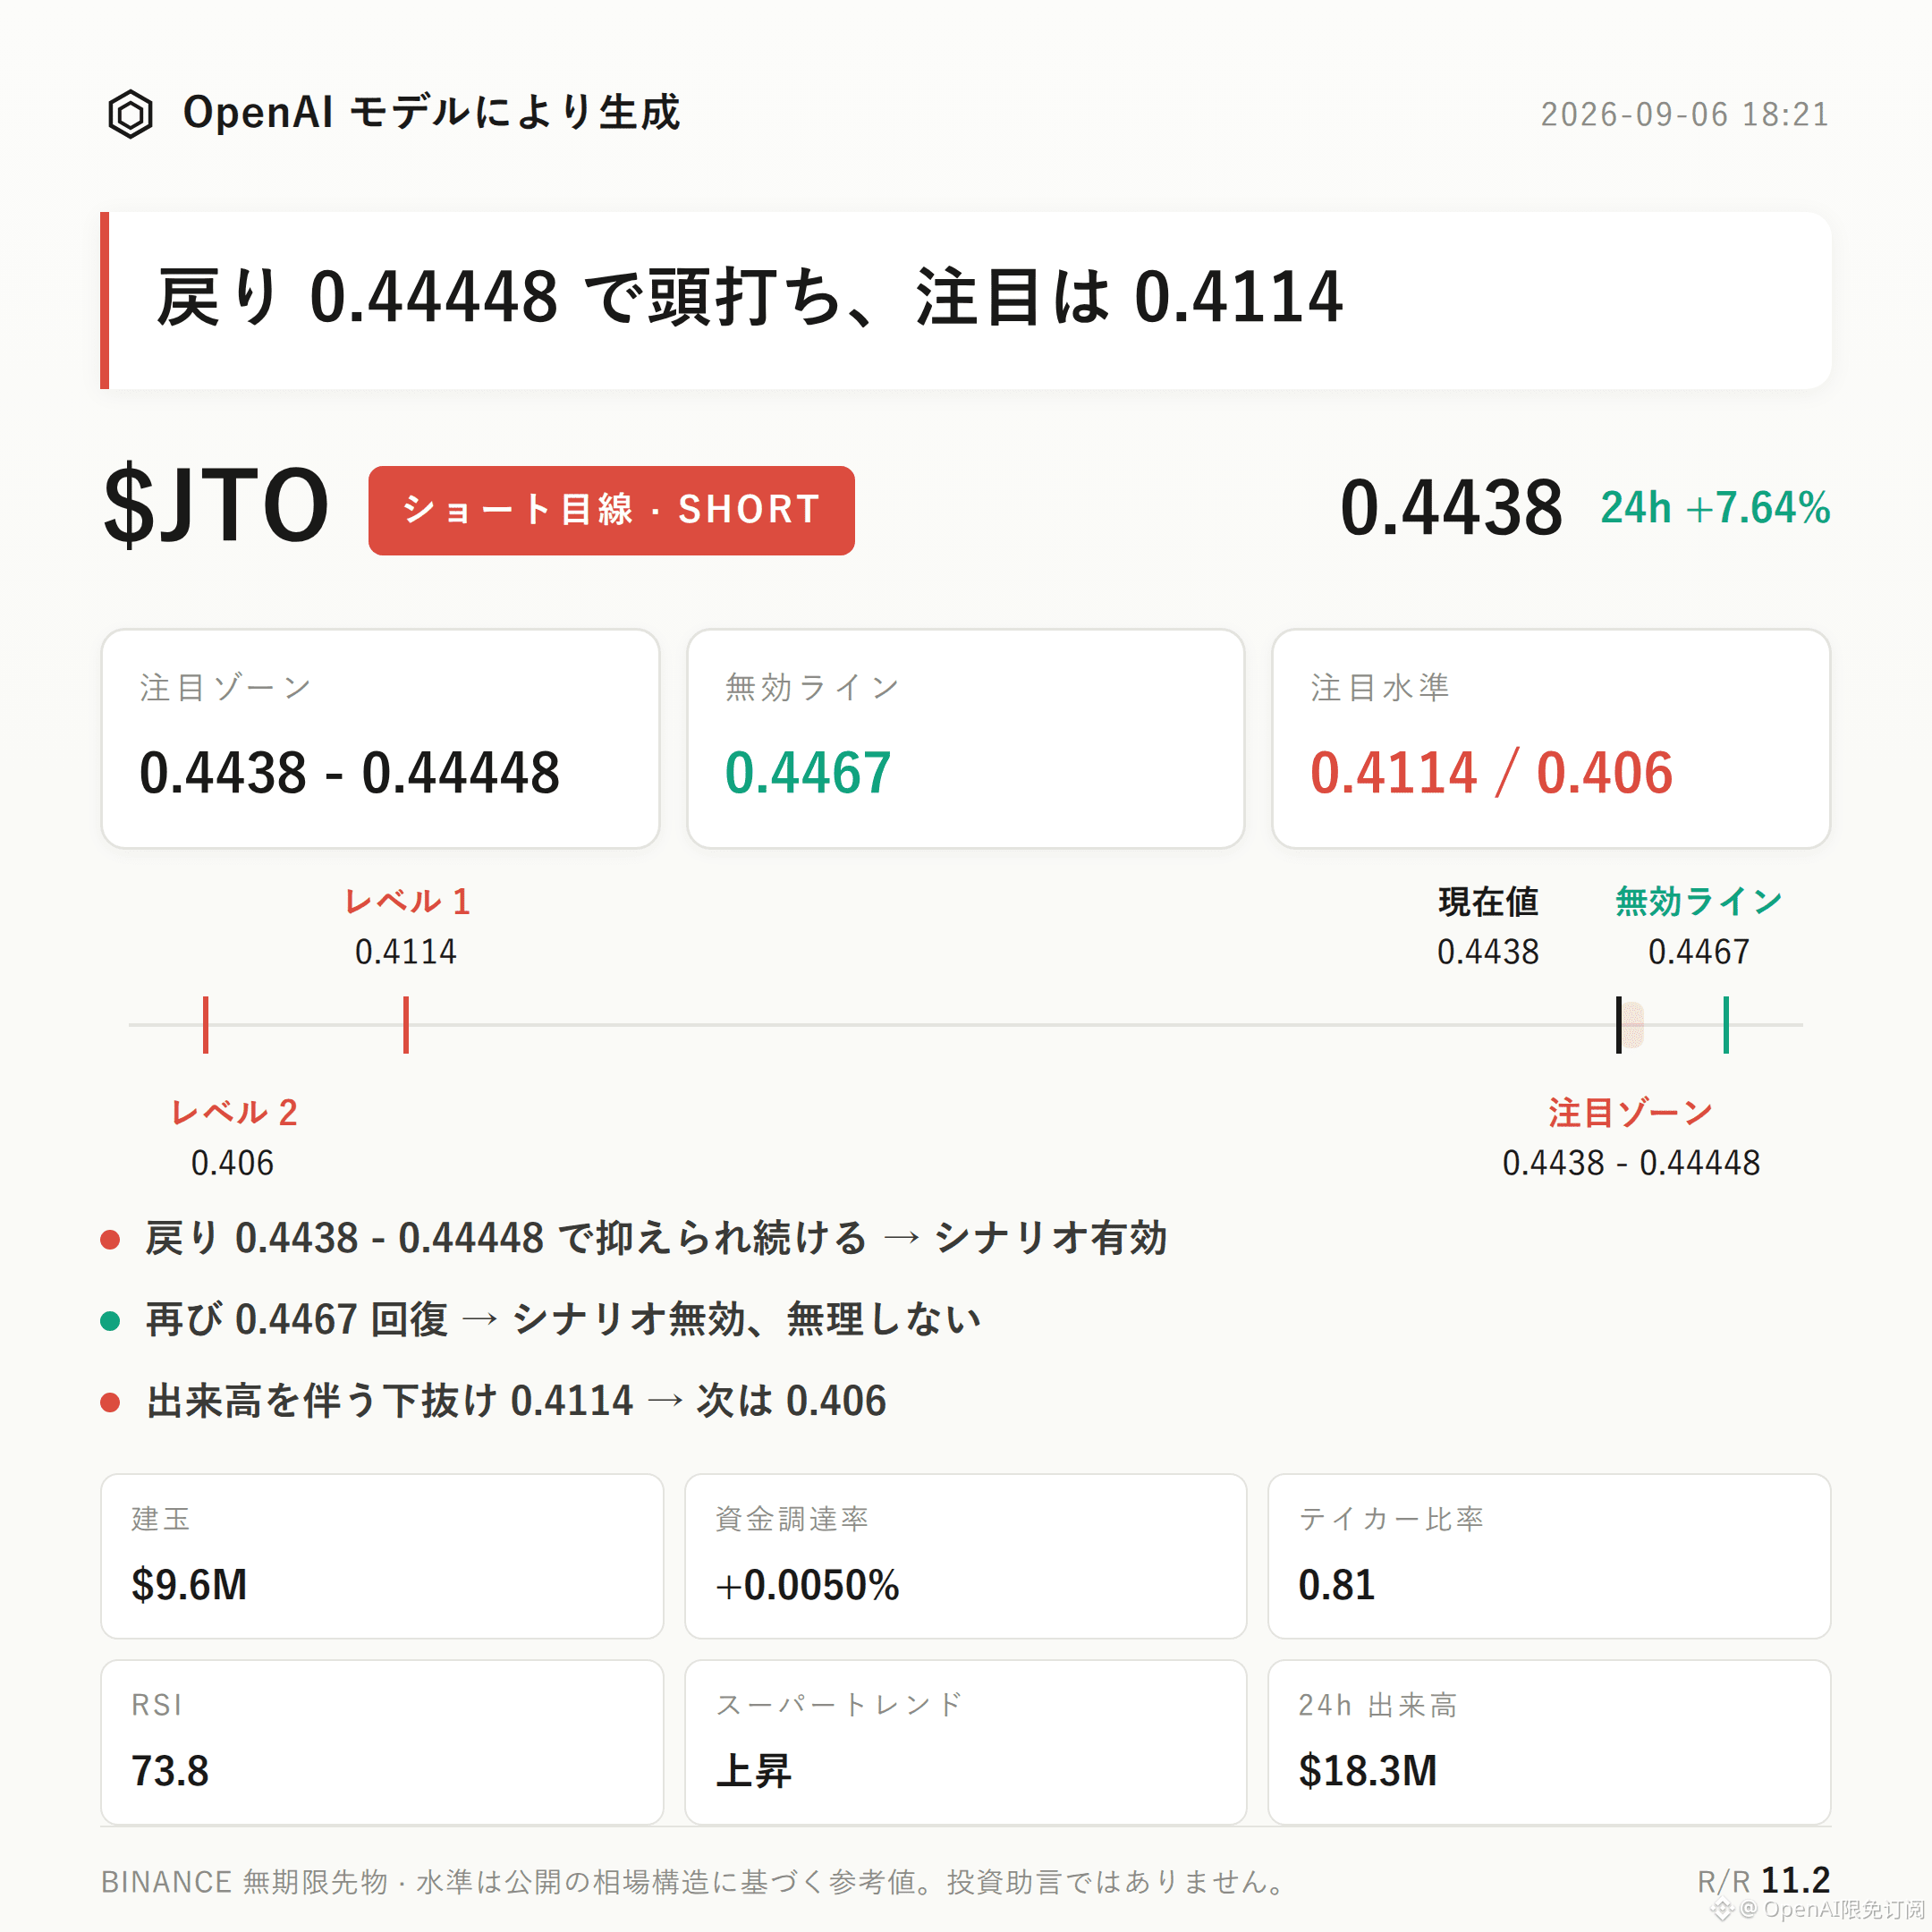
$JTO bearish bias | Watch zone 0.4438 - 0.44448 | Invalid reference 0.4467 | Observation levels 0.4114 / 0.406
$JTO current bearish structure is in play.
The key points are: the active buy/sell ratio is 0.81, with active selling in the lead; RSI has reached 73.8, entering the overbought zone; while price is approaching the previous high at 0.4467, open interest has risen counter-trend by 11.9% over 24 hours, suggesting the newly added positions are more likely short positions being absorbed at higher levels rather than position buildup for trend continuation.
The key is to see whether the rebound can be held down in the resistance zone; this is the core test of whether this bearish idea holds.
From a structural perspective, the recent high is 0.4467, the low is 0.4114, and the current price at 0.4438 is already close to the upper Bollinger Band at 0.4464.
The Bollinger middle band is 0.4262 and the lower band is 0.406, showing price is trading significantly above the middle band.
RSI at 73.8 is in the overbought zone, creating a pullback risk.
However, MACD still shows bullish momentum, and the Supertrend indicator is also still rising, indicating the trend itself has not been damaged. At this stage, this looks more like an overbought signal within a strong structure rather than confirmation of a reversal, and that should be stated honestly.
On derivatives data, 24-hour trading volume is $18.3 million, open interest is $9.59 million, and it increased by 11.9% over 24 hours, meaning positions are building quickly as price rises.
The funding rate is +0.0050%, so longs still have a slight edge, but not by much.
In terms of long/short account ratio, long accounts account for 43%, so this is not an overly one-sided crowded structure.
The active buy/sell ratio of 0.81 shows active selling is slightly dominant, which diverges somewhat from the 24-hour gain of +7.64% and is worth noting.
As for reference levels, the bearish watch zone is 0.4438 - 0.44448, and it is better to wait for confirmation after rebound pressure appears rather than drawing conclusions as soon as price reaches it.
If the price rebounds into the watch zone and then shows signs of stagnation or pressure, the bearish structure can continue to be observed under the original logic; if price reclaims 0.4467, then the current pullback structure is broken and the bearish idea should be considered invalid and no longer applied.
On the downside, the observation level is 0.4114; if that breaks with volume, look next to support around 0.406, which corresponds to the lower Bollinger Band.
The reference risk/reward ratio is 11.2; this ratio is for structural reference only and does not constitute a promise of returns.
Disclosure: there is currently no significant opposite signal. The bullish momentum in MACD and the upward Supertrend still support the original bullish structure. Overbought does not mean reversal, and a retest of the watch zone may simply be a short consolidation before further upside.
The leverage feature of contracts is the main source of risk; the market may move opposite to expectations at any point.
Under contract leverage, position discipline is more important than directional judgment.
Live position disclosure: this account currently holds a long position of $FOGO , and structurally remains bullish; the view is aligned with the position.
For reference only, not investment advice. Contracts involve leverage; investing carries risk.
This article
$JTO bearish bias | Watch zone 0.4438 - 0.44448 | Invalid reference 0.4467 | Observation levels 0.4114 / 0.406
$JTO current bearish structure is in play.
The key points are: the active buy/sell ratio is 0.81, with active selling in the lead; RSI has reached 73.8, entering the overbought zone; while price is approaching the previous high at 0.4467, open interest has risen counter-trend by 11.9% over 24 hours, suggesting the newly added positions are more likely short positions being absorbed at higher levels rather than position buildup for trend continuation.
The key is to see whether the rebound can be held down in the resistance zone; this is the core test of whether this bearish idea holds.
From a structural perspective, the recent high is 0.4467, the low is 0.4114, and the current price at 0.4438 is already close to the upper Bollinger Band at 0.4464.
The Bollinger middle band is 0.4262 and the lower band is 0.406, showing price is trading significantly above the middle band.
RSI at 73.8 is in the overbought zone, creating a pullback risk.
However, MACD still shows bullish momentum, and the Supertrend indicator is also still rising, indicating the trend itself has not been damaged. At this stage, this looks more like an overbought signal within a strong structure rather than confirmation of a reversal, and that should be stated honestly.
On derivatives data, 24-hour trading volume is $18.3 million, open interest is $9.59 million, and it increased by 11.9% over 24 hours, meaning positions are building quickly as price rises.
The funding rate is +0.0050%, so longs still have a slight edge, but not by much.
In terms of long/short account ratio, long accounts account for 43%, so this is not an overly one-sided crowded structure.
The active buy/sell ratio of 0.81 shows active selling is slightly dominant, which diverges somewhat from the 24-hour gain of +7.64% and is worth noting.
As for reference levels, the bearish watch zone is 0.4438 - 0.44448, and it is better to wait for confirmation after rebound pressure appears rather than drawing conclusions as soon as price reaches it.
If the price rebounds into the watch zone and then shows signs of stagnation or pressure, the bearish structure can continue to be observed under the original logic; if price reclaims 0.4467, then the current pullback structure is broken and the bearish idea should be considered invalid and no longer applied.
On the downside, the observation level is 0.4114; if that breaks with volume, look next to support around 0.406, which corresponds to the lower Bollinger Band.
The reference risk/reward ratio is 11.2; this ratio is for structural reference only and does not constitute a promise of returns.
Disclosure: there is currently no significant opposite signal. The bullish momentum in MACD and the upward Supertrend still support the original bullish structure. Overbought does not mean reversal, and a retest of the watch zone may simply be a short consolidation before further upside.
The leverage feature of contracts is the main source of risk; the market may move opposite to expectations at any point.
Under contract leverage, position discipline is more important than directional judgment.
Live position disclosure: this account currently holds a long position of $FOGO , and structurally remains bullish; the view is aligned with the position.
For reference only, not investment advice. Contracts involve leverage; investing carries risk.
This article