Grok Market Quick Review | 9/6 17:46
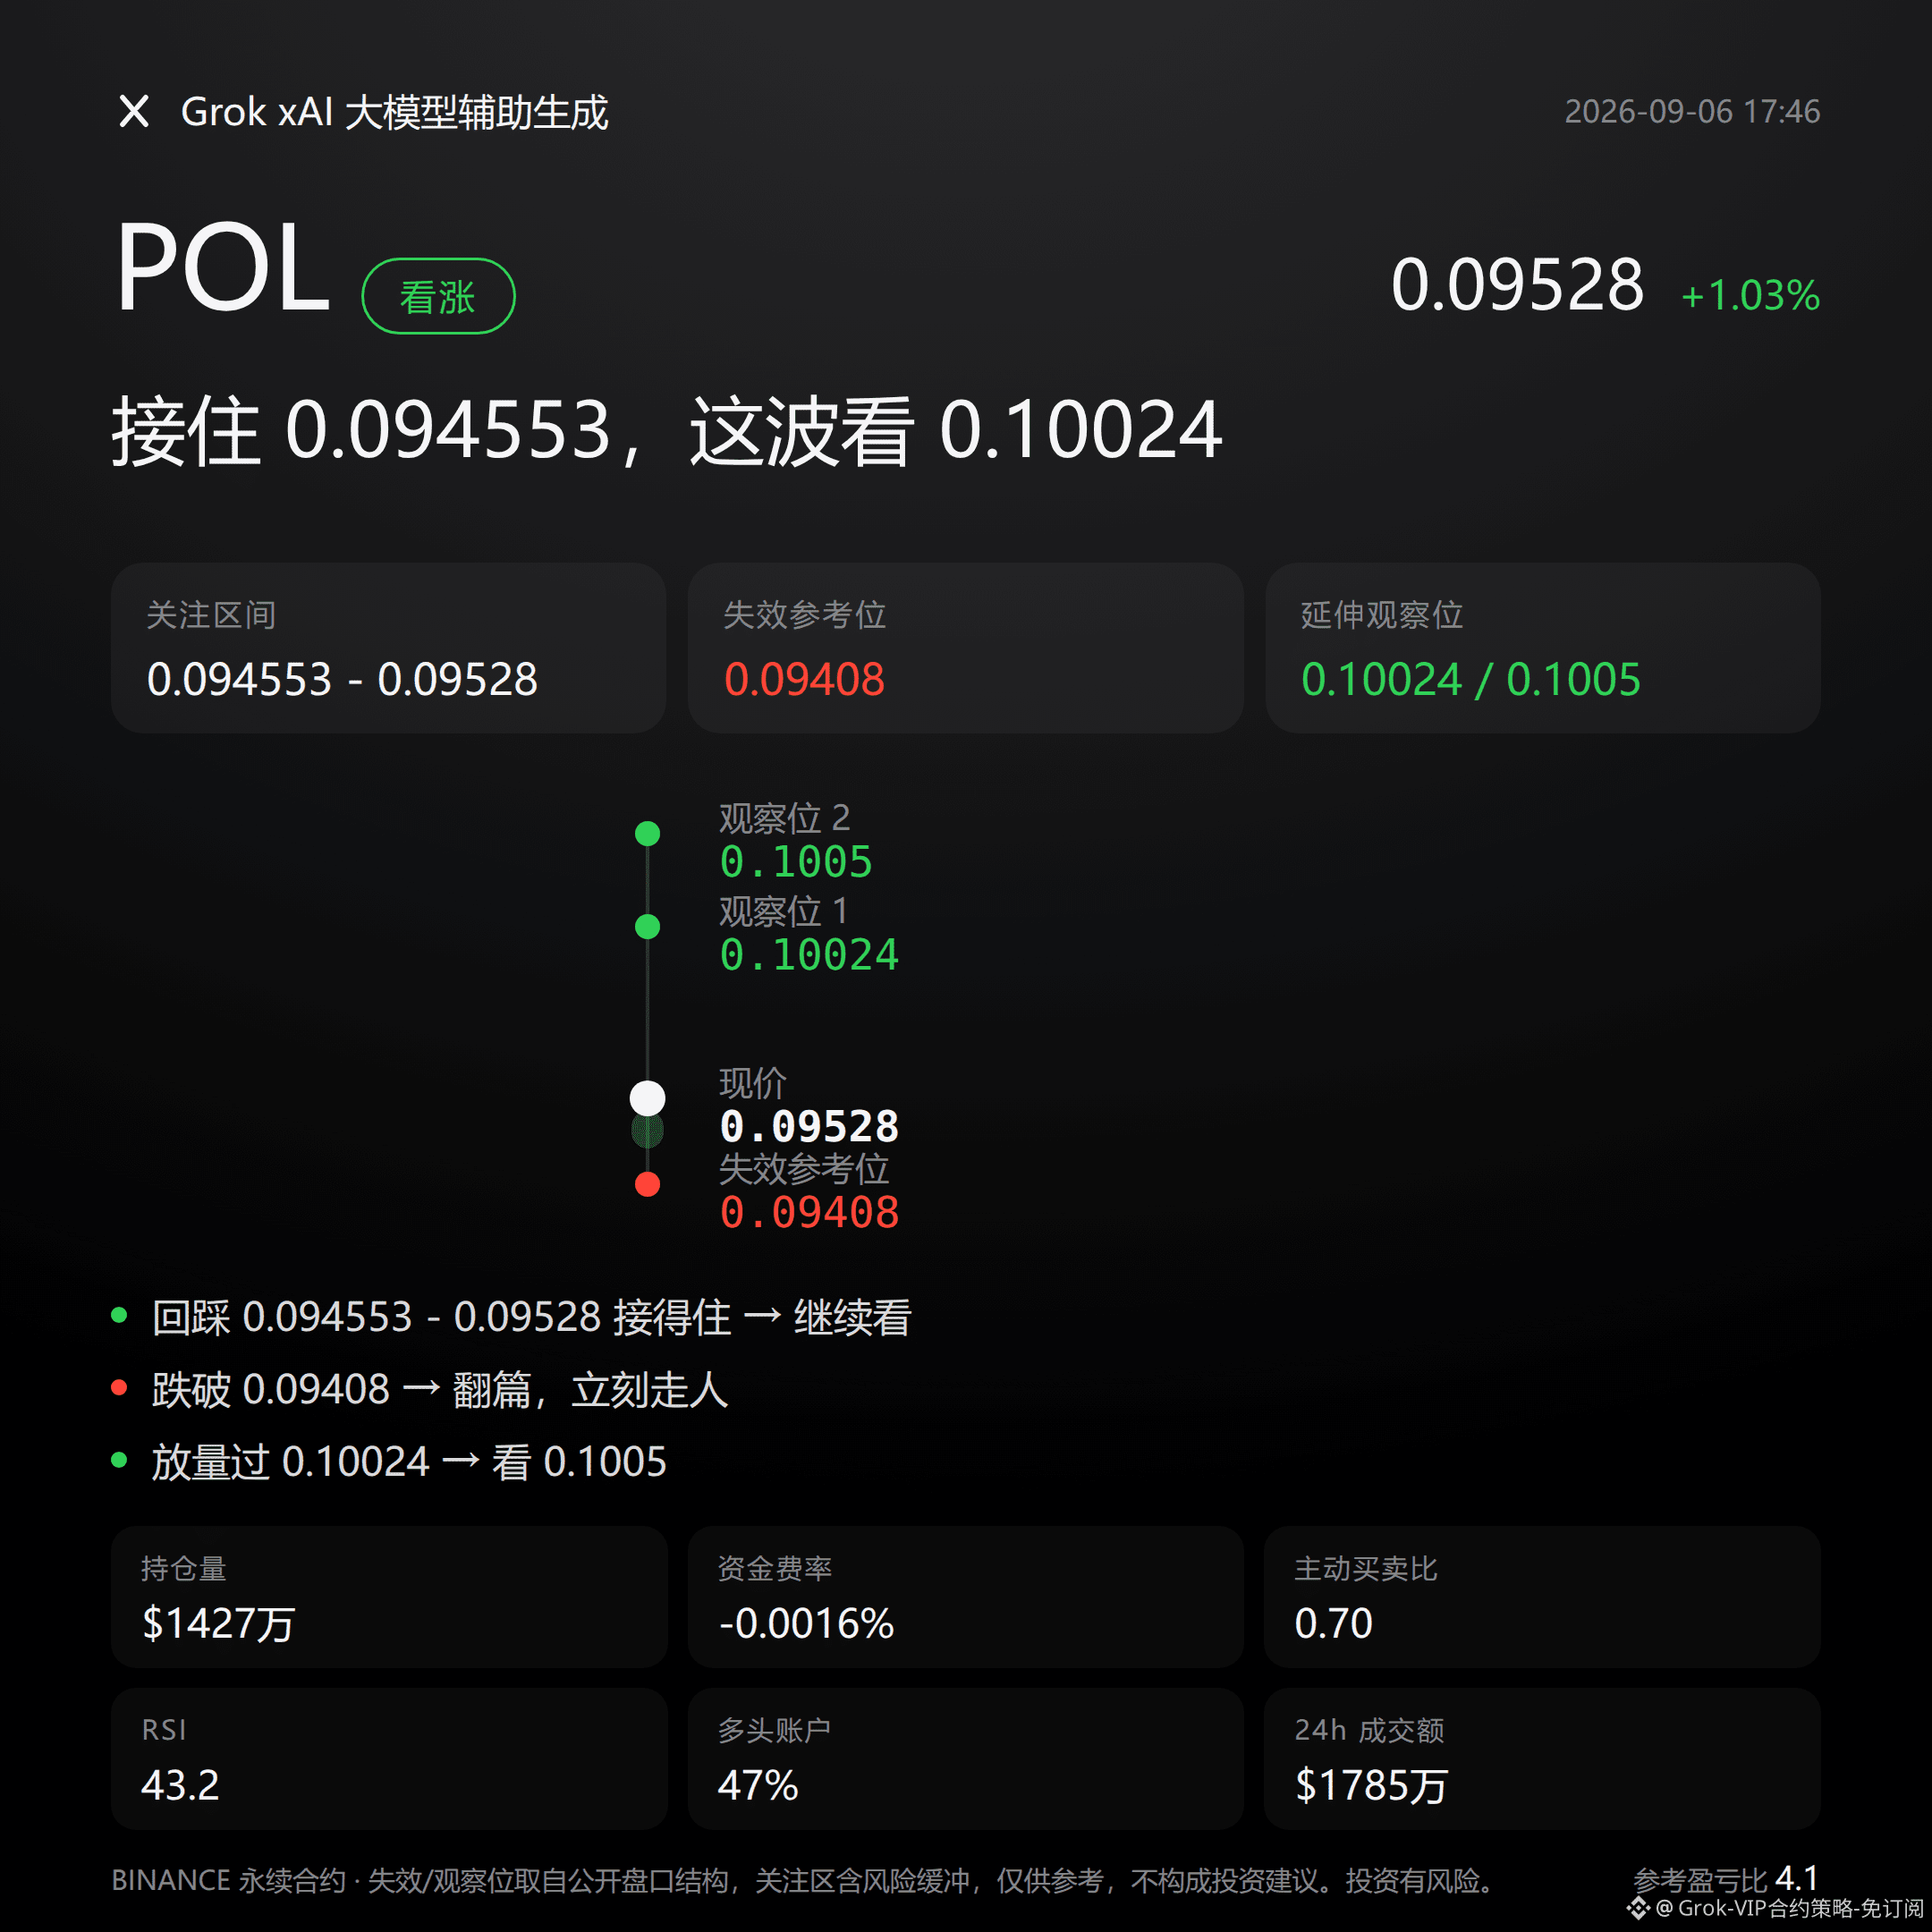
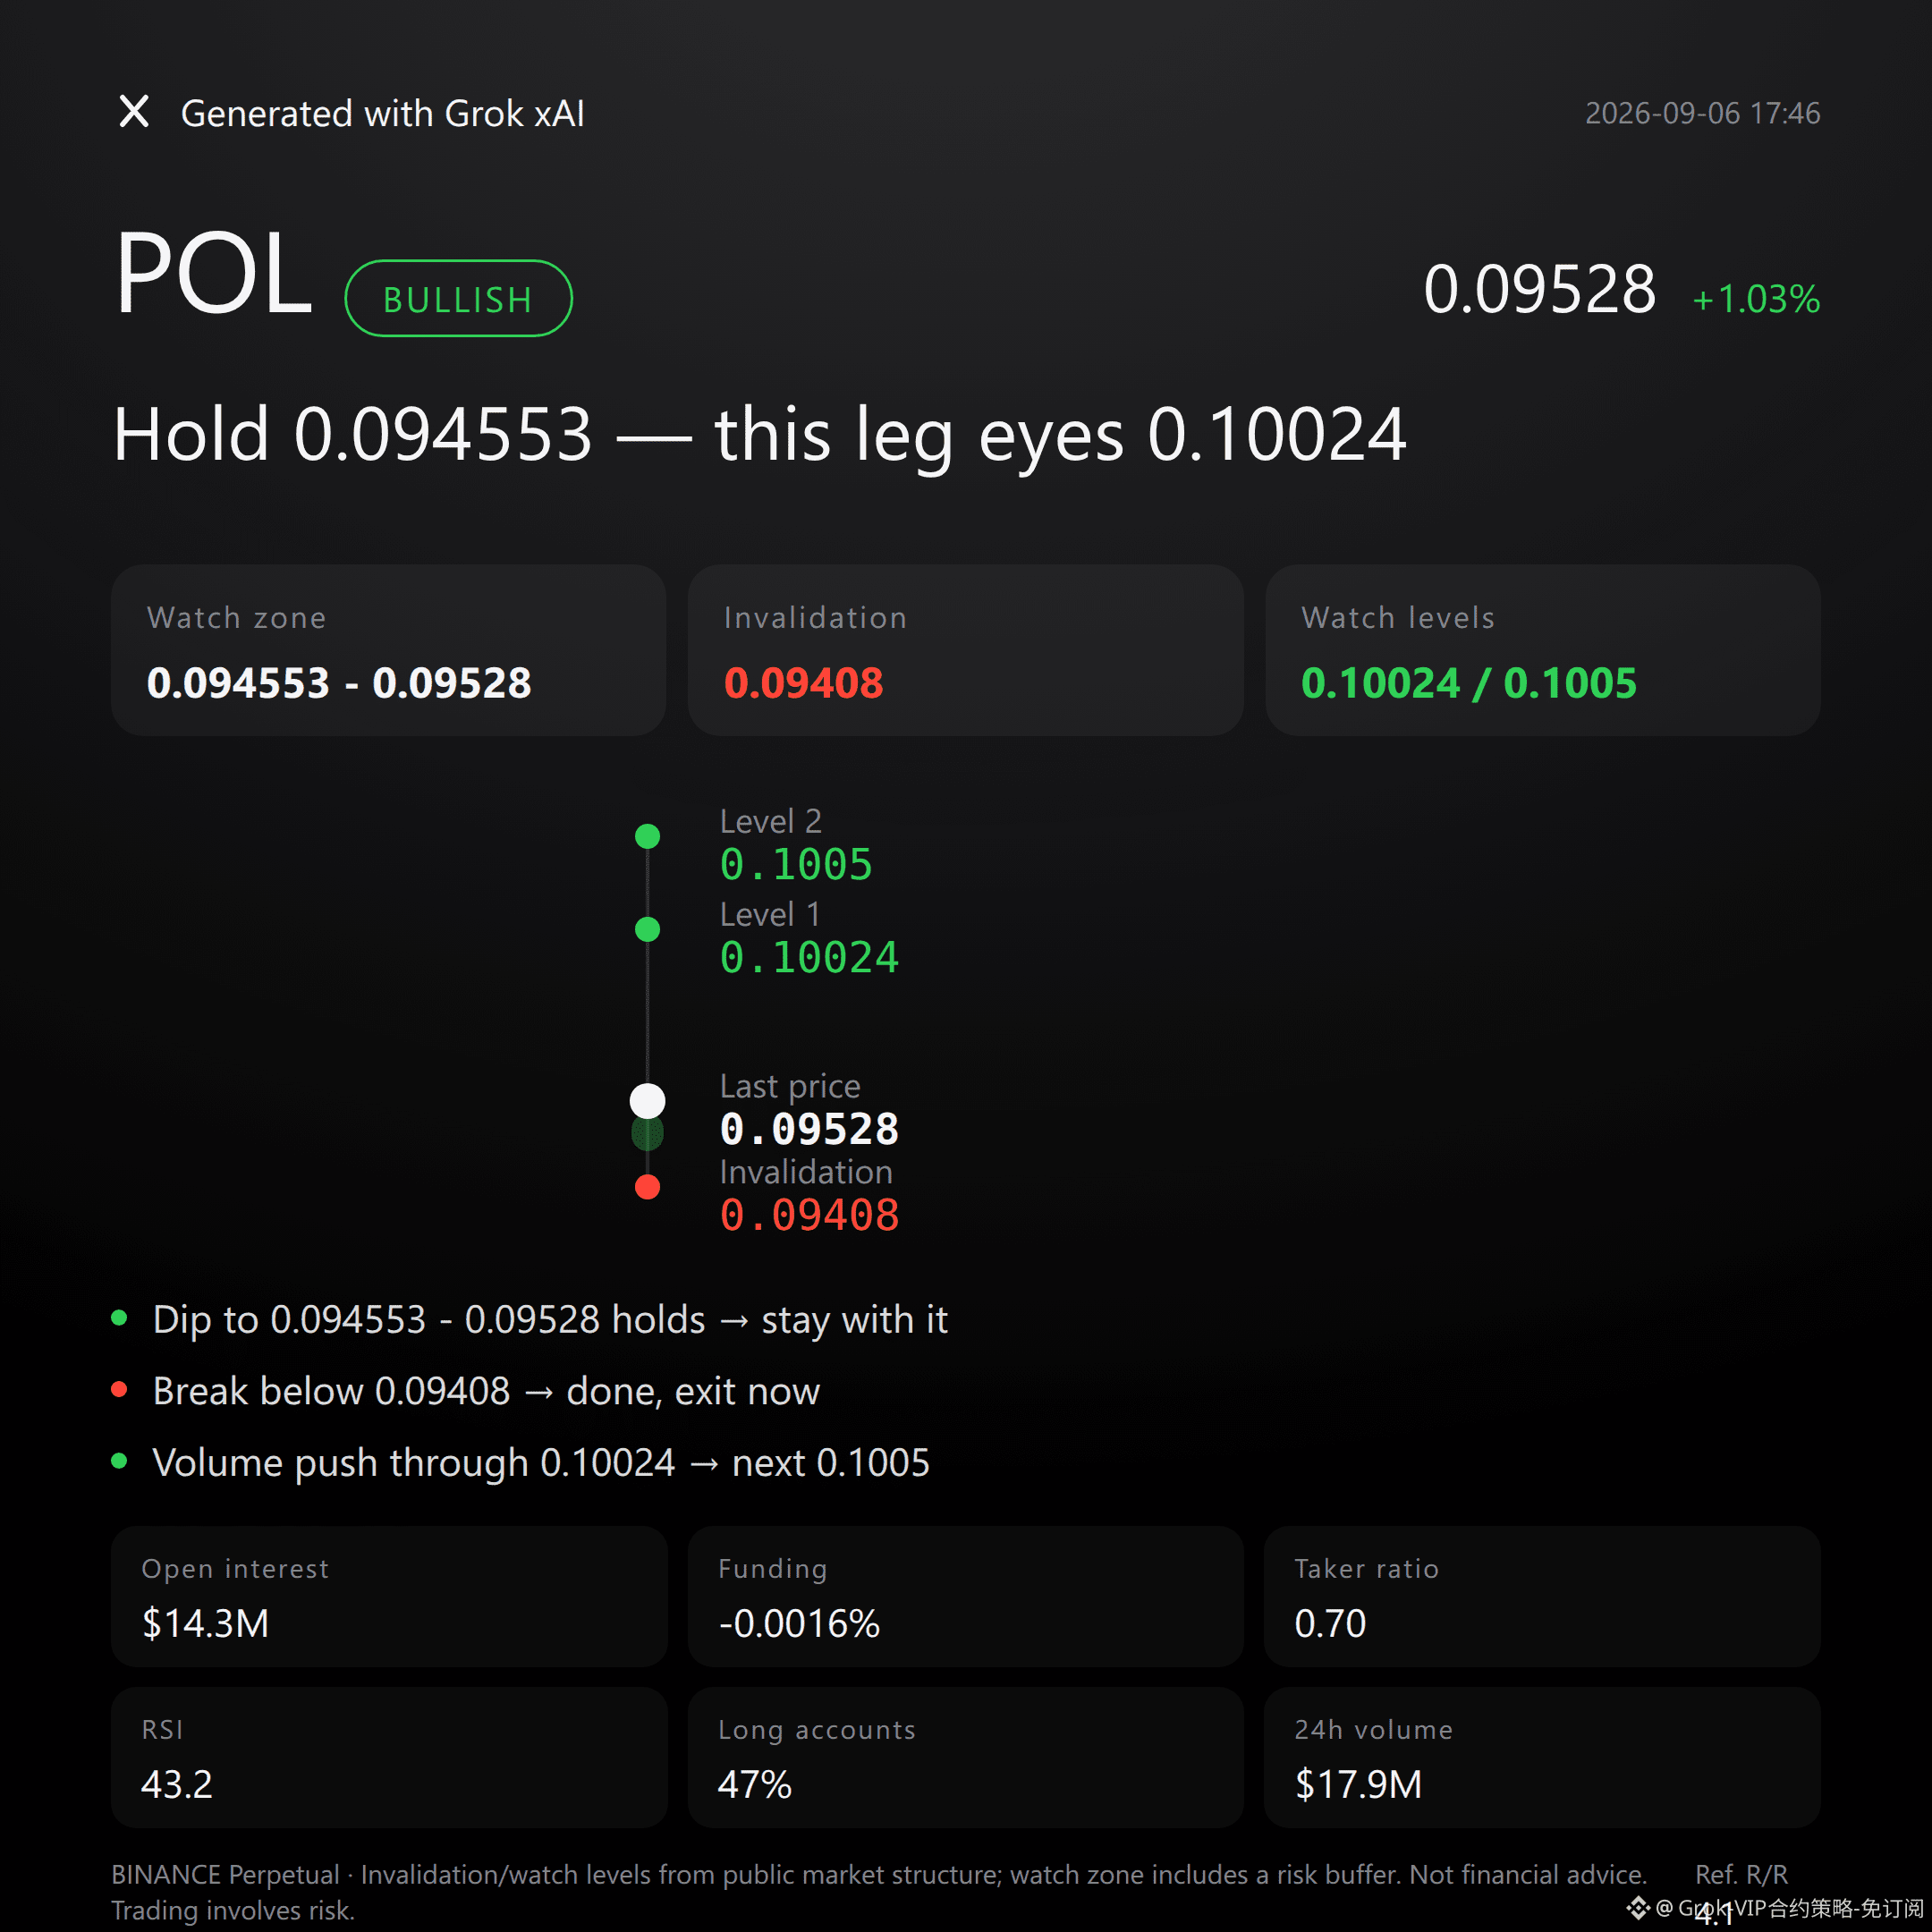
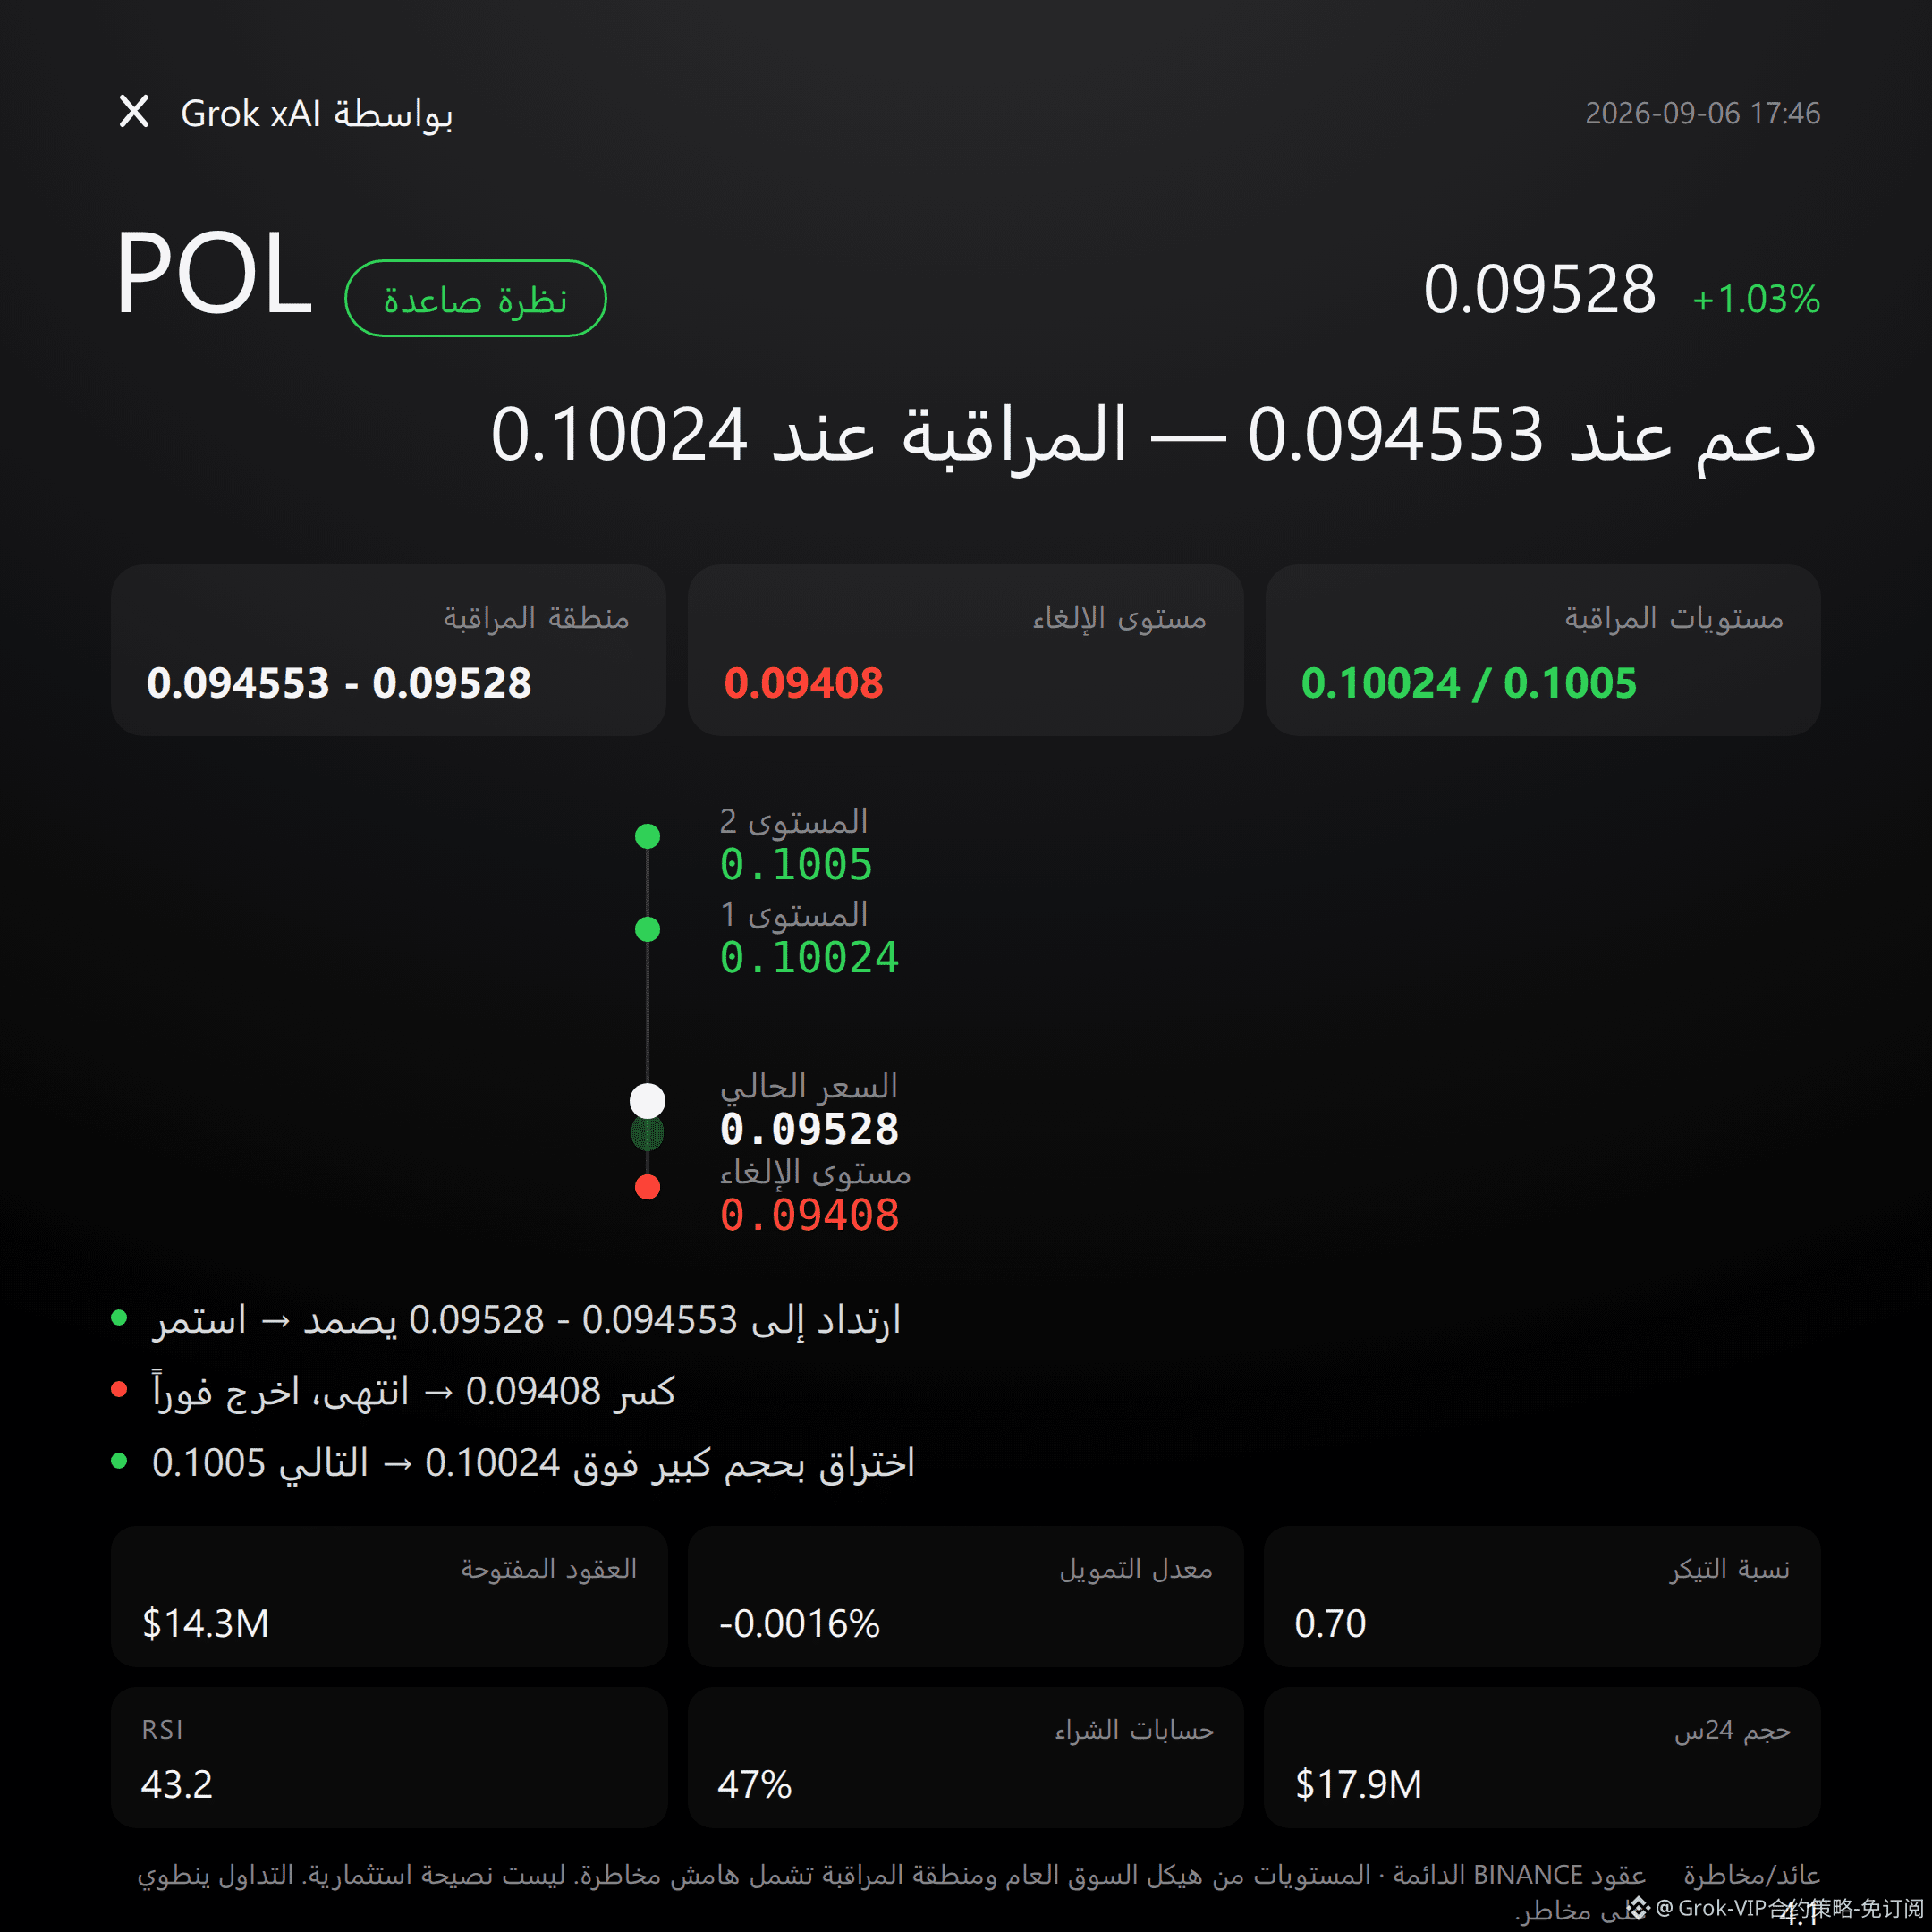
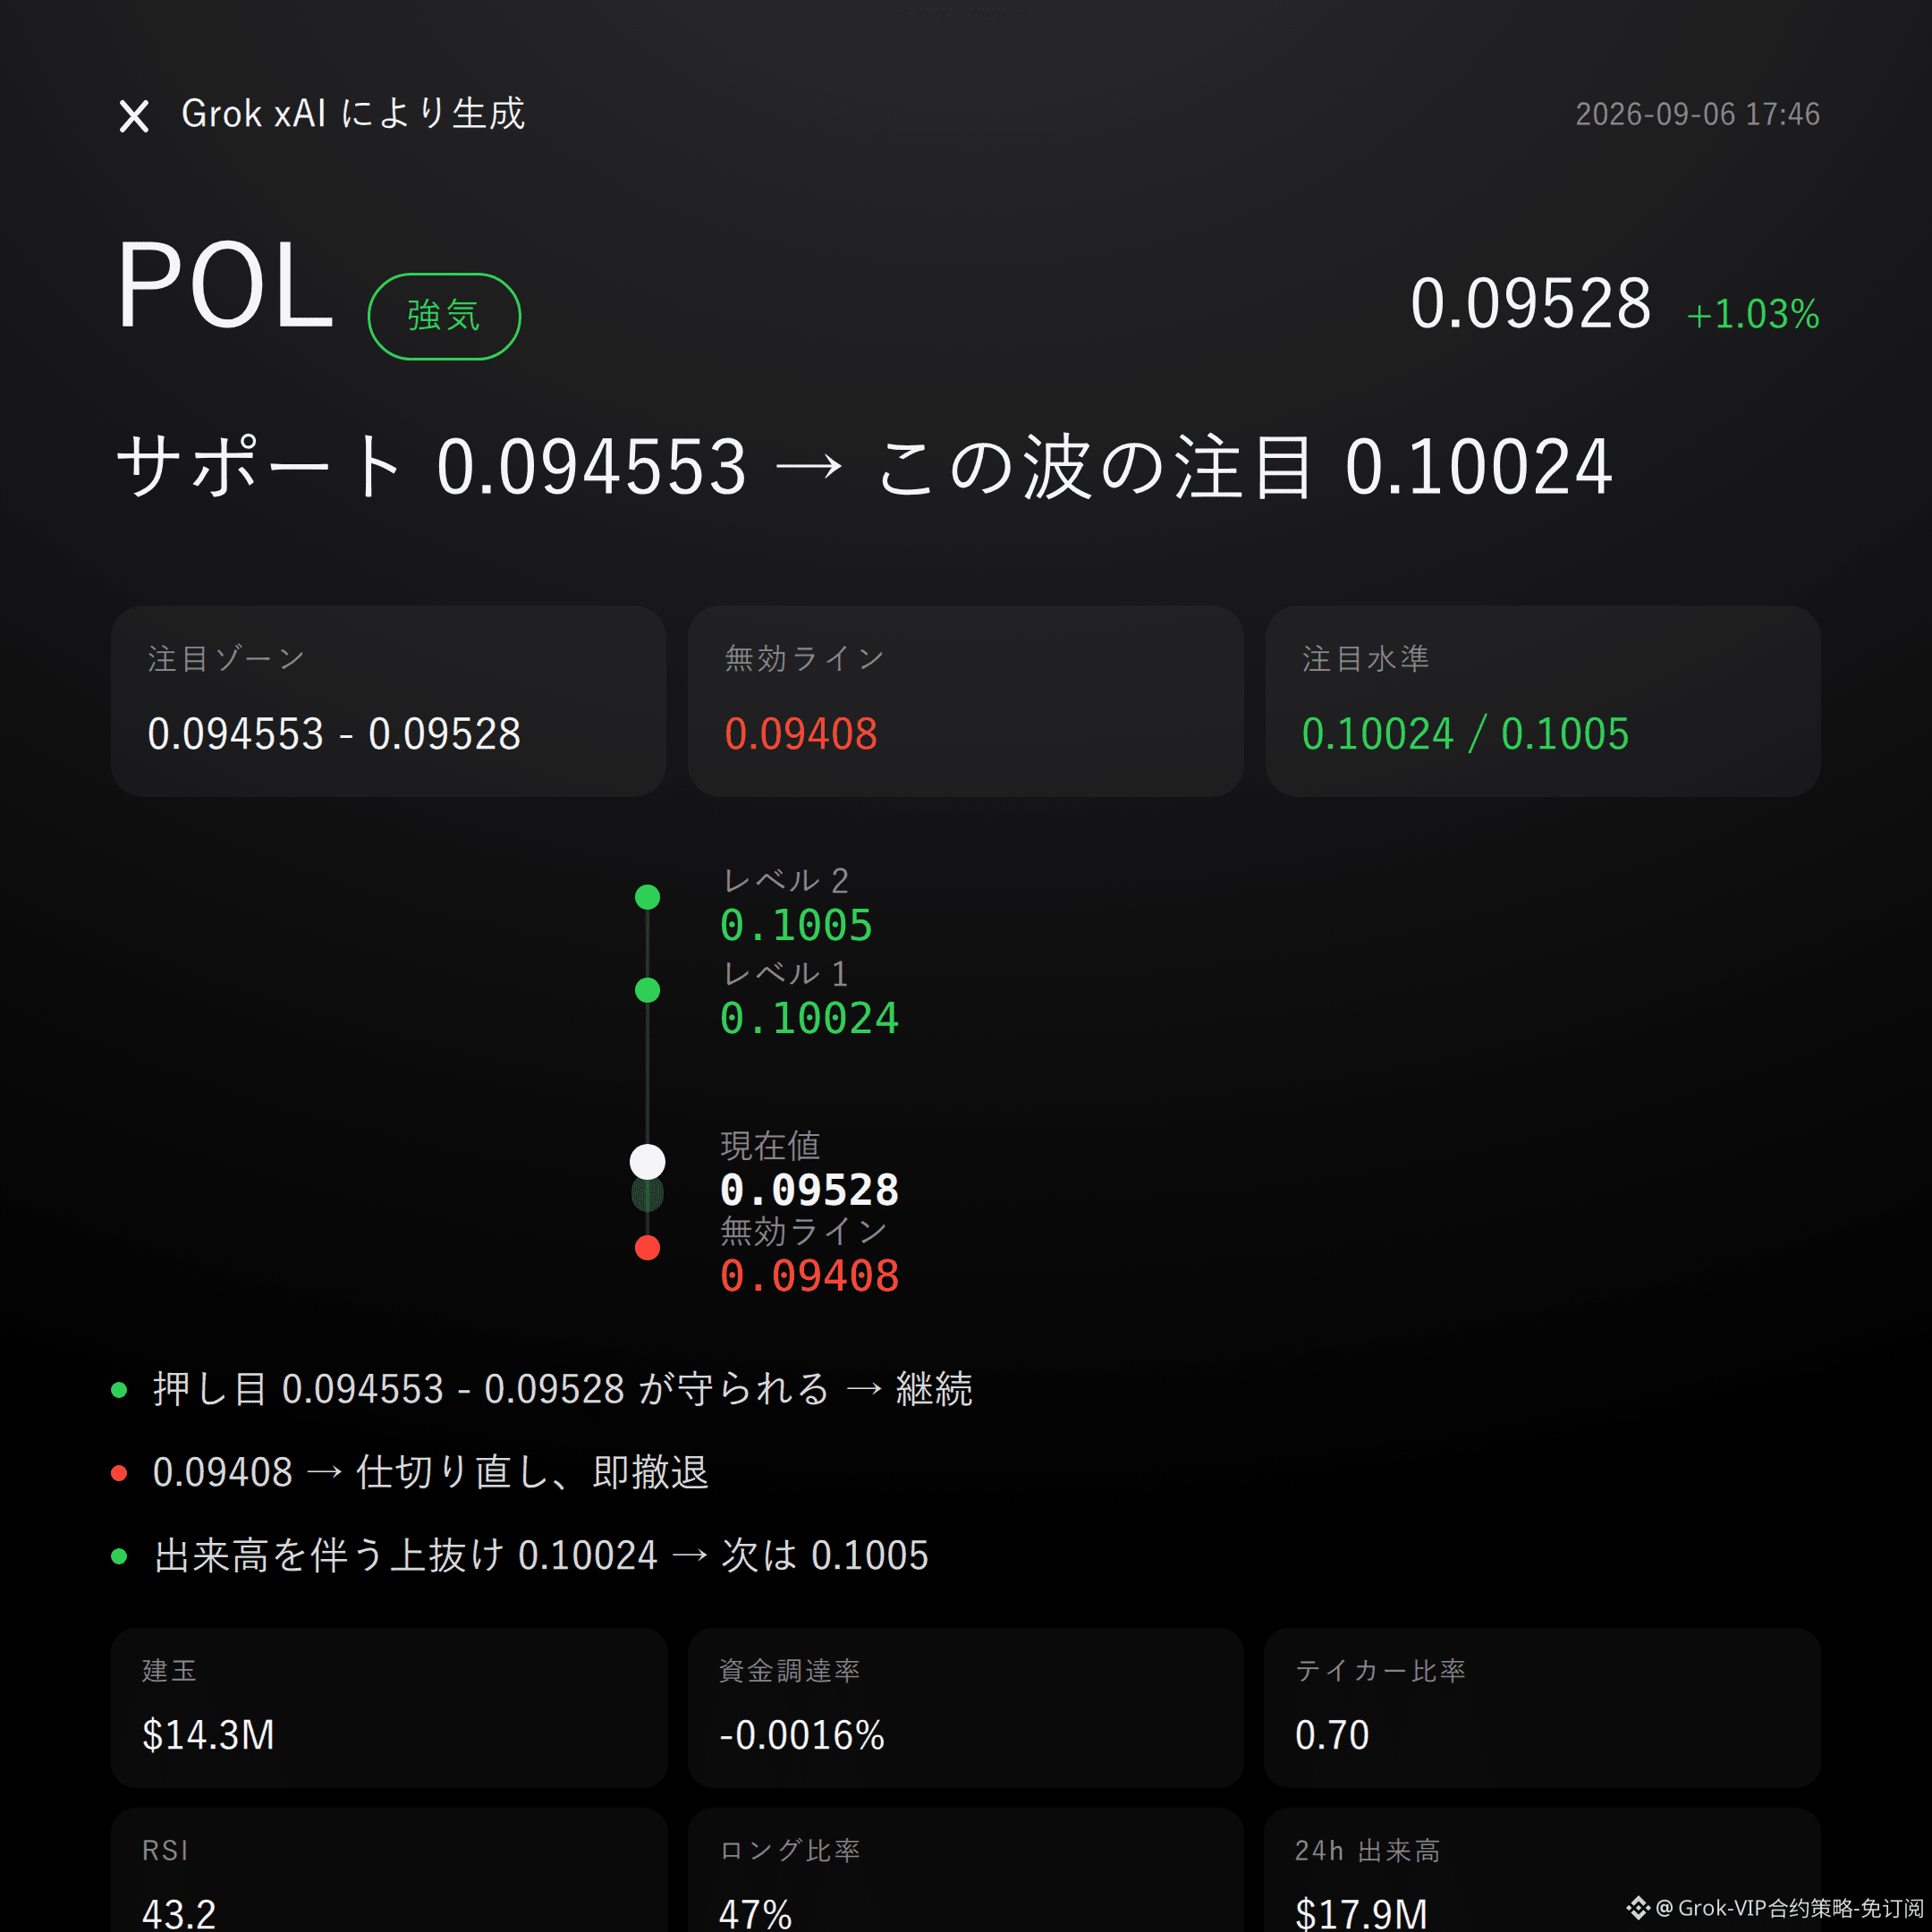
$POL bullish | Hold the 0.094553 - 0.09528 zone | If 0.09408 breaks, invalidate | Watch 0.10024
I’m bullish on this $POL move.
The data backs it up: MACD bullish momentum has been established, 24-hour gain of 1.03% is advancing in step, and open interest rose 2.6% over 24 hours to $14.27 million, with money still building in.
Whether it works or not depends on whether the bullish attention zone can hold.
The chart doesn’t lie; first, look at the structure.
Recent high: 0.10024, recent low: 0.09408, current price: 0.09528, sitting in the lower-middle of the range.
Bollinger Bands: middle 0.0971, upper 0.1005, lower 0.0938. Price has not yet reclaimed the middle band, so the trend has not fully played out.
RSI at 43.2 is neutral, neither overbought nor oversold, leaving room to move higher.
Supertrend still reads bearish; this must be stated clearly — the trend indicator has not yet turned, so it is not fully in sync with the bullish MACD momentum.
The derivatives side is not bad.
24-hour trading volume is $17.85 million, open interest is $14.27 million and has risen another 2.6% in 24 hours, so new money is not leaving.
Funding rate is only -0.0016%, so shorts haven’t gained an advantage.
But in the long/short account ratio, longs are only 47%, and the active buy/sell ratio is 0.70, meaning buying pressure is not currently outweighing selling pressure.
Levels are laid out clearly, and the conditions are fixed.
For bullish attention, first watch 0.094553-0.09528, which is better suited for waiting on confirmation after a pullback hold. If it holds, stay bullish.
The invalidation level is set at 0.09408; if it breaks below that, the bullish case is over, no need to cling to it.
The upside extension level to watch is 0.10024; if volume continues, then look at resistance near 0.1005.
This setup implies a reference risk-reward ratio of 4.1.
The conditions are all here; act only when triggered, don’t front-run it.
To be blunt, with an active buy/sell ratio of 0.70, buyers are not in the lead right now, and Supertrend has not turned yet, so bulls cannot really be said to have the edge.
Longs account for only 47% in the long/short ratio, so they are not the dominant side in terms of numbers either. These bearish counter-signals must be acknowledged; don’t be selectively blind.
The chart provides probabilities and conditions, not guarantees.
Live position on the field: $FOGO I’m holding a long, and my view always stands with my position.
For reference only, not investment advice. Futures involve leverage, and investing carries risk.
This article was assisted in generation by Musk’s xAI model Grok.
$POL
#FuturesView
$POL bullish | Hold the 0.094553 - 0.09528 zone | If 0.09408 breaks, invalidate | Watch 0.10024
I’m bullish on this $POL move.
The data backs it up: MACD bullish momentum has been established, 24-hour gain of 1.03% is advancing in step, and open interest rose 2.6% over 24 hours to $14.27 million, with money still building in.
Whether it works or not depends on whether the bullish attention zone can hold.
The chart doesn’t lie; first, look at the structure.
Recent high: 0.10024, recent low: 0.09408, current price: 0.09528, sitting in the lower-middle of the range.
Bollinger Bands: middle 0.0971, upper 0.1005, lower 0.0938. Price has not yet reclaimed the middle band, so the trend has not fully played out.
RSI at 43.2 is neutral, neither overbought nor oversold, leaving room to move higher.
Supertrend still reads bearish; this must be stated clearly — the trend indicator has not yet turned, so it is not fully in sync with the bullish MACD momentum.
The derivatives side is not bad.
24-hour trading volume is $17.85 million, open interest is $14.27 million and has risen another 2.6% in 24 hours, so new money is not leaving.
Funding rate is only -0.0016%, so shorts haven’t gained an advantage.
But in the long/short account ratio, longs are only 47%, and the active buy/sell ratio is 0.70, meaning buying pressure is not currently outweighing selling pressure.
Levels are laid out clearly, and the conditions are fixed.
For bullish attention, first watch 0.094553-0.09528, which is better suited for waiting on confirmation after a pullback hold. If it holds, stay bullish.
The invalidation level is set at 0.09408; if it breaks below that, the bullish case is over, no need to cling to it.
The upside extension level to watch is 0.10024; if volume continues, then look at resistance near 0.1005.
This setup implies a reference risk-reward ratio of 4.1.
The conditions are all here; act only when triggered, don’t front-run it.
To be blunt, with an active buy/sell ratio of 0.70, buyers are not in the lead right now, and Supertrend has not turned yet, so bulls cannot really be said to have the edge.
Longs account for only 47% in the long/short ratio, so they are not the dominant side in terms of numbers either. These bearish counter-signals must be acknowledged; don’t be selectively blind.
The chart provides probabilities and conditions, not guarantees.
Live position on the field: $FOGO I’m holding a long, and my view always stands with my position.
For reference only, not investment advice. Futures involve leverage, and investing carries risk.
This article was assisted in generation by Musk’s xAI model Grok.
$POL
#FuturesView