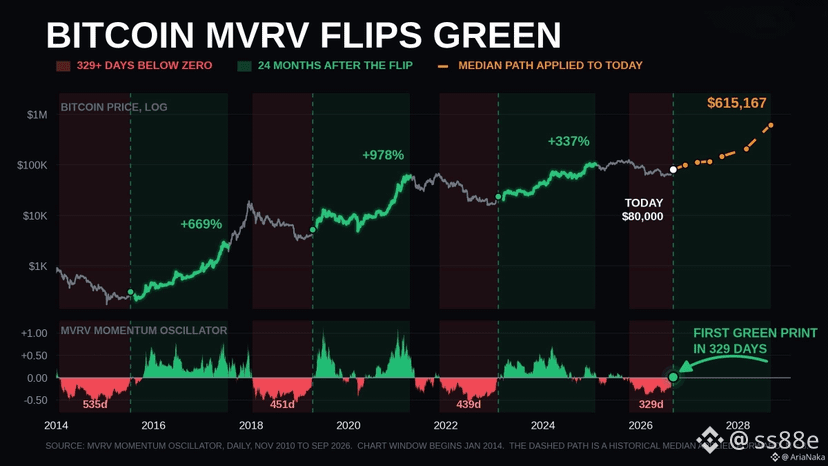
$BTC The MVRV momentum indicator for volatility just printed a positive reading for the first time since October 9, 2025.
That means 329 consecutive days underwater.
The longest stretch since the 2022 bear market.
In the modern era, this exact setup has appeared three times: a run of 329+ consecutive days below zero, then a green turn back above zero.
July 2015. April 2019. January 2023.
Here is what happened next.
3 months: -21%, +121%, +23% → median +23%
6 months: +40%, +58%, +24% → median +40%
9 months: +37%, +57%, +45% → median +45%
12 months: +114%, +39%, +82% → median +82%
18 months: +160%, +105%, +181% → median +160%
24 months: +669%, +978%, +337% → median +669%
Applying that to today's $80,000 reading, the median path points to:
3 months: $98,533
6 months: $112,021
9 months: $116,358
12 months: $145,894
18 months: $208,010
24 months: $615,167
Three notes, so treat the tails with respect.
The 24-month mark lands inside a cycle top every time, which is exactly where you'd expect it to land.
The more durable reading is simpler than price targets.
Each of those turns left Bitcoin higher one year later, and the worst 12-month outcome was +39%.
The indicator spent 329 days telling you the market was exhausted.
$ZEC
That means 329 consecutive days underwater.
The longest stretch since the 2022 bear market.
In the modern era, this exact setup has appeared three times: a run of 329+ consecutive days below zero, then a green turn back above zero.
July 2015. April 2019. January 2023.
Here is what happened next.
3 months: -21%, +121%, +23% → median +23%
6 months: +40%, +58%, +24% → median +40%
9 months: +37%, +57%, +45% → median +45%
12 months: +114%, +39%, +82% → median +82%
18 months: +160%, +105%, +181% → median +160%
24 months: +669%, +978%, +337% → median +669%
Applying that to today's $80,000 reading, the median path points to:
3 months: $98,533
6 months: $112,021
9 months: $116,358
12 months: $145,894
18 months: $208,010
24 months: $615,167
Three notes, so treat the tails with respect.
The 24-month mark lands inside a cycle top every time, which is exactly where you'd expect it to land.
The more durable reading is simpler than price targets.
Each of those turns left Bitcoin higher one year later, and the worst 12-month outcome was +39%.
The indicator spent 329 days telling you the market was exhausted.
$ZEC