

🚨 BTC/USDT — Plan Update
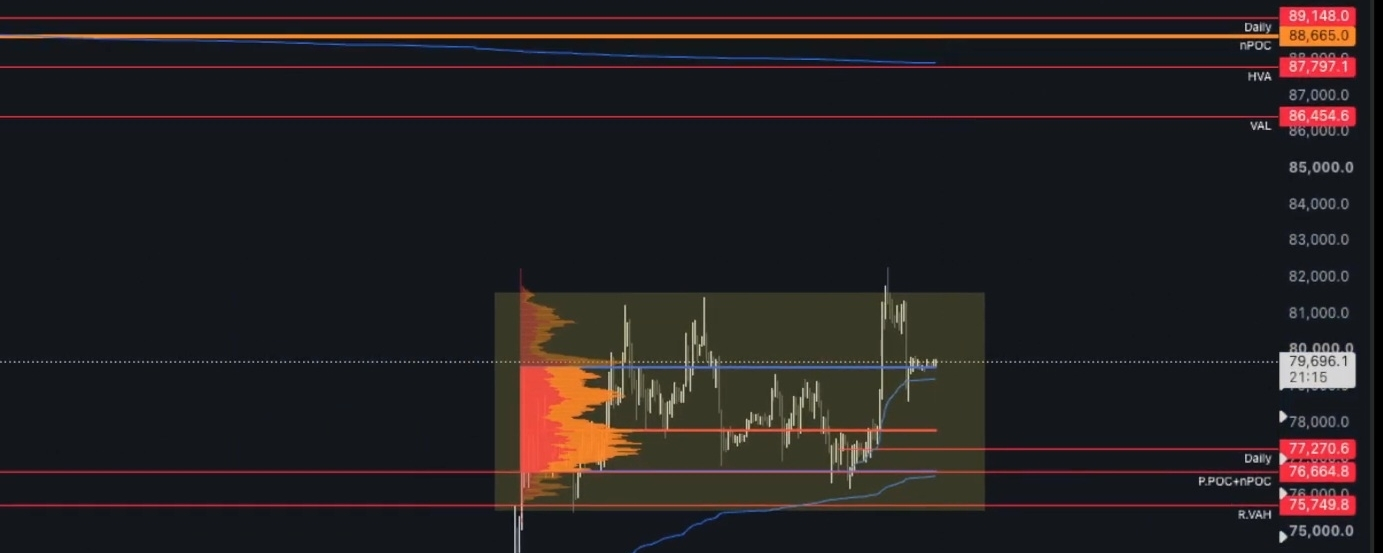
BTC is trading around ~79,700$, fluctuating around a sensitive intersection between MA50 (79,836$) and MA200 (78,692$) after rebounding from 76,264$ and testing 82,300$.
📊 Technical picture:
RSI neutral (48.49), slightly negative MACD (-30.36) with a decreasing red histogram — short-term bearish momentum after the upswing.
🧭 Liquidity map :
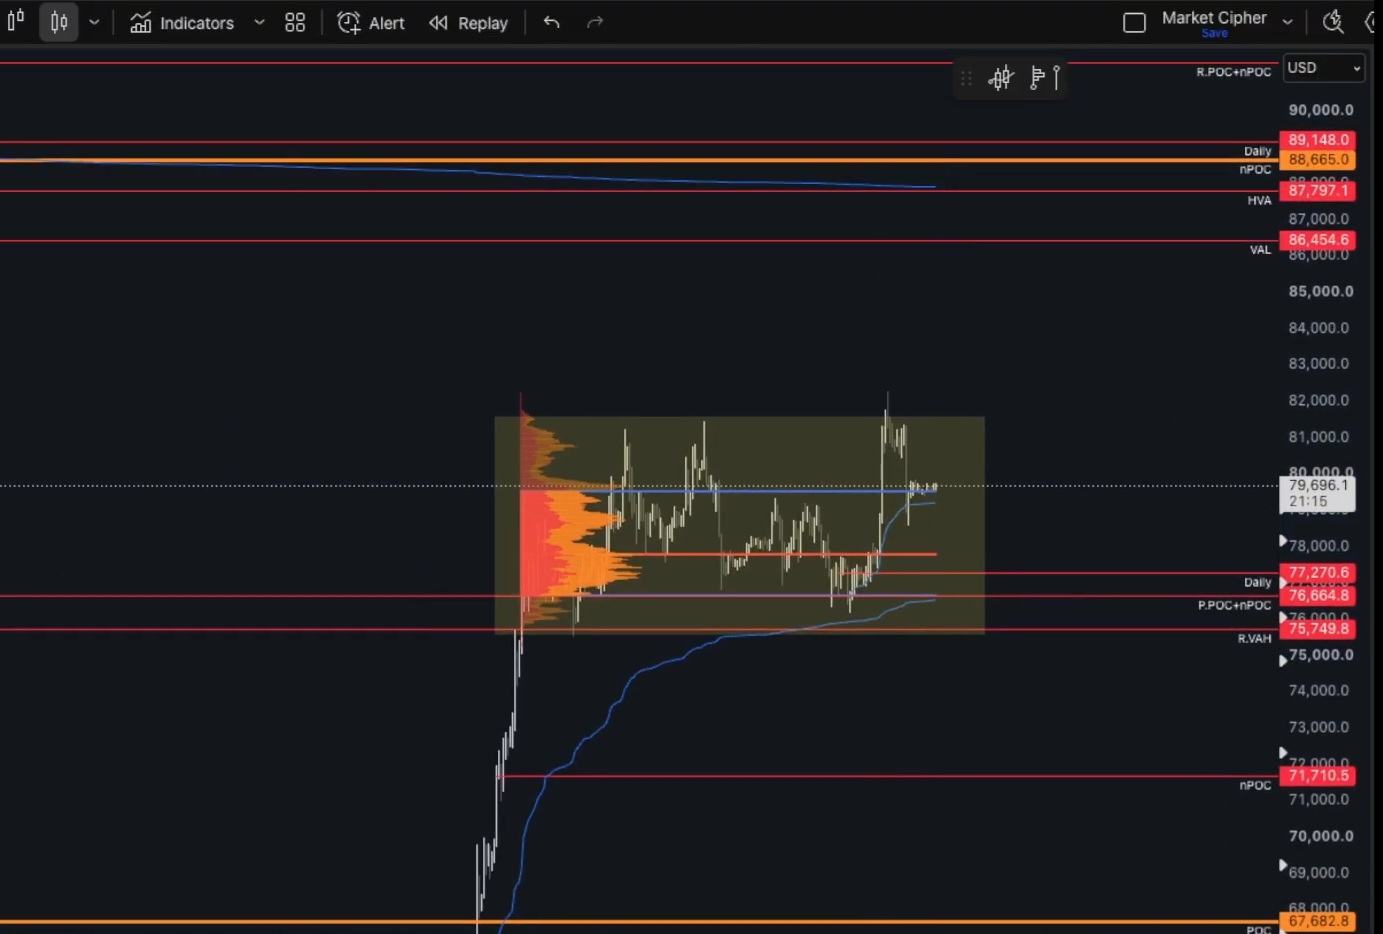
77,270–76,664$ high-volume POC/nPOC zone — acting as an attraction and price acceptance area (Value Area), not necessarily "liquidity" in the precise SMC/ICT sense. True liquidity (stop-order clusters) is usually around the clear highs and lows themselves: below 76,264$ (the recent low), and above 82,300$ (the recent high, the most important buy-side liquidity).
🎯 Levels:
🟢 Bearish: 79K → 77,270$ (Daily) → 76,664$ (POC/nPOC, acceptance zone) → 75,749$
🔴 Bullish: 81,600$ → 82,300$ (the most important high liquidity) → 86,454–87,797$ (higher range in Volume Profile after the breakout)
📌 The two scenarios:
Bearish: break toward 77,270–76,664$, while watching for Sweep + CISD and a possible rebound at the acceptance zone.
Bullish: taking liquidity at 82,300$ and holding above it opens the way toward 86,454–87,797$.
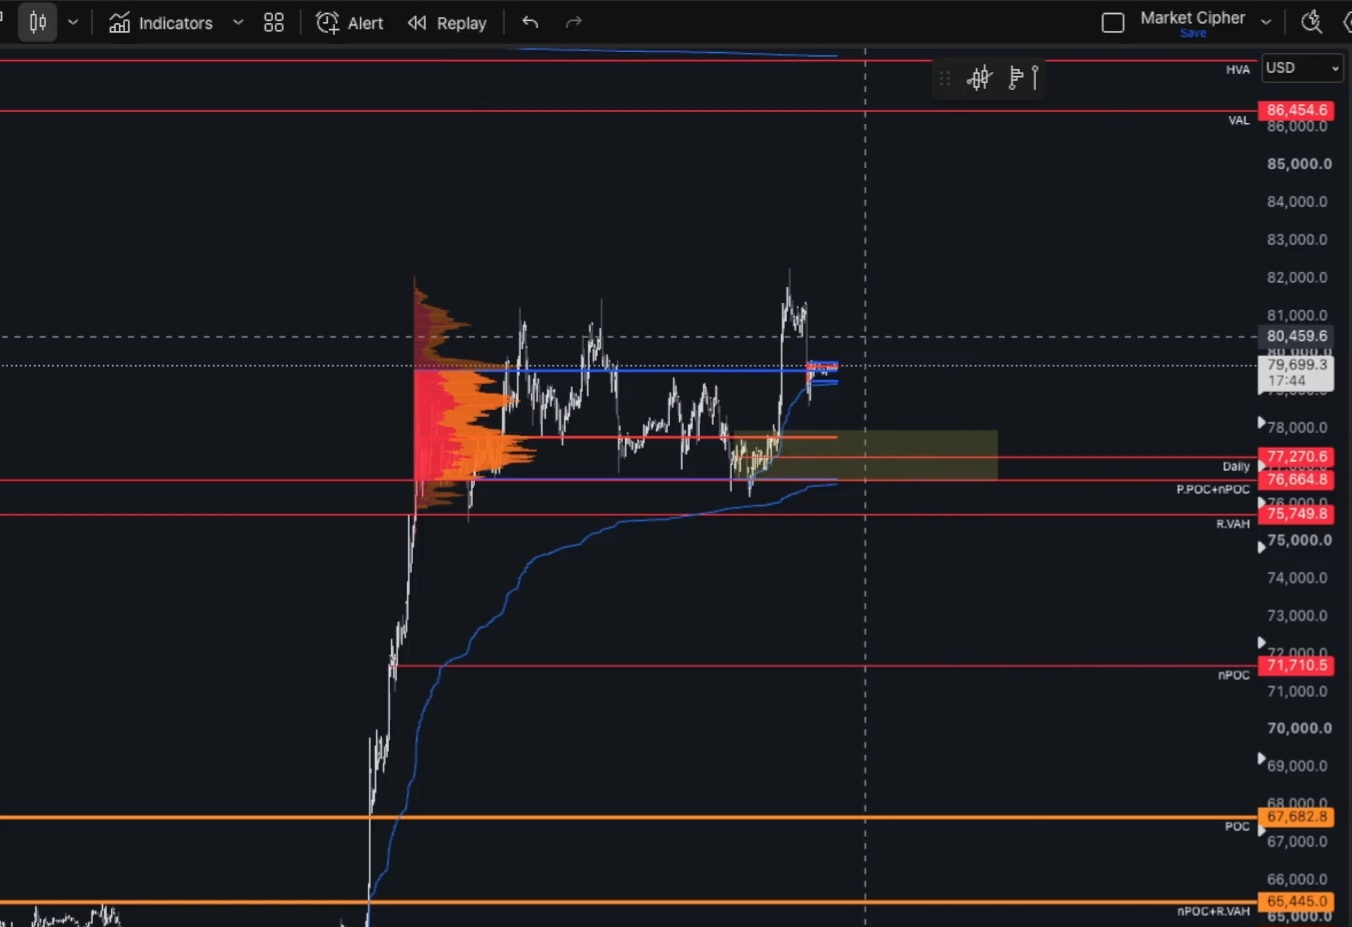
💰 No chasing in the middle of the range; we wait for price to reach clear liquidity (a high or a low) with behavioral confirmation, not pre-assuming direction.
⚠️ Technical analysis for discussion only, not investment advice — the decision and risk are yours.
