Watch How $T Is Bouncing Back Right Now Family…!!
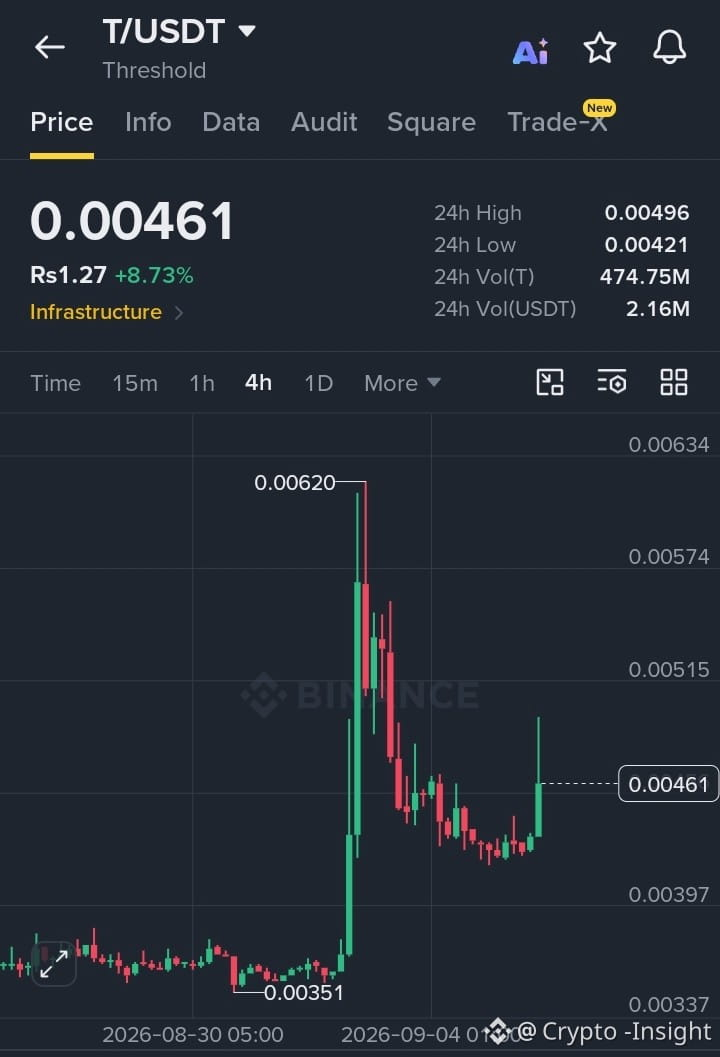
#T is displaying renewed bullish momentum after establishing a local bottom near 0.00351 and pushing upward through local resistance toward its 24h high around 0.00496 The chart structure shows buyers stepping back in to reverse the previous pullback from the 0.00620 peak as green candles drive price back into higher territories If this upward bounce maintains strength the next key targets to watch on the chart are 0.00515 and 0.00574 while holding above 0.00397 keeps the recovery structure intact
$BULLA
$SKR
#T is displaying renewed bullish momentum after establishing a local bottom near 0.00351 and pushing upward through local resistance toward its 24h high around 0.00496 The chart structure shows buyers stepping back in to reverse the previous pullback from the 0.00620 peak as green candles drive price back into higher territories If this upward bounce maintains strength the next key targets to watch on the chart are 0.00515 and 0.00574 while holding above 0.00397 keeps the recovery structure intact
$BULLA
$SKR